Fault Diagnosis
When S7-1200 communicates as a DP Master, the CPU does not stop and does not require downloading the organization block when a DP slave is lost.
There are several methods for diagnosing faults in PROFIBUS DP:
1. Through the Indicator Lights on the Module
The DIAG light on the front panel is green under normal conditions, and turns red when there are errors or issues. The combination of the RUN/STOP, ERROR lights on the back cover and the DIAG light on the front panel provides the module status:
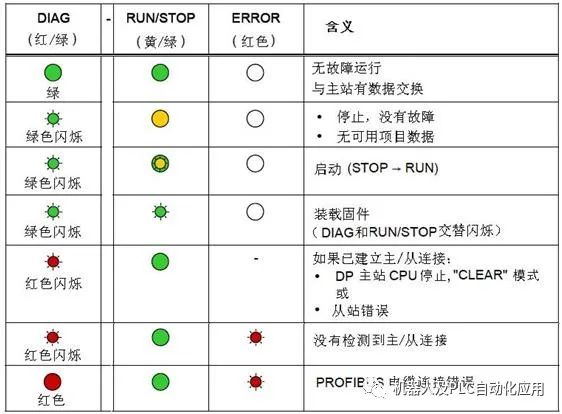
Figure 1. Fault Indicator Lights for Early CM1243-5 Firmware Versions V1.0 & V1.1
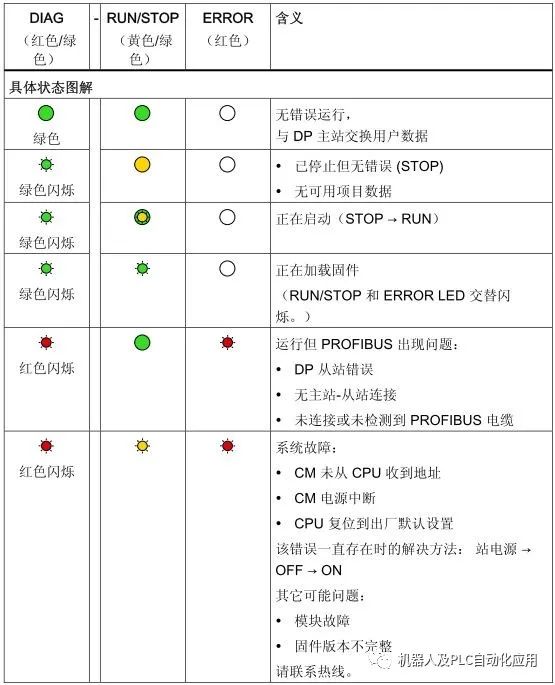
Figure 2. Fault Indicator Lights for CM1243-5 Firmware Versions V1.2 & V1.3
2. Diagnosis Through Programming Software
-
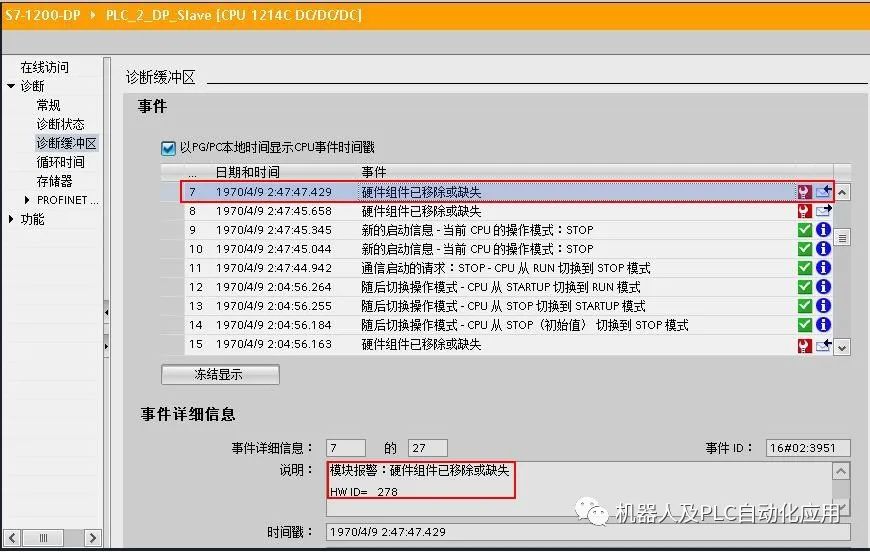
For early CM1243-5 firmware versions V1.0 & V1.1, view the entries in the CPU diagnostic buffer in STEP 7 V11.
 View module information in online status
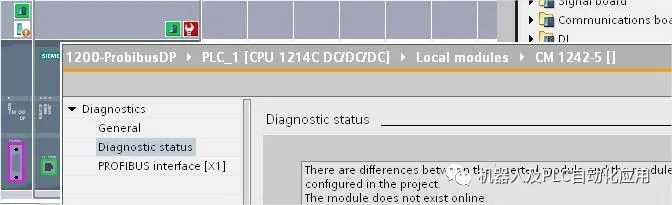
-
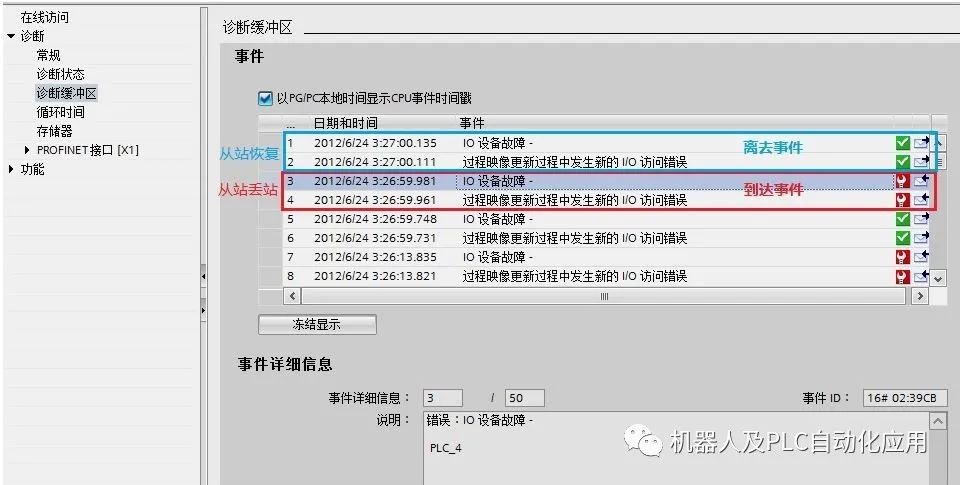
For newer versions of CM1243-5, such as version V1.3, view the diagnostic buffer for the information record of lost slaves in TIA V13 SP1 as follows:
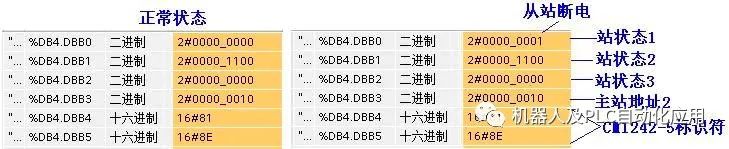
3. Reading DP Slave Diagnostic Information Through the Program
CM1243-5 uses the DPNRM_DG instruction to read diagnostic data from PROFIBUS DP slaves. DPNRM_DG instruction parameters:
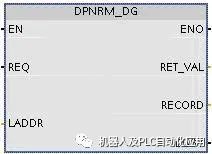
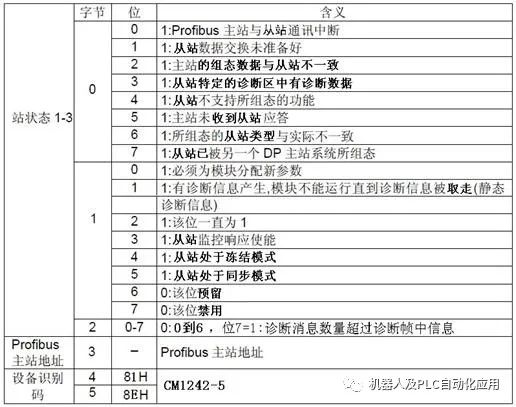
REQ: Read request LADDR: Slave diagnostic address RECORD: Target address for storing the read diagnostic data RET_VAL: Error code returned when the instruction execution fails BUSY: Reading diagnostic data CM 1242-5 supports 6 bytes of standard diagnostics and 6 bytes of device-specific diagnostics. Standard diagnostics can provide the status of the slave. Overview of standard diagnostic data:
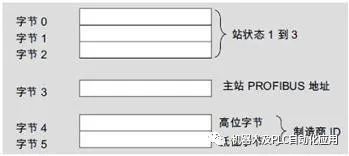
Standard diagnostic data information:
Method for reading standard diagnostic data: In the main program OB1, call the S7-1200 “Extended Instructions/Distributed I/O/Others” DPNRM_DG instruction. Click on the block parameter LADDR to select the DP slave diagnostic address from the dropdown list. The read diagnostic data will be stored in DB4.
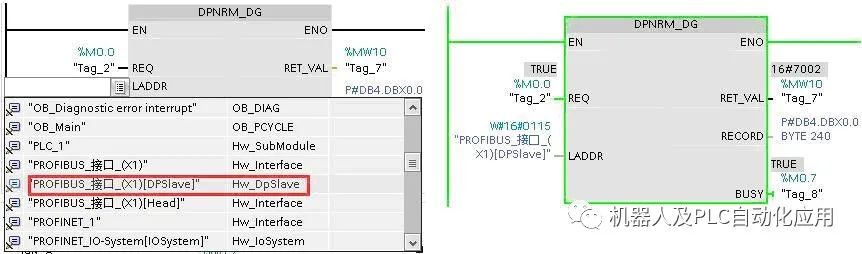
View diagnostic data through the monitoring table: