Recently, the flu has been quite severe. Today, I will create a simulation program for flu transmission based on my city, which requires: susceptible individuals, infected individuals, and recovered individuals. Of course, everyone should pay attention to their health and take precautions!
clear; clc; close all;
%% Parameter Settings
N = 2.7e6; % Resident population
I0 = 10; % Initial infected individuals
R0 = 0;
S0 = N – I0 – R0;
gamma = 1/5; % Recovery rate (5-day illness duration)
beta_base = 0.3; % Base transmission rate (non-winter)
beta_winter = 0.6; % Winter transmission rate
tspan = 0:1:90; % Simulate for 90 days
t_start = datetime(2024,11,1); % Start date
% Input: scalar or vector t (days)
% Output: logical array, true indicates that the day is winter (November–February)
isWinterDayVec = @(t) arrayfun(@(day) …
ismember(month(t_start + days(day)), [11,12,1,2]), t);
% Time-varying beta function
beta_func = @(t) beta_winter .* isWinterDayVec(t) + beta_base .* (~isWinterDayVec(t));
%% SIR Differential Equations (with time-varying beta)
sir_ode = @(t, y) [
-beta_func(t) * y(1) * y(2) / N;
beta_func(t) * y(1) * y(2) / N – gamma * y(2);
gamma * y(2)
];
%% Solve ODE
y0 = [S0; I0; R0];
[~, Y] = ode45(sir_ode, tspan, y0);
S = Y(:,1); I = Y(:,2); R = Y(:,3);
figure(‘Position’,[100,100,900,600]);
subplot(2,1,1);
plot(tspan, S, ‘b-‘, ‘LineWidth’, 1.5); hold on;
plot(tspan, I, ‘r-‘, ‘LineWidth’, 1.5);
plot(tspan, R, ‘g-‘, ‘LineWidth’, 1.5);
xlabel(‘Time (days)’); ylabel(‘Number of individuals’);
title(‘SIR Model Simulation of Winter Influenza in Baotou (Starting November 2024)’);
legend(‘Susceptible S’,’Infected I’,’Recovered R’,’Location’,’best’);
grid on;
[Imax, idx_max] = max(I);
text(tspan(idx_max), Imax, sprintf(‘ Peak: %.0f individuals
Day %d’, Imax, tspan(idx_max)), …
‘VerticalAlignment’,’bottom’,’FontSize’,10,’Color’,’red’);
% Daily new infections ≈ -dS/dt
dS = -diff(S);
t_new = tspan(1:end-1);
subplot(2,1,2);
bar(t_new, dS, ‘FaceColor’,[0.8 0.2 0.2]);
xlabel(‘Time (days)’); ylabel(‘Daily new infections’);
title(‘Estimated Daily New Influenza Cases’);
grid on;
xticks(0:10:90);
date_labels = string(t_start + days(0:10:90));
xticklabels(date_labels);
sgtitle(‘Simulation of Winter Influenza Spread in Baotou (SIR + Seasonal Transmission Rate)’);
fprintf(‘=== Simulation Results Summary ===\n’);
fprintf(‘Peak number of infections: %.0f (Day %d)\n’, Imax, tspan(idx_max));
fprintf(‘Total cumulative infections: %.0f (%.2f%%)\n’, R(end), R(end)/N*100);
The results are as follows:
Please open in the WeChat client
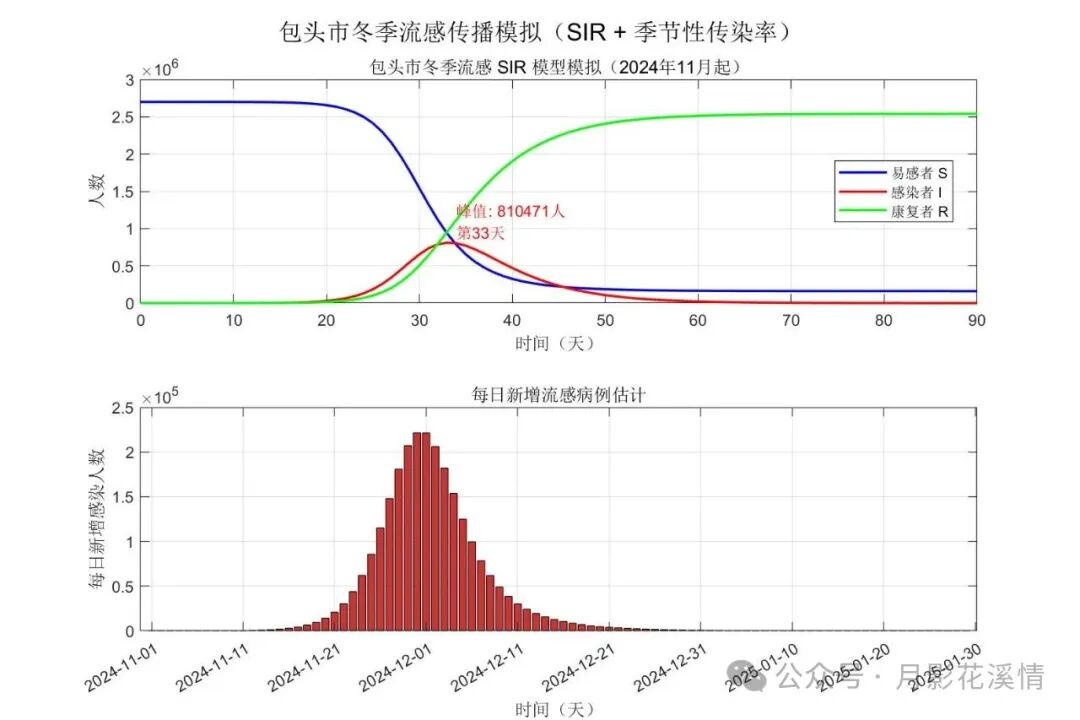 Note: The above data (including time) is not real and is for learning reference only.