Previous Answers:
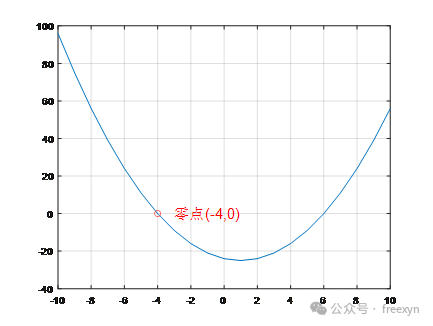
4.6.1 Annotating Zero Coordinates on the Graph
MATLAB Quick Exercise 4.6.1: Annotating the Graph with Comments: Zero Coordinates | One Line of Code to Solve
[Reference Video31.22]
Program:
x=-10:10;
y=(x+4).*(x-6);
plot(x,y)
grid on
hold on
plot(-4,0,’ro’)
text(-3,0,’Zero Point(-4,0)’,’fontsize’,15,’color’,’r’);
Running Result:
 ——————— Simple Divider —————————
4.6.2 Date-Time Axis Graph
The data in the table below representsPassenger volume statistics from July 2021 to December 2021, please plot the trend of passenger volume over time.
|
Time |
2021.7 |
2021.8 |
2021.9 |
2021.10 |
2021.11 |
2021.12 |
|
Current Passenger Volume(10,000 people) |
83398 |
54904 |
67930 |
72751 |
54039 |
57633 |
(Answers will be published in the next issue)
Recommended Popular Content from Previous IssuesAlgorithm Code Quick Start 15: Shocking RBF Radial Basis Interpolation Method: Surface Reconstruction with Point Cloud Data | MATLAB Programming Application ExampleEssential MATLAB Exercise 4.4.1: 3D Parametric Function Plotting | Don’t Panic When You Don’t PracticeMATLAB Beginner Short Article 3: Function Call Syntax, Parameter Passing, Function Workspace, Command Syntax, Calling Anonymous FunctionsConcise Algorithm Code Example 10: Using Residual Weighting Method to Handle the Sensitivity of Least Squares Solutions to Outliers in Practice and ApplicationMATLAB Exercise 4.1.5: Polar Coordinate PlottingMATLAB Beginner Short Article 64: How to Solve Equations with Constraints on Independent Variables, such as x>0?MATLAB Exercise 3.2.3: Extracting Numeric Data from Mixed Text Based on Selective RulesMATLAB Beginner 52: Variable Names: Checking if Variable Names Exist or Conflict with KeywordsMATLAB Literacy 49: Type Recognition: Determining the Type and Category of Data (This Article is High Energy, Don’t Get Dazed)Algorithm Code Quick Start 31: Getting Started with MATLAB Neural Networks: Gradually Deepening from Fitting Predictions, Comparing with Traditional MethodsEnd