Matlab Exercise Problem 4.6.2 | Plotting Date-Time Axis Graphs
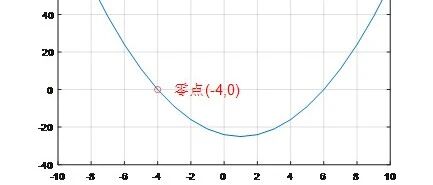
Previous Answers: 4.6.1 Annotating Zero Coordinates on the Graph MATLAB Quick Exercise 4.6.1: Annotating the Graph with Comments: Zero Coordinates | One Line of Code to Solve [Reference Video31.22] Program: x=-10:10; y=(x+4).*(x-6); plot(x,y) grid on hold on plot(-4,0,’ro’) text(-3,0,’Zero Point(-4,0)’,’fontsize’,15,’color’,’r’); Running Result: ——————— Simple Divider ————————— 4.6.2 Date-Time Axis Graph The data in the table … Read more