
Background Introduction
Results Summary
Illustrative Guide
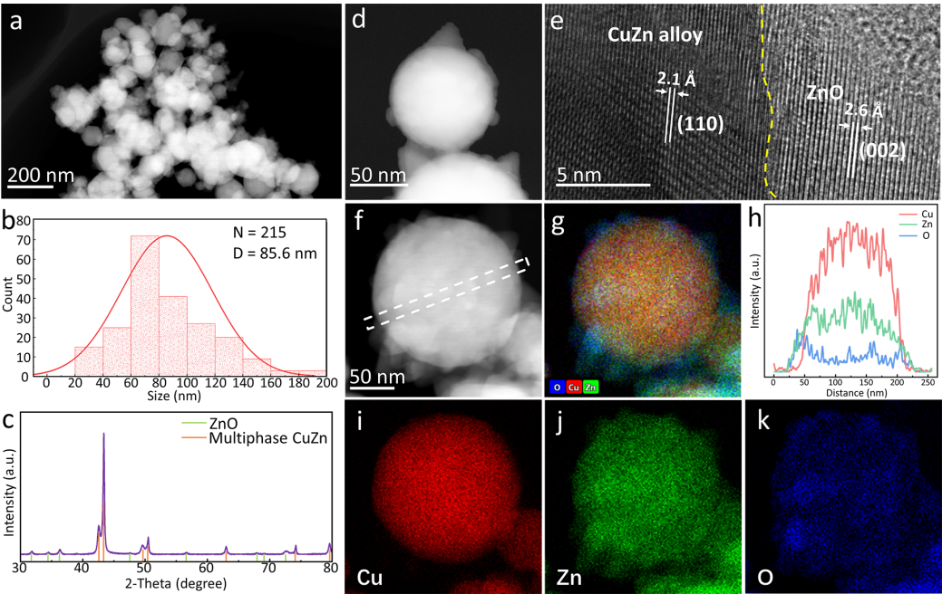
Figure 1. Morphology, composition, and structural characterization of the initial CuZn alloy particle sample. (a) Low-magnification HAADF-STEM image. (b) Particle size distribution. (c) XRD characterization. (d) High-magnification HAADF-STEM image and (e) HRTEM image, with yellow dashed lines marking phase boundaries. (f) HAADF-STEM image of CuZn NPs and (g) corresponding elemental distribution maps of Cu (red), Zn (green), and O (blue). (h) EDX line profile of Cu, Zn, and O. (i-k) EDX mapping images of Cu, Zn, and O elements.
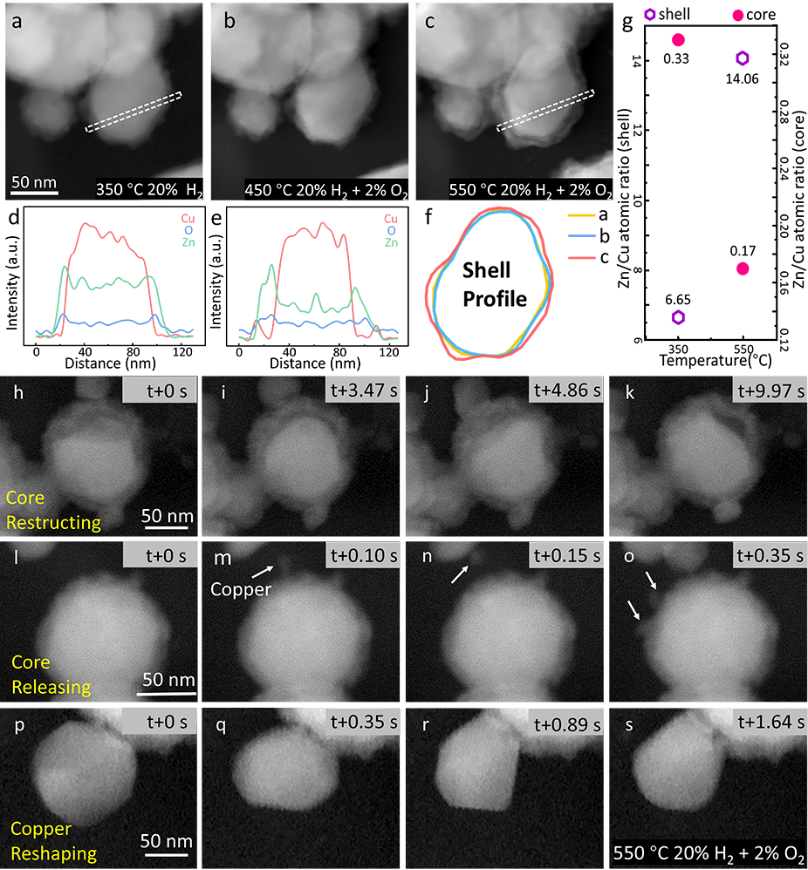
Figure 2. In situ observation of structural and compositional changes of CuZn particles. (a) HAADF-STEM images of CuZn nanoparticles recorded at 350 °C, 20% H2, 80% He, (b) 450 °C, and (c) 550 °C, with a total pressure of 135 mbar. (d, e) EDX line profiles of the dashed rectangular regions in images (a, c). (f) Overlay comparison of the contour lines of CuZn nanoparticles in (a-c). (g) Measurement of Zn/Cu atomic ratios in the core and shell regions under 350 °C, 20% H2, 80% He and 550 °C, 2% O2, 20% H2, 78% He conditions. (h-s) In situ (S)TEM real-time tracking of the dynamic changes of CuZn NPs under 550 °C, 2% O2, 20% H2, 78% He, revealing the dynamic reconstruction of Cu particles within the ZnO shell (h-k), the release of Cu material (l-o), and the migration and reconstruction of Cu particles on the surface of core-shell structured particles (p-s).
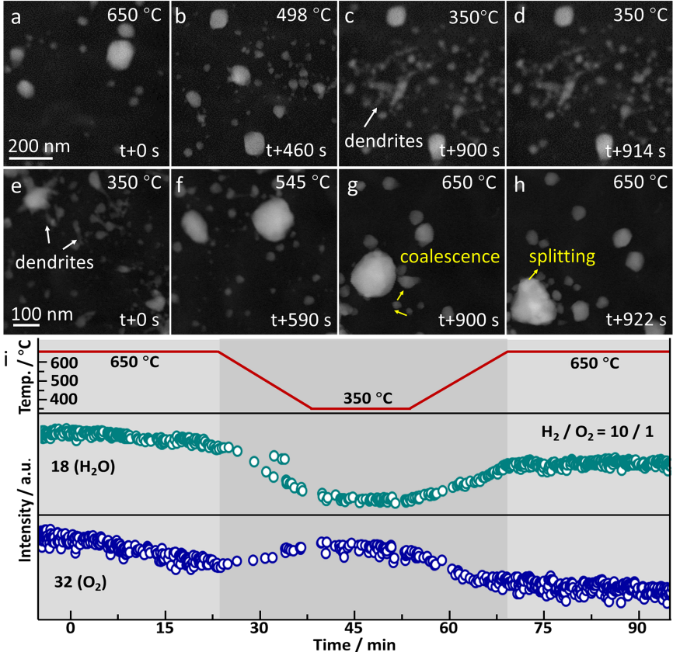
Figure 3. Correlation between structural dynamics and catalytic activity. In a 10% H2, 2% O2, and 78% He atmosphere, in situ recorded HAADF-STEM images during temperature decrease (a-d) and increase (e-h) (650 °C↔350 °C). (i) In situ mass spectrometry data recorded during the aforementioned temperature cycling.
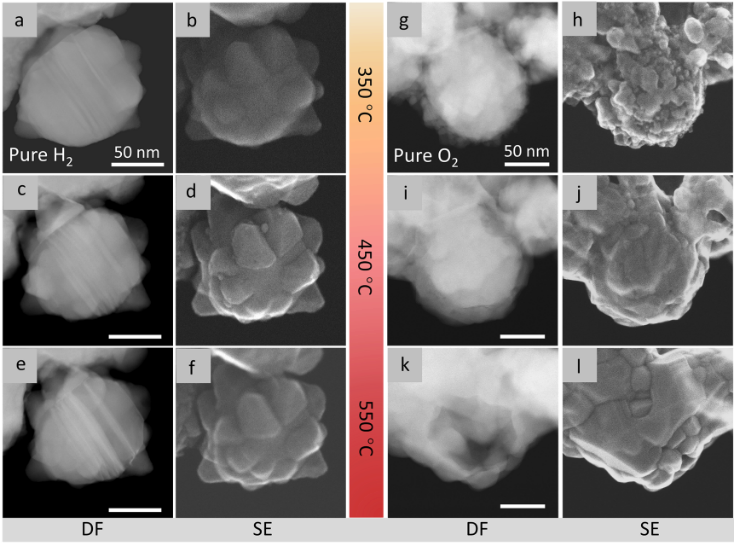
Figure 4. Structural evolution process under high-temperature pure H2 or O2 atmospheres. HAADF-STEM and SE-STEM images recorded in H2 at 350 °C (a, b), 450 °C (c, d), and 550 °C (e, f) (pH2=5 Pa). HAADF-STEM and SE-STEM images captured in O2 at 350 °C (g, h), 450 °C (i, j), and 550 °C (k, l) (pO2=2 Pa).
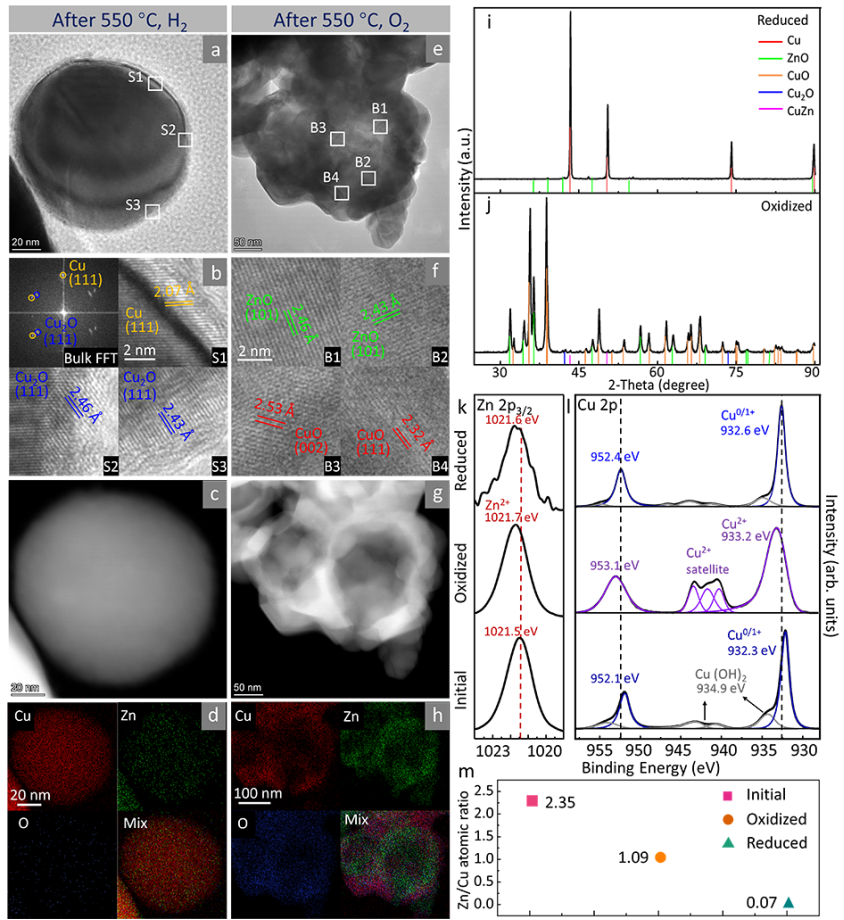
Figure 5. Ex situ characterization after heat treatment in H2 or O2. (a) HRTEM image of CuZn nanoparticles after treatment at 550 °C, H2 (pH2=10 Pa), (b) Fourier transform of the overall particle, and HRTEM enlarged image of the region shown in (a), (c) HAADF-STEM image, and (d) EDX mapping image. (e) HRTEM image of CuZn NPs after treatment at 550 °C in O2 (pO2=10 Pa), (f) HRTEM enlarged image of the region shown in (e), (g) HAADF-STEM image, and (h) EDX mapping image. (i) XRD images of samples after O2 treatment and (j) H2 treatment. (k) Zn 2p3/2 and (l) Cu 2p XPS data of original sample, O2 treated, and H2 treated samples. (m) Zn/Cu atomic ratio derived from XPS data.
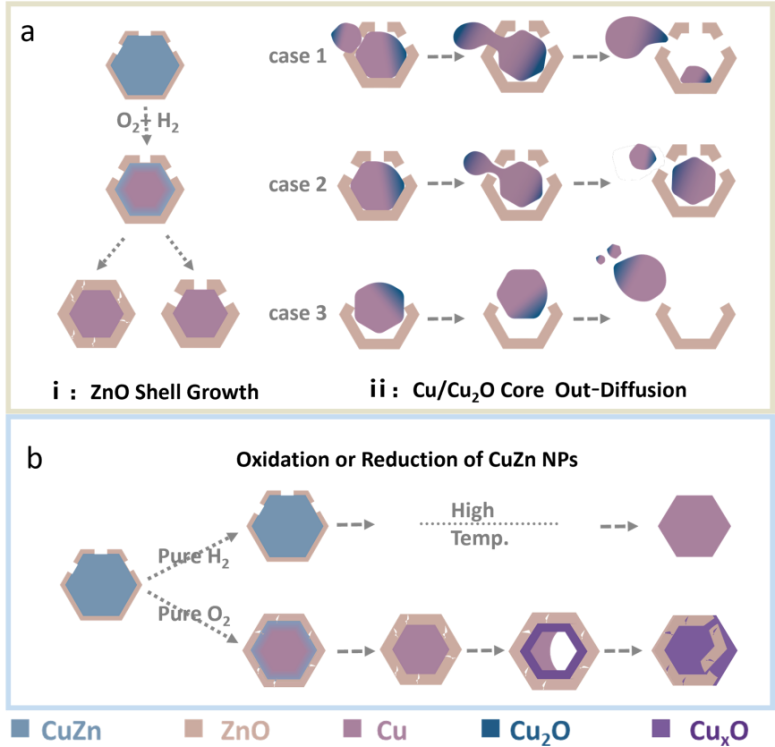
Figure 6. Schematic diagram of dynamic changes of CuZn nanoparticles in (a) H2/O2 mixed atmosphere and (b) pure H2 or O2 conditions.
Author Introduction
Article Information
Yue S, Li Q, Zeng C, et al. Structural and chemical transformations of CuZn alloy nanoparticles under reactive redox atmospheres: An in situ TEM study. Nano Research, 2024, https://doi.org/10.1007/s12274-024-6538-0.

Scan the QR code or click on the lower left corner “Read the original text” to access the full text