Introduction
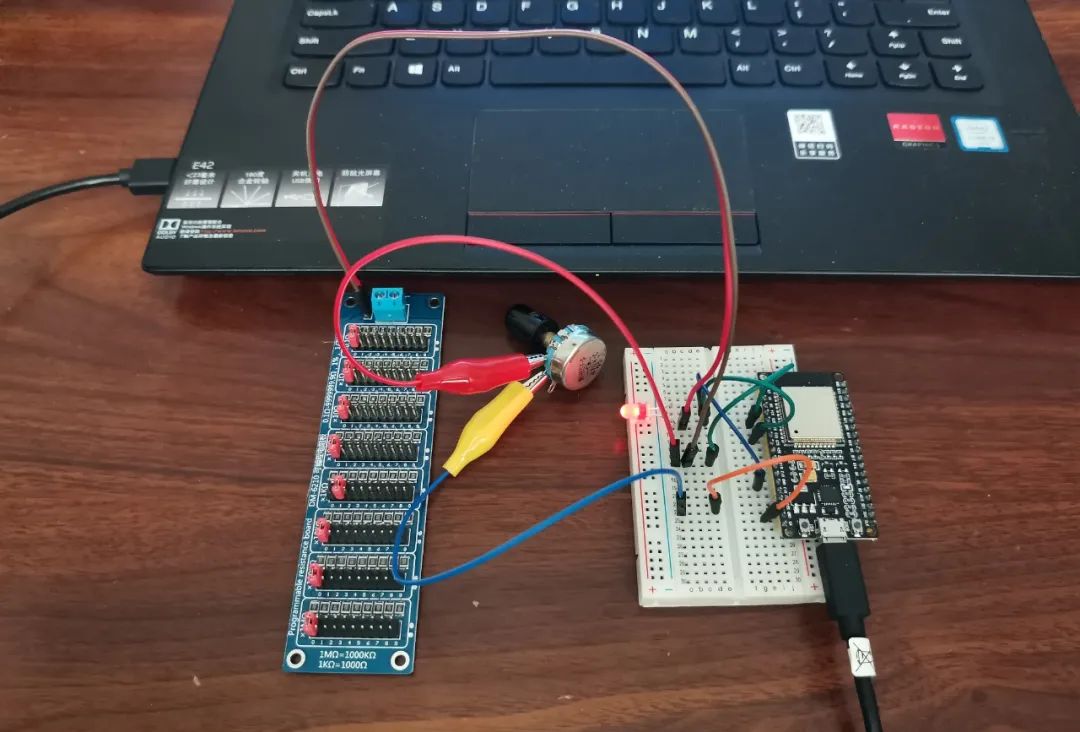
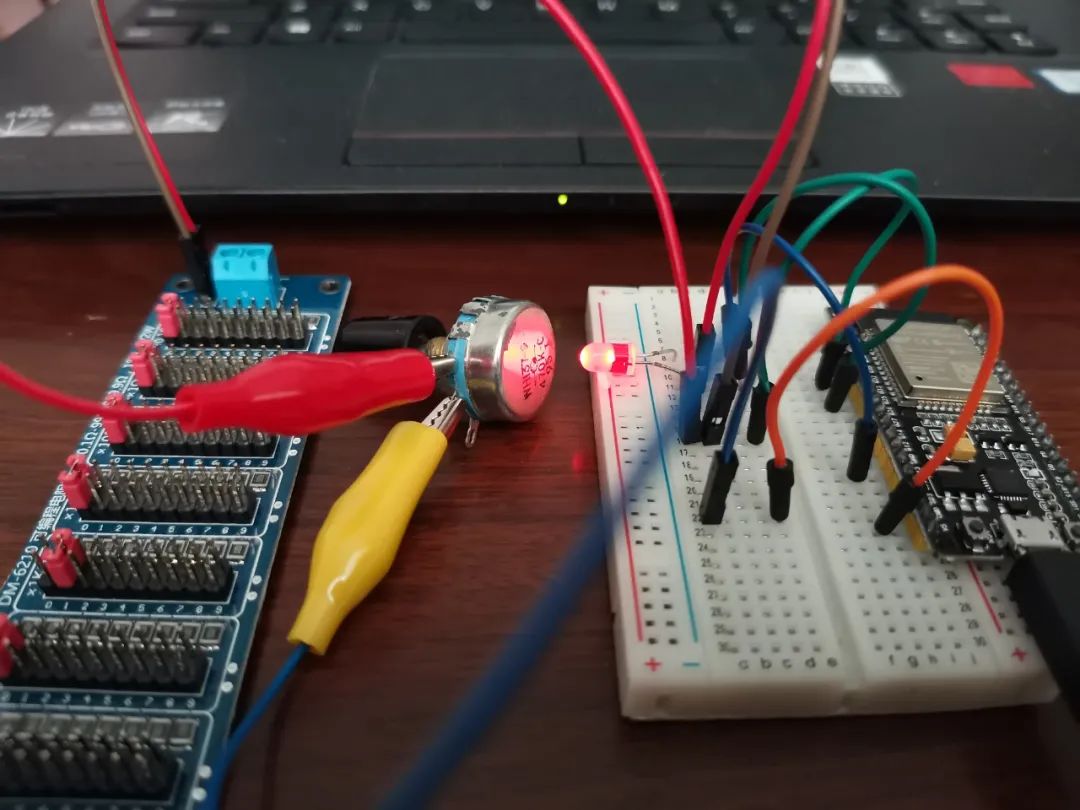
On the third day of the Lunar New Year, we built an experimental circuit on a breadboard to “plot the I-V characteristics of a diode in the conducting state.” A programmable resistor board was used as the internal resistance of the ammeter, a potentiometer was used as a variable resistor to control the circuit, and the ESP32 was used as a voltmeter and ammeter to collect the voltage and current data of the diode, plotting the I-V characteristic curve of the diode in the conducting state.
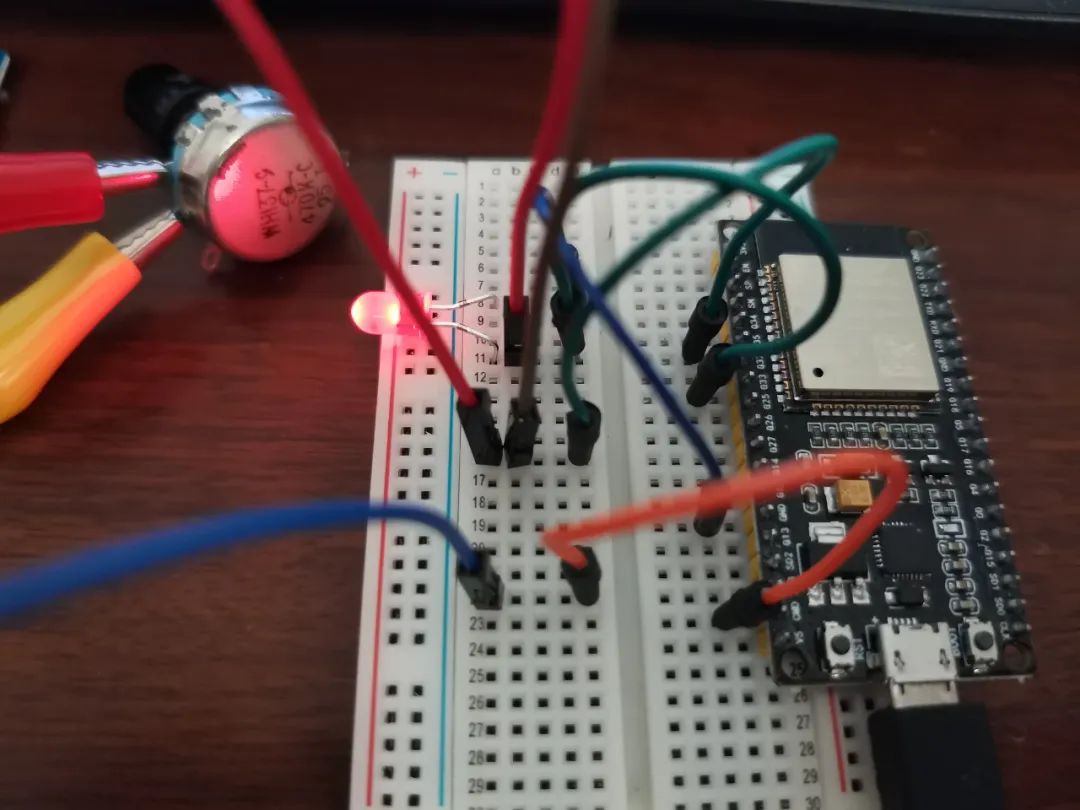
Set the programmable resistor board to 1000 ohms, connected in series with the diode as the internal resistance of the ammeter. Use pin IO33 to measure the positive potential of the diode, and pin IO35 to measure the positive potential of the programmable resistor board. Then, the measured and calculated voltage and current of the diode were sent via Bluetooth to Phyphox loaded on a smartphone, which automatically plotted the I-V characteristic curve of the diode in the conducting state.
Program Code
/*
Plot the I-V characteristics of the diode.
*/
#include <phyphoxBle.h>
int Pin1 = 33;//Read diode voltage
int Pin2 = 35;//Read fixed resistor voltage for calculating diode current
float It = 0;//Current through the fixed resistor
float Vt = 0;//Voltage across the fixed resistor
float r = 1000.0;//Fixed resistor
void setup()
{
PhyphoxBLE::start(“Phyphox Bluetooth Experiment”);
PhyphoxBleExperiment plotPhotoResistor;
plotPhotoResistor.setTitle(“Plot the I-V Characteristics of the Diode”);
plotPhotoResistor.setCategory(“Phyphox Bluetooth Experiment”);
plotPhotoResistor.setDescription(“Zhang Huaihua, Jiaozuo No. 11 Middle School, plotted the I-V characteristic curve of the diode.”);
//View
PhyphoxBleExperiment::View firstView;
firstView.setLabel(“MyView”); //Create a “view”
//Graph
PhyphoxBleExperiment::Graph firstGraph;
firstGraph.setLabel(“Plot the I-V Characteristics of the Diode”);
firstGraph.setUnitX(“V”);
firstGraph.setUnitY(“A”);
firstGraph.setLabelX(“Voltage”);
firstGraph.setLabelY(“Current”);
firstGraph.setChannel(1, 2);//Enable the first and second Bluetooth channels
firstView.addElement(firstGraph);
plotPhotoResistor.addView(firstView);
PhyphoxBLE::addExperiment(plotPhotoResistor);
}
void loop()
{
float iVe = analogRead(Pin1) * 3.3 / 1024.0 / 4.0;//Read the positive potential of the diode
float iVr = analogRead(Pin2) * 3.3 / 1024.0 / 4.0;//Read the positive potential of the fixed resistor
if (iVe != 0.0) {
Vt = iVe ;//Calculate the voltage across the diode
It = (iVr – iVe) / r ;//Calculate the internal current of the diode
PhyphoxBLE::write(Vt,It);//Send voltage and current data via Bluetooth
};
delay(10);//Collect 100 sets of experimental data and voltage every second
PhyphoxBLE::poll();
}
Data Collection and Analysis
Run the program and slowly rotate the potentiometer; Phyphox automatically plotted the I-V characteristic curve of the diode in the conducting state.
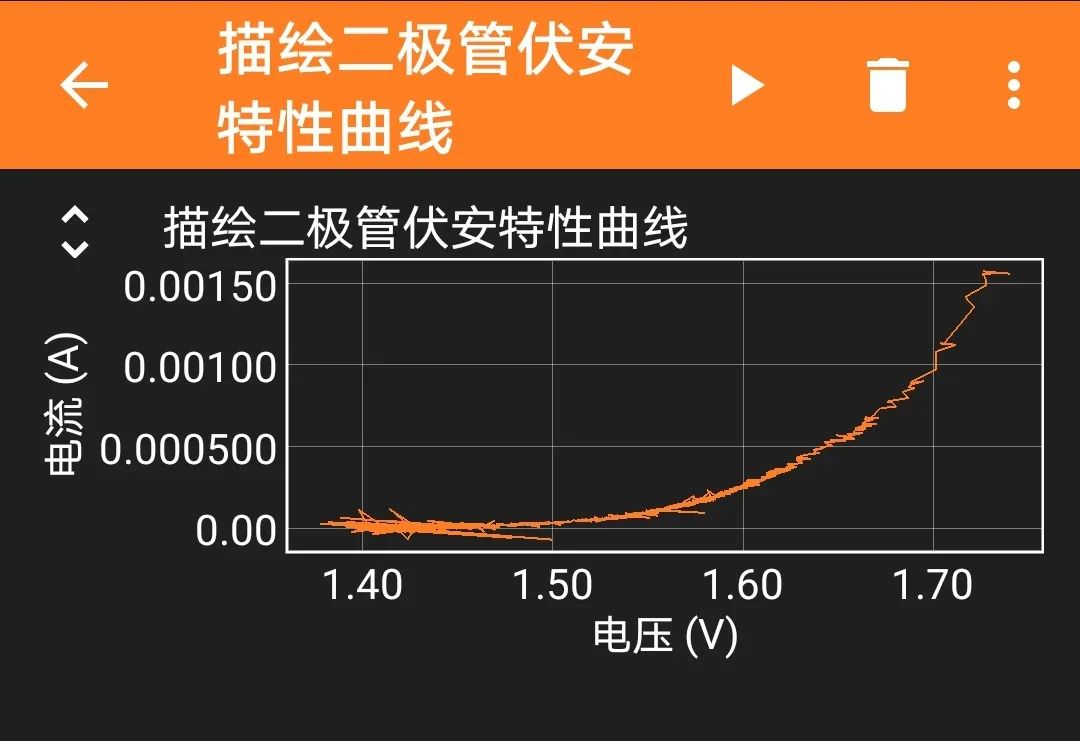
Diode I-V Characteristic Curve
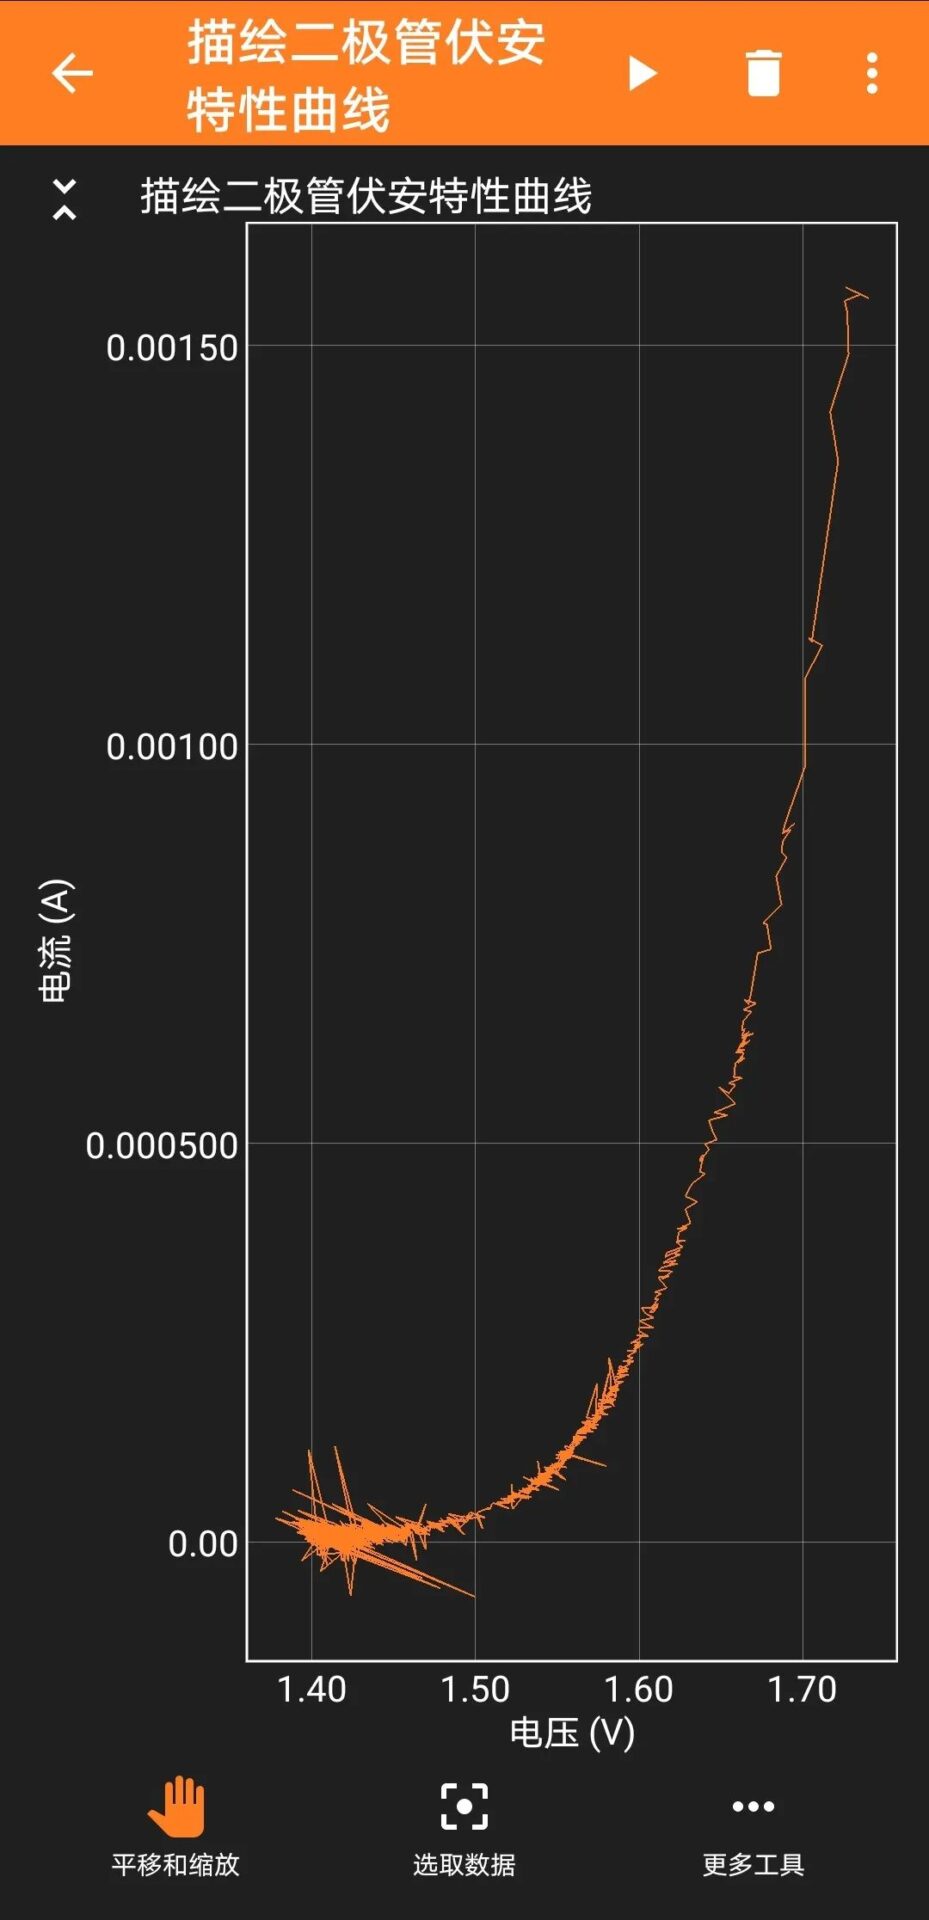
Full Screen
When the voltage is below 1.4 volts, the diode current and voltage signals disappear; in the conducting state of the diode, the internal resistance of the diode decreases as the current increases.
Note: There are many spikes at the lower left end of the diode I-V characteristic curve, which should be due to the measured current value being too small, entering the range of random error.
Don’t take it seriously, just a guess!
Experimental Conclusion
Observing the I-V characteristic curve of the diode in the conducting state reveals that there is a threshold voltage of 1.4 volts when the diode is forward-biased. When the voltage across the diode is less than the threshold voltage of 1.4 volts, the diode is in an open-circuit state, and the current inside the diode is almost zero, which the ESP32 cannot detect; when the voltage across the diode exceeds the threshold voltage of 1.4 volts, the diode conducts, and the diode current increases with the increase of the voltage across it, while the conducting resistance decreases as the current increases.
The experiment was a complete success.

| Maker Jiaozuo |
HenanMaker Jiaozuo is the WeChat public platform of the Jiaozuo Maker Education Master Studio, focusing on maker education, sharing maker cases, explaining innovative methods, inspiring creative design, conducting scientific inquiries, organizing social investigations, guiding thesis writing, participating in maker competitions and patent applications, discovering, cultivating, and achieving a group of students with innovative potential.
HenanPublic Number: chuangkejiaozuo
HenanMaster Blog: http://blog.sina.com.cn/updays

Long press to identify, follow, and share
– END –
