Editor’s Note Optical Coherence Tomography (OCT) is a rapidly developing ophthalmic examination technology in the past decade. It uses the principle of low-coherence light interferometry to scan and obtain two-dimensional or three-dimensional structural images of biological tissues, equivalent to a cross-sectional scan of the eye tissues.
What Does a Normal Macula Look Like in OCT Examination?
The fundus OCT primarily examines the structure of the macula and surrounding tissues. In the OCT examination, a normal macula resembles the image in Figure 1.
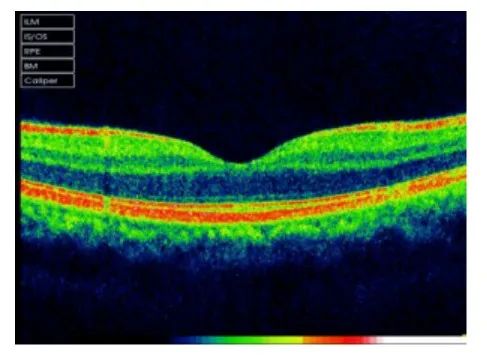
Figure 1: Normal Macula OCT Image
When there are issues with the macula, the results of the OCT examination will present different images. Today, we will discuss the common causes and images of macular edema.
➤ Common Causes of Macular Edema (ME):
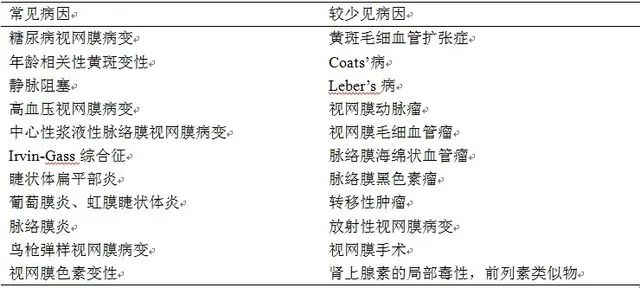
▲ Table 1: Common Causes of ME

Diabetic Macular Edema (DME) and Its Three Structural Changes in OCT Examination
1. Retinal Diffuse Thickening (DRT): Local or diffuse edema initially presents as reduced reflective signals between retinal layers, increased retinal thickness, and a spongy appearance of the retina (Figure 2).
2. Cystoid Macular Edema (CME): Fluid in the retina accumulates in a limited space, forming cystic structures in the outer plexiform layer, with high reflective intervals and low reflective cavities, resulting in a rose-like appearance in late fluorescein angiography. The arrangement of CME cavities mainly depends on the vertical Müller fibers (Figures 3 and 4).
3. Serous Retinal Detachment (SRD): Often caused by chronic edema, it appears as a dome-like high reflective detachment of the retina with subretinal fluid that appears black (Figure 5). SRD can be divided into two subtypes based on the presence or absence of retinal traction.
-
3A. Posterior Vitreous Traction (PHT) without Tractional Retinal Detachment (TRD).
-
3B. PHT with TRD: TRD appears as low reflective signal areas under the high reflective external surface of the detached retina, often presenting as peak-like protrusions (Figure 6).

▲ Table 2: Three Types of DME
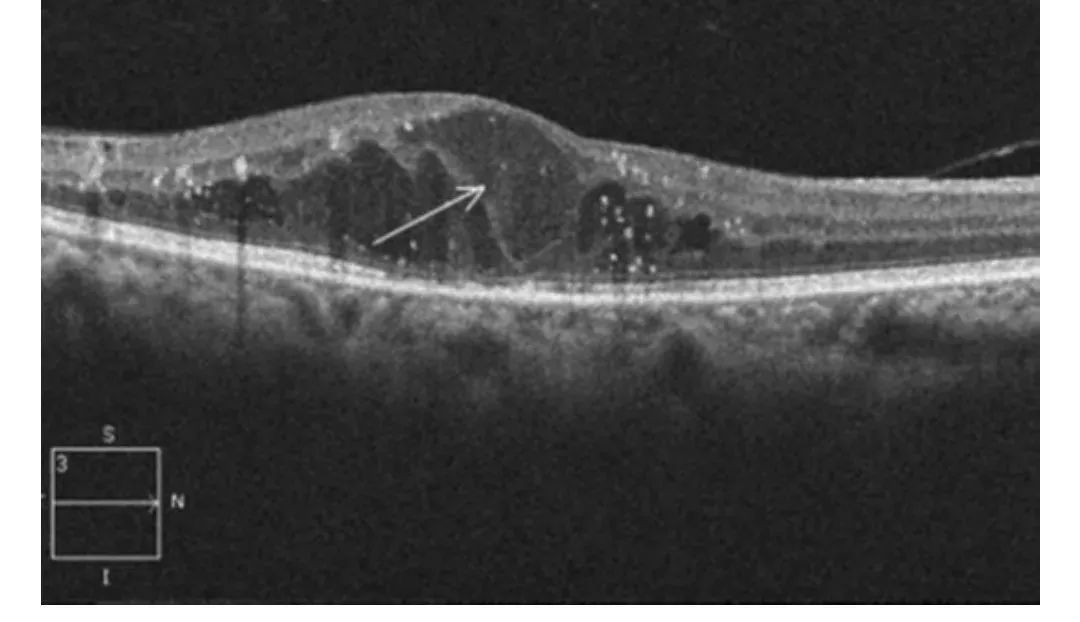
▲ Figure 2: OCT Manifestation of DRT in Diabetic Patients
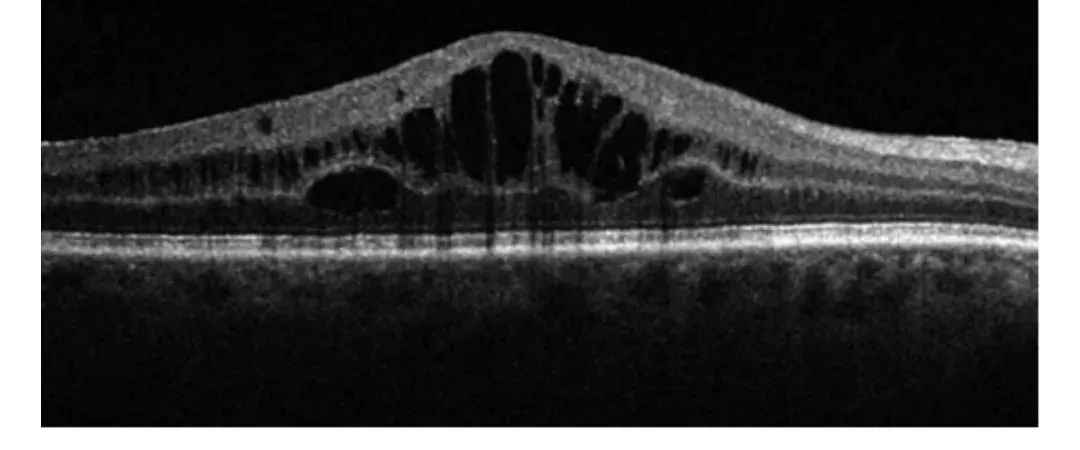
▲ Figure 3: OCT Manifestation of CME
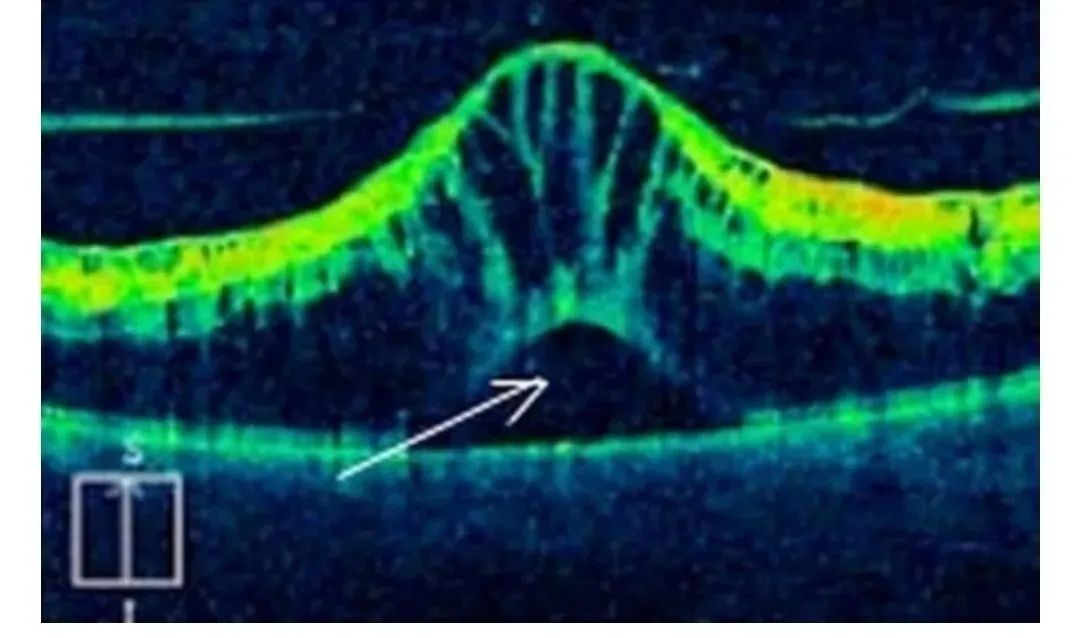
▲ Figure 4: OCT Manifestation of CME with Subretinal Fluid
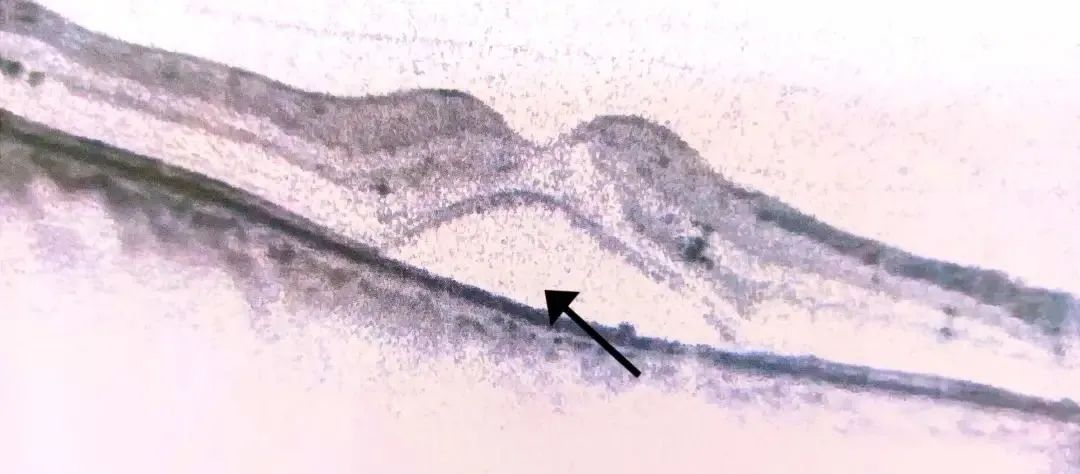
▲ Figure 5: Subretinal Fluid at the Fovea
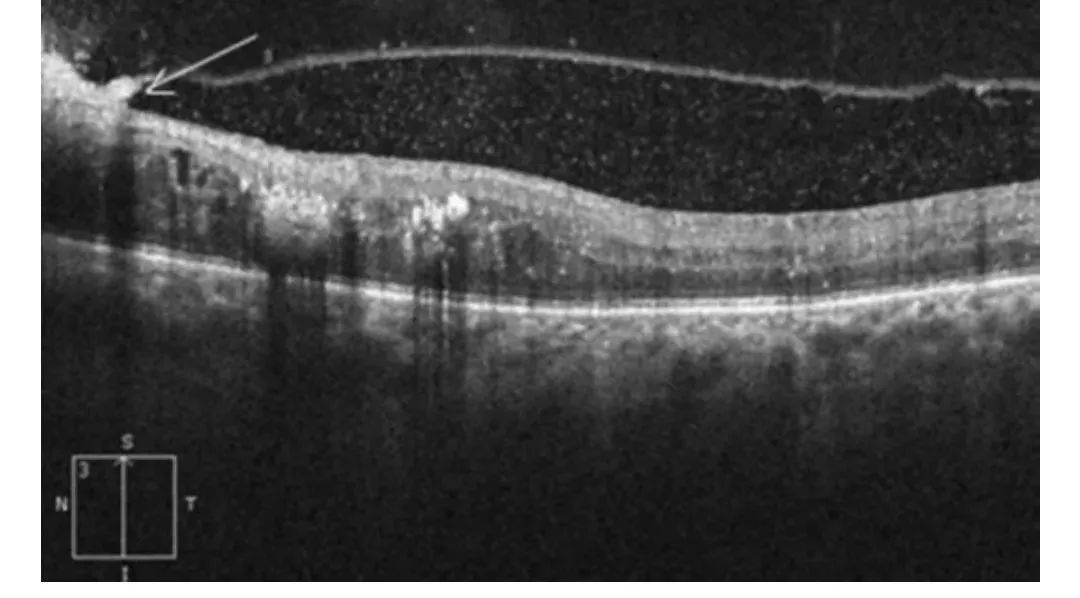
▲ Figure 6: OCT Image of Macular OCT in Diabetic Patients with PHT
➤ Different Reflective Signals of Normal Retinal Tissue in OCT:
1. The nerve fiber layer and the retinal pigment epithelium are highly reflective;
2. The plexiform layer and nuclear layer are moderately reflective;
3. Photoreceptor cells are low reflective.
➤ Normal Thickness of Retina:
1. The distance from the vitreoretinal interface to the anterior surface of the retinal pigment epithelium is approximately 200μm to 275μm;
2. The foveal depression is approximately 170μm to 190μm;
3. The peripheral retinal thickness is generally around 220μm to 280μm.
➤ DME Retinal Thickness:
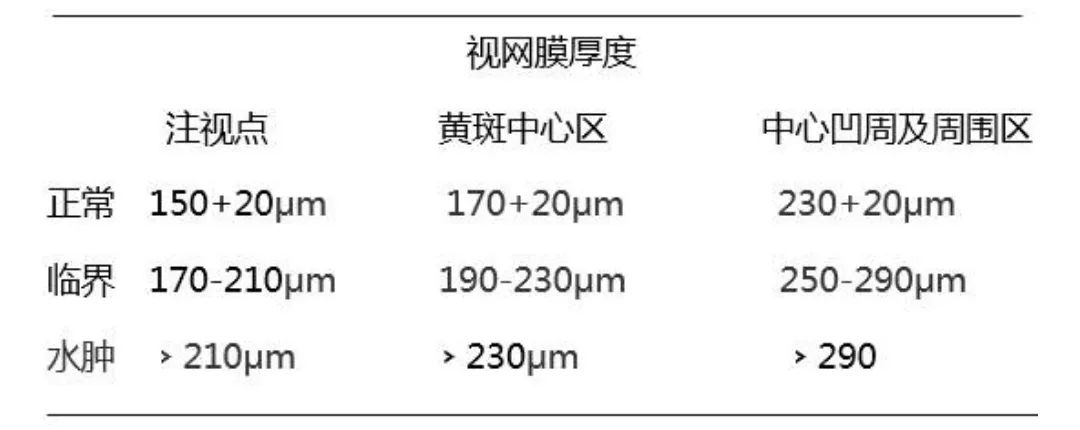
Research indicates that there is a correlation between retinal thickness and visual acuity in DME patients.
For every 100μm increase in retinal thickness, visual acuity (logMAR) decreases by 0.16. The worst OCT type for visual acuity is CME, where visual acuity decreases by 0.40, while other types decrease by 0.16.
OCT Image of Epiretinal Membrane (ERM)
Characterized by a non-vascular fibrous cell membrane on the inner surface of the retina (Figure 7), also known as glassy membrane retinal disease, often caused by idiopathic or secondary proliferative changes at the vitreoretinal interface.
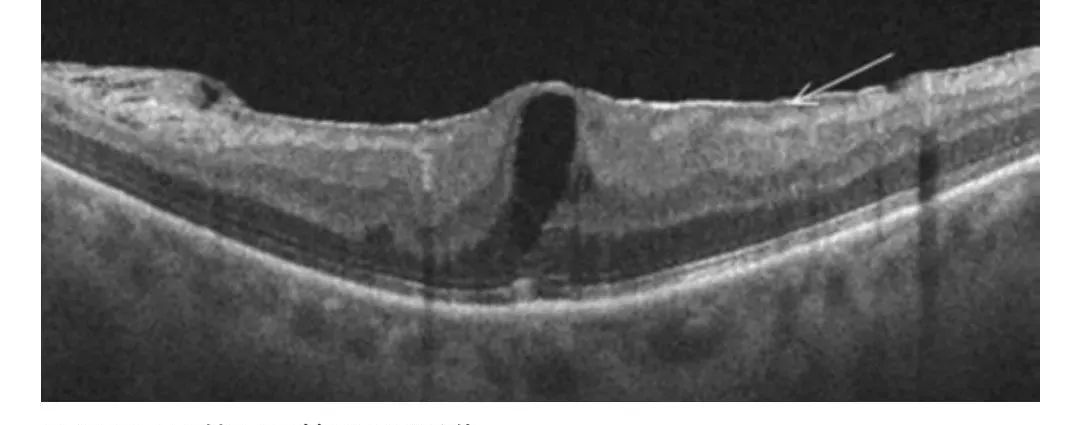
▲ Figure 7: OCT Image of ERM with ME
OCT Image of Vitreomacular Traction (VMT)
Characterized by partial incomplete physical gas-phase deposition and residual adhesion of the vitreous pulling on the retina in the macular area (Figure 8). The adhered vitreous cortex surrounds the macular area and the optic nerve, is relatively wide, and often appears dumbbell-shaped, which can lead to cystic thickening of the macula.
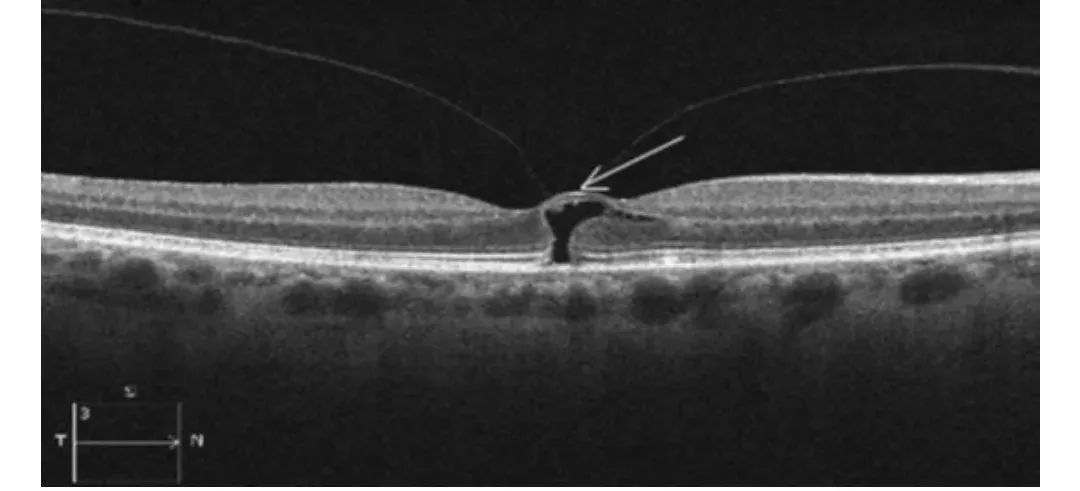
▲ Figure 8: OCT Showing VMT with Cyst Formation and Potential Macular Hole Formation in the Retina
OCT Image of Retinal Split
Retinal splits are more commonly seen in high myopia and posterior scleral staphyloma (Figure 9), which are difficult to diagnose with the naked eye, but OCT can assist in diagnosis.
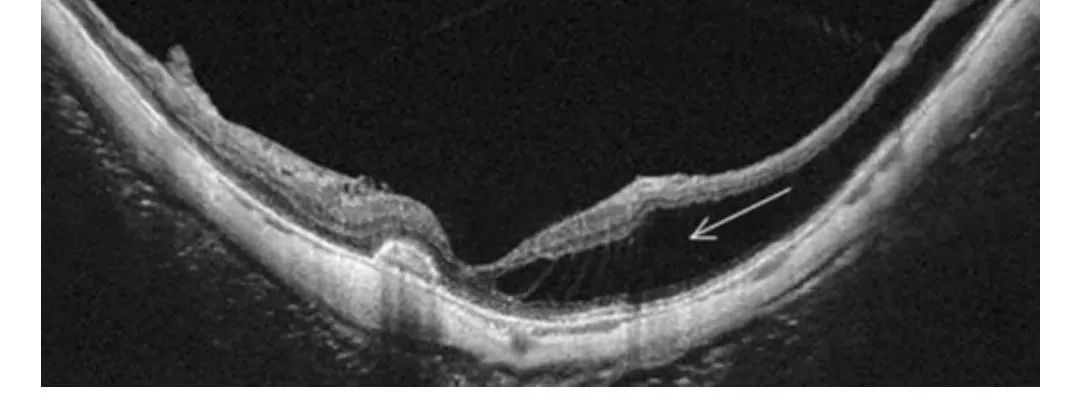
Figure 9: OCT Manifestation of Retinal Split
OCT Image of Foveal Defect and Macular Split
OCT helps to detect ME and splits caused by the foveal defect (Figure 10). In these cases, retinal interlayer fluid accumulation and split-like cyst formation can be observed.
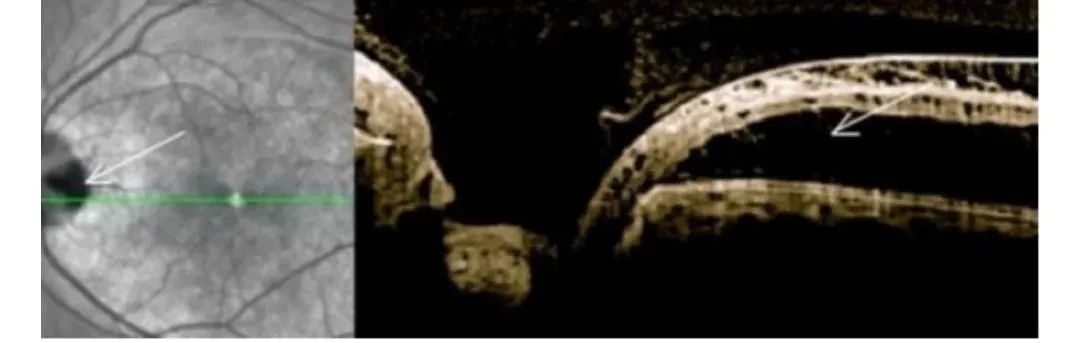
▲ Figure 10: OCT Manifestation of Foveal Defect with Retinal Interlayer Fluid Accumulation and Macular Split
OCT has become one of the effective means for us to detect, assess, and treat in clinical practice, achieving both qualitative and quantitative assessment of retinal thickness and correlating it with visual acuity.
In summary, this non-invasive imaging is crucial for accurately assessing macular edema and guiding treatment.
Source: Ophthalmologist Jiao Zhaocai

 ENDWelcome to submit articles to:[email protected] We will respond to every letterFor more conference information & academic news,please follow the “Medical Progress” WeChat official account