Packet loss refers to the situation where data packets are discarded during the transmission process due to various reasons before they reach the application program. The number of discarded packets divided by the total number of transmitted packets is what we commonly refer to as the packet loss rate. The packet loss rate is one of the core indicators of network performance.
Packet loss usually leads to a significant decrease in performance, especially for TCP, where packet loss often indicates network congestion and retransmission, which in turn can lead to increased network latency and reduced throughput.
Next, I will take the most commonly used reverse proxy server, Nginx, as an example to show you how to analyze the issue of network packet loss.
Case Preparation
Today’s case requires two virtual machines, based on Ubuntu 18.04, which is also applicable to other Linux systems. The environment I am using is as follows: Machine configuration: 2 CPUs, 8GB RAM. Pre-installed tools include docker, curl, hping3, etc., such as apt install docker.io curl hping3. Now, open two terminals, log into these two virtual machines, and install the aforementioned tools. All commands are assumed to be run as the root user.
Case Analysis
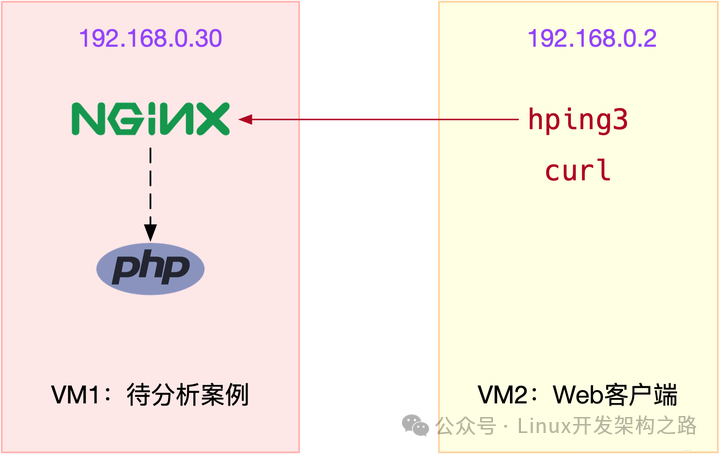
The case we are analyzing today is an Nginx application, as shown in the figure below, where hping3 and curl are the clients of Nginx.
To facilitate your operation, I have packaged it into a Docker image and pushed it to Docker Hub. You can run it directly by following the steps below.
In terminal one, execute the following command to start the Nginx application, listening on port 80. If everything is normal, you should see the following output:
$ docker run --name nginx --hostname nginx --privileged -p 80:80 -itd feisky/nginx:dropdae0202cc27e5082b282a6aeeb1398fcec423c642e63322da2a97b9ebd7538e0Then, execute the docker ps command to check the status of the container, and you will find that the container is already running (Up):
$ docker psCONTAINER ID IMAGE COMMAND CREATED STATUS PORTS NAMESdae0202cc27e feisky/nginx:drop "/start.sh" 4 minutes ago Up 4 minutes 0.0.0.0:80->80/tcp nginxHowever, from the output of docker ps, we can only know that the container is running, but we need further confirmation to see if Nginx can handle external requests properly.
Next, we switch to terminal two and execute the following hping3 command to further verify whether Nginx can be accessed normally. Note that I did not use ping here because ping is based on the ICMP protocol, while Nginx uses the TCP protocol.
# -c indicates sending 10 requests, -S indicates using TCP SYN, -p specifies port 80$ hping3 -c 10 -S -p 80 192.168.0.30HPING 192.168.0.30 (eth0 192.168.0.30): S set, 40 headers + 0 data byteslen=44 ip=192.168.0.30 ttl=63 DF id=0 sport=80 flags=SA seq=3 win=5120 rtt=7.5 mslen=44 ip=192.168.0.30 ttl=63 DF id=0 sport=80 flags=SA seq=4 win=5120 rtt=7.4 mslen=44 ip=192.168.0.30 ttl=63 DF id=0 sport=80 flags=SA seq=5 win=5120 rtt=3.3 mslen=44 ip=192.168.0.30 ttl=63 DF id=0 sport=80 flags=SA seq=7 win=5120 rtt=3.0 mslen=44 ip=192.168.0.30 ttl=63 DF id=0 sport=80 flags=SA seq=6 win=5120 rtt=3027.2 ms --- 192.168.0.30 hping statistic ---10 packets transmitted, 5 packets received, 50% packet lossround-trip min/avg/max = 3.0/609.7/3027.2 msFrom the output of hping3, we can see that 10 request packets were sent, but only 5 replies were received, resulting in a 50% packet loss. Observing the RTT of each request, we can also see significant fluctuations, with the smallest being only 3ms and the largest reaching 3s.
Based on this output, we can basically conclude that packet loss has occurred. It can be speculated that the 3s RTT is likely due to retransmissions caused by packet loss. So where exactly is the packet loss occurring?
Before troubleshooting, we can recall the network transmission process in Linux and theoretically analyze where packet loss might occur. It might be helpful to take out a pen and paper to jot down your thoughts as you recall and clarify before continuing with the content below.
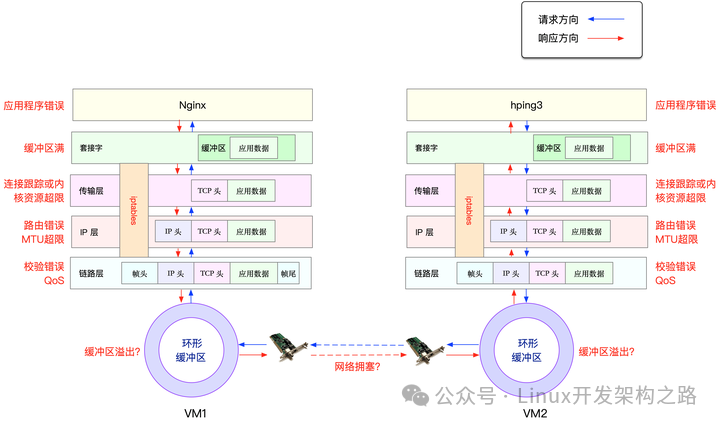
From the figure, you can see that potential packet loss locations actually span the entire network protocol stack. In other words, there is a possibility of packet loss at every stage. For example, looking from bottom to top:
Between the two VMs, transmission failures may occur due to errors such as network congestion or line faults;
After the network card receives the packets, the ring buffer may drop packets due to overflow;
At the link layer, packet loss may occur due to network frame checksum failures, QoS, etc.;
At the IP layer, packet loss may occur due to routing failures or packet size exceeding MTU;
At the transport layer, packet loss may occur due to ports not being listened to or resource usage exceeding kernel limits;
At the socket layer, packet loss may occur due to socket buffer overflow;
At the application layer, packet loss may occur due to application exceptions;
Additionally, if iptables rules are configured, these network packets may also be dropped due to iptables filtering rules.
Of course, these issues may also occur simultaneously on both communicating machines. However, since we have not made any modifications to VM2, and VM2 is only running the simplest hping3 command, we can assume that it is not the problem.
To simplify the troubleshooting process, we can further assume that VM1’s network and kernel configurations are also fine. This way, the potential problem locations would all be within the container.
Now we switch back to terminal one and execute the following command to enter the container’s terminal:
$ docker exec -it nginx bash root@nginx:/#Here, I would like to briefly explain that all subsequent analyses with the prefix root@nginx:/# indicate operations performed within the container.
Note: In a real environment, issues may occur both inside and outside the container. But don’t worry, the analysis steps and thought processes for both internal and external are the same, just requiring more time.
Next, we can start troubleshooting the packet loss issue layer by layer from the protocol stack.
Link Layer
First, let’s look at the link layer. When packet loss occurs due to reasons such as buffer overflow, Linux records the number of transmission errors in the network card’s statistics.
You can check the packet loss records of the network card using ethtool or netstat. For example, you can execute the following command in the container to check the packet loss situation:
root@nginx:/# netstat -iKernel Interface tableIface MTU RX-OK RX-ERR RX-DRP RX-OVR TX-OK TX-ERR TX-DRP TX-OVR Flgeth0 100 31 0 0 0 8 0 0 0 BMRUlo 65536 0 0 0 0 0 0 0 0 LRUThe output shows RX-OK, RX-ERR, RX-DRP, and RX-OVR, which represent the total number of received packets, total error count, number of packets dropped after entering the Ring Buffer due to other reasons (such as insufficient memory), and number of packets dropped due to Ring Buffer overflow, respectively.
TX-OK, TX-ERR, TX-DRP, and TX-OVR represent similar meanings, but refer to the corresponding metrics during transmission.
Note: Due to the virtual network card of Docker containers, which is actually a pair of veth pairs, one end connects to the container as eth0, and the other end connects to the docker0 bridge on the host. The veth driver does not implement network statistics functionality, so using
ethtool -Swill not yield summary information on the network card’s transmission data.
From this output, we did not find any errors, indicating that the container’s virtual network card has not dropped any packets. However, it is important to note that if QoS is configured using tools like tc, packet loss caused by tc rules will not be included in the network card’s statistics.
Next, we need to check if tc rules are configured on eth0 and see if there is any packet loss. We continue in the container terminal and execute the following tc command, but this time remember to add the -s option to output statistical information:
root@nginx:/# tc -s qdisc show dev eth0qdisc netem 800d: root refcnt 2 limit 1000 loss 30% Sent 432 bytes 8 pkt (dropped 4, overlimits 0 requeues 0) backlog 0b 0p requeues 0From the output of tc, we can see that a network emulation queuing rule (qdisc netem) is configured on eth0, with a packet loss rate of 30% (loss 30%). Looking at the subsequent statistical information, 8 packets were sent, but 4 were dropped.
It seems that this is the cause of the Nginx response packets being dropped by the netem module.
Since we have identified the problem, the solution is straightforward: simply delete the netem module. We can continue in the container terminal and execute the following command to delete the netem module from tc:
root@nginx:/# tc qdisc del dev eth0 root netem loss 30%After deletion, has the problem been resolved? We switch to terminal two and re-execute the previous hping3 command to see if there are still issues:
$ hping3 -c 10 -S -p 80 192.168.0.30HPING 192.168.0.30 (eth0 192.168.0.30): S set, 40 headers + 0 data byteslen=44 ip=192.168.0.30 ttl=63 DF id=0 sport=80 flags=SA seq=0 win=5120 rtt=7.9 mslen=44 ip=192.168.0.30 ttl=63 DF id=0 sport=80 flags=SA seq=2 win=5120 rtt=1003.8 mslen=44 ip=192.168.0.30 ttl=63 DF id=0 sport=80 flags=SA seq=5 win=5120 rtt=7.6 mslen=44 ip=192.168.0.30 ttl=63 DF id=0 sport=80 flags=SA seq=6 win=5120 rtt=7.4 mslen=44 ip=192.168.0.30 ttl=63 DF id=0 sport=80 flags=SA seq=9 win=5120 rtt=3.0 ms --- 192.168.0.30 hping statistic ---10 packets transmitted, 5 packets received, 50% packet lossround-trip min/avg/max = 3.0/205.9/1003.8 msUnfortunately, from the output of hping3, we can see that, similar to the previous phenomenon, there is still a 50% packet loss; the fluctuations in RTT are still significant, ranging from 3ms to 1s.
Clearly, the problem has not been resolved, and packet loss continues to occur. However, since we have completed the link layer troubleshooting, we will continue to analyze the network layer and transport layer to see if there are any issues.
Network Layer and Transport Layer
We know that there are many factors that can cause packet loss at the network layer and transport layer. However, it is actually very simple to confirm whether packet loss has occurred, as Linux has already provided us with the summary of received and transmitted packets for each protocol.
We continue in the container terminal and execute the following netstat -s command to see the summary of protocol transmission and reception, as well as error information:
root@nginx:/# netstat -sIp: Forwarding: 1 // Forwarding enabled 31 total packets received // Total received packets 0 forwarded // Forwarded packets 0 incoming packets discarded // Received discarded packets 25 incoming packets delivered // Received data packets 15 requests sent out // Sent packetsIcmp: 0 ICMP messages received // Received ICMP packets 0 input ICMP message failed // Failed ICMP messages received ICMP input histogram: 0 ICMP messages sent // ICMP sent packets 0 ICMP messages failed // Failed ICMP messages sent ICMP output histogram:Tcp: 0 active connection openings // Active connections opened 0 passive connection openings // Passive connections opened 11 failed connection attempts // Failed connection attempts 0 connection resets received // Connection resets received 0 connections established // Established connections 25 segments received // Received segments 21 segments sent out // Sent segments 4 segments retransmitted // Retransmitted segments 0 bad segments received // Bad segments received 0 resets sent // Connection resets sentUdp: 0 packets received ...TcpExt: 11 resets received for embryonic SYN_RECV sockets // Half connection resets 0 packet headers predicted TCPTimeouts: 7 // Timeout count TCPSynRetrans: 4 // SYN retransmission count ...The netstat command summarizes the transmission statistics for various protocols such as IP, ICMP, TCP, and UDP. However, since our goal is to troubleshoot packet loss, we mainly observe the error counts, packet loss counts, and retransmission counts here.
From the output above, you can see that only the TCP protocol has experienced packet loss and retransmission, specifically:
11 failed connection attempts (11 failed connection attempts)
4 retransmissions (4 segments retransmitted)
11 half connection resets (11 resets received for embryonic SYN_RECV sockets)
4 SYN retransmissions (TCPSynRetrans)
7 timeouts (TCPTimeouts)
This result indicates that the TCP protocol has experienced multiple timeouts and failed retries, with the main error being half connection resets. In other words, the primary failure is due to the failure of the three-way handshake.
However, although we see many failures here, the specific root cause of the failures is still undetermined. Therefore, we need to continue analyzing along the protocol stack. What other potential issues could lead to packet loss besides the link layer, network layer, and transport layer? You might want to think about this yourself.
For those who need a C++ learning path, major company interview questions, and video learning materials, you can scan the QR code below to receive them.

iptables
First, we need to know that besides various protocols at the network layer and transport layer, iptables and the kernel’s connection tracking mechanism may also lead to packet loss. Therefore, this is also a factor we must investigate when encountering packet loss issues.
Let’s first look at connection tracking. I have already discussed the optimization ideas for connection tracking in the article on how to optimize NAT performance. To confirm whether connection tracking is causing the issue, we only need to compare the current connection tracking count with the maximum connection tracking count.
However, since connection tracking in the Linux kernel is global (not belonging to the network namespace), we need to exit the container terminal and return to the host to check.
You can execute exit in the container terminal; then execute the following command to check the connection tracking count:
# Execute exit in the container terminalroot@nginx:/# exitexit # Check kernel configuration in the host terminal$ sysctl net.netfilter.nf_conntrack_maxnet.netfilter.nf_conntrack_max = 262144$ sysctl net.netfilter.nf_conntrack_countnet.netfilter.nf_conntrack_count = 182From here, you can see that the connection tracking count is only 182, while the maximum connection tracking count is 262144. Clearly, the packet loss here cannot be caused by connection tracking.
Next, let’s look at iptables. Reviewing the principles of iptables, it is based on the Netfilter framework, which filters (like a firewall) and modifies (like NAT) network packets through a series of rules.
These iptables rules are uniformly managed in a series of tables, including filter (for filtering), nat (for NAT), mangle (for modifying packet data), and raw (for raw packets), etc. Each table can include a series of chains for grouping and managing iptables rules.
For packet loss issues, the most likely cause is that packets are being dropped by rules in the filter table. To clarify this, we need to confirm whether those rules targeting DROP and REJECT that would drop packets have been executed.
You can list all iptables rules and match them against the characteristics of the packets being sent and received. However, clearly, if there are many iptables rules, this approach would be inefficient.
Of course, a simpler method is to directly query the statistical information of DROP and REJECT rules to see if they are 0. If the statistical values are not 0, then we can extract the relevant rules for analysis.
We can use the iptables -nvL command to view the statistical information of each rule. For example, you can execute the following docker exec command to enter the container terminal; then execute the following iptables command to see the statistical data of the filter table:
# Execute in the host$ docker exec -it nginx bash # Execute in the containerroot@nginx:/# iptables -t filter -nvLChain INPUT (policy ACCEPT 25 packets, 1000 bytes) pkts bytes target prot opt in out source destination 6 240 DROP all -- * * 0.0.0.0/0 0.0.0.0/0 statistic mode random probability 0.29999999981 Chain FORWARD (policy ACCEPT 0 packets, 0 bytes) pkts bytes target prot opt in out source destination Chain OUTPUT (policy ACCEPT 15 packets, 660 bytes) pkts bytes target prot opt in out source destination 6 264 DROP all -- * * 0.0.0.0/0 0.0.0.0/0 statistic mode random probability 0.29999999981From the output of iptables, you can see that the statistical values of the two DROP rules are not 0, which are in the INPUT and OUTPUT chains. These two rules are actually the same, indicating that they use the statistic module to perform random 30% packet loss.
Looking at their matching rules, 0.0.0.0/0 indicates matching all source and destination IPs, meaning that all packets will experience random 30% packet loss. It seems that this should be the “culprit” causing some packet loss.
Since we have identified the cause, the subsequent optimization is relatively simple. For example, we can directly delete these two rules. We can execute the following two iptables commands in the container terminal to delete these two DROP rules:
root@nginx:/# iptables -t filter -D INPUT -m statistic --mode random --probability 0.30 -j DROProot@nginx:/# iptables -t filter -D OUTPUT -m statistic --mode random --probability 0.30 -j DROPAfter deletion, has the problem been resolved? We can switch to terminal two and re-execute the previous hping3 command to see if it is normal now:
$ hping3 -c 10 -S -p 80 192.168.0.30HPING 192.168.0.30 (eth0 192.168.0.30): S set, 40 headers + 0 data byteslen=44 ip=192.168.0.30 ttl=63 DF id=0 sport=80 flags=SA seq=0 win=5120 rtt=11.9 mslen=44 ip=192.168.0.30 ttl=63 DF id=0 sport=80 flags=SA seq=1 win=5120 rtt=7.8 ms...len=44 ip=192.168.0.30 ttl=63 DF id=0 sport=80 flags=SA seq=9 win=5120 rtt=15.0 ms --- 192.168.0.30 hping statistic ---10 packets transmitted, 10 packets received, 0% packet lossround-trip min/avg/max = 3.3/7.9/15.0 msThis time, you can see that there is no packet loss, and the latency fluctuations are also very small. It seems that the packet loss issue has been resolved.
However, up to this point, the hping3 tool we have been using only verifies that the Nginx’s port 80 is in a normal listening state, but we have not yet accessed Nginx’s HTTP service. So, do not rush to conclude that this optimization is complete; we need to further confirm whether Nginx can respond to HTTP requests normally.
We continue in terminal two and execute the following curl command to check Nginx’s response to HTTP requests:
$ curl --max-time 3 http://192.168.0.30curl: (28) Operation timed out after 3000 milliseconds with 0 bytes receivedFrom the output of curl, you can see that this time the connection timed out. However, we just verified that the port was normal with hping3, but now we find that the HTTP connection has timed out. Did Nginx suddenly exit abnormally?
Let’s run hping3 again to confirm:
$ hping3 -c 3 -S -p 80 192.168.0.30HPING 192.168.0.30 (eth0 192.168.0.30): S set, 40 headers + 0 data byteslen=44 ip=192.168.0.30 ttl=63 DF id=0 sport=80 flags=SA seq=0 win=5120 rtt=7.8 mslen=44 ip=192.168.0.30 ttl=63 DF id=0 sport=80 flags=SA seq=1 win=5120 rtt=7.7 mslen=44 ip=192.168.0.30 ttl=63 DF id=0 sport=80 flags=SA seq=2 win=5120 rtt=3.6 ms --- 192.168.0.30 hping statistic ---3 packets transmitted, 3 packets received, 0% packet lossround-trip min/avg/max = 3.6/6.4/7.8 msStrangely, the result of hping3 shows that Nginx’s port 80 is indeed still in a normal state. What should we do? Don’t forget, we have a powerful tool—packet capture. It seems necessary to capture packets to investigate.
tcpdump
Next, we switch back to terminal one and execute the following tcpdump command to capture packets on port 80:
root@nginx:/# tcpdump -i eth0 -nn port 80tcpdump: verbose output suppressed, use -v or -vv for full protocol decodelistening on eth0, link-type EN10MB (Ethernet), capture size 262144 bytesThen, switch to terminal two and execute the previous curl command again:
$ curl --max-time 3 http://192.168.0.30/curl: (28) Operation timed out after 3000 milliseconds with 0 bytes receivedAfter the curl command finishes, switch back to terminal one to check the output of tcpdump:
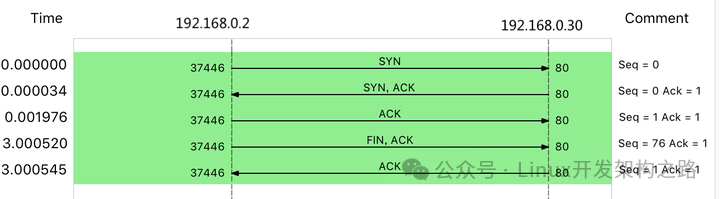
14:40:00.589235 IP 10.255.255.5.39058 > 172.17.0.2.80: Flags [S], seq 332257715, win 29200, options [mss 1418,sackOK,TS val 486800541 ecr 0,nop,wscale 7], length 014:40:00.589277 IP 172.17.0.2.80 > 10.255.255.5.39058: Flags [S.], seq 1630206251, ack 332257716, win 4880, options [mss 256,sackOK,TS val 2509376001 ecr 486800541,nop,wscale 7], length 014:40:00.589894 IP 10.255.255.5.39058 > 172.17.0.2.80: Flags [.], ack 1, win 229, options [nop,nop,TS val 486800541 ecr 2509376001], length 014:40:03.589352 IP 10.255.255.5.39058 > 172.17.0.2.80: Flags [F.], seq 76, ack 1, win 229, options [nop,nop,TS val 486803541 ecr 2509376001], length 014:40:03.589417 IP 172.17.0.2.80 > 10.255.255.5.39058: Flags [.], ack 1, win 40, options [nop,nop,TS val 2509379001 ecr 486800541,nop,nop,sack 1 {76:77}], length 0Through this series of operations, we can see from the output of tcpdump:
The first three packets are normal TCP three-way handshakes, which is fine;
However, the fourth packet comes after 3 seconds, and it is a FIN packet sent from the client (VM2), indicating that the client has closed the connection.
I believe that based on the 3-second timeout option set by curl, you can guess that this is because the curl command exited after timing out.
I have illustrated this process with a TCP interaction flowchart, so you can see this issue more clearly:
What is strange here is that we did not capture the HTTP GET request sent by curl. So, is it the network card that dropped the packets, or did the client not send them at all?
We can re-execute the netstat -i command to confirm whether there is a packet loss issue with the network card:
root@nginx:/# netstat -iKernel Interface tableIface MTU RX-OK RX-ERR RX-DRP RX-OVR TX-OK TX-ERR TX-DRP TX-OVR Flgeth0 100 157 0 344 0 94 0 0 0 BMRUlo 65536 0 0 0 0 0 0 0 0 LRUFrom the output of netstat, you can see that the number of received dropped packets (RX-DRP) is 344, confirming that packets were indeed dropped during reception at the network card. However, the question arises: why was there no packet loss when using hping3, but now with a GET request, it is not received?
As always, when encountering phenomena that are difficult to understand, it is advisable to check the principles of the tools and methods used. We can compare these two tools:
hping3 actually only sends SYN packets;
Whereas curl, after sending the SYN packet, also sends the HTTP GET request.
The HTTP GET is essentially a TCP packet, but compared to the SYN packet, it also carries the data of the HTTP GET request.
Therefore, from this comparison, you should realize that this may be caused by an MTU configuration error. Why?
In fact, if you closely observe the output of netstat, the second column is the MTU value for each network card. The MTU of eth0 is only 100, while the default MTU for Ethernet is 1500, making 100 too small.
Of course, the MTU issue is easy to resolve; we can change it to 1500. We continue in the container terminal and execute the following command to change the MTU of the container’s eth0 to 1500:
root@nginx:/# ifconfig eth0 mtu 1500After the modification, we switch to terminal two and execute the curl command again to confirm whether the issue has truly been resolved:
$ curl --max-time 3 http://192.168.0.30/<!DOCTYPE html><html>...<p><em>Thank you for using nginx.</em></p></body></html>It has been quite a journey, but this time we finally see the familiar Nginx response, indicating that the packet loss issue has been completely resolved.
Of course, before concluding the case, do not forget to stop today’s Nginx application. You can switch back to terminal one and execute the exit command to exit the container terminal:
root@nginx:/# exitexitFinally, execute the following docker command to stop and remove the Nginx container:
$ docker rm -f nginxSummary:
The seriousness of network packet loss issues is self-evident. When encountering packet loss issues, we should start from the Linux network transmission process and analyze layer by layer in conjunction with the principles of the TCP/IP protocol stack. Address: https://blog.csdn.net/MyySophia/article/details/122876642