As the application of SSDs in the market increases, the importance of SSDs as a core component of computer data storage is self-evident.
Due to the rising prices of NAND Flash in 2016 and the first half of 2017, the prices of SSDs have also surged. According to the China Flash Market quotation, from Q2 2016 to Q2 2017, the price increase for 120GB and 240GB SSDs reached 86% and 72.7%, respectively.
Price Trend of 120GB SSD from January 2017 to March 2018
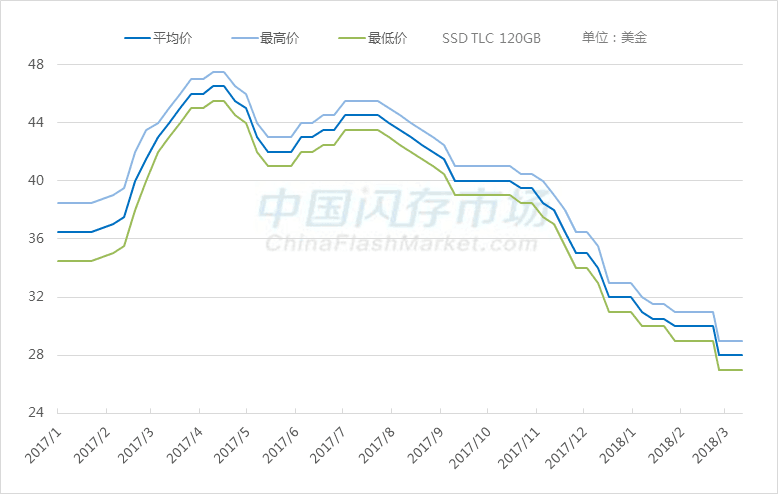
Source: China Flash Market www.chinaflashmarket.com
Price Trend of 240GB SSD from January 2017 to March 2018
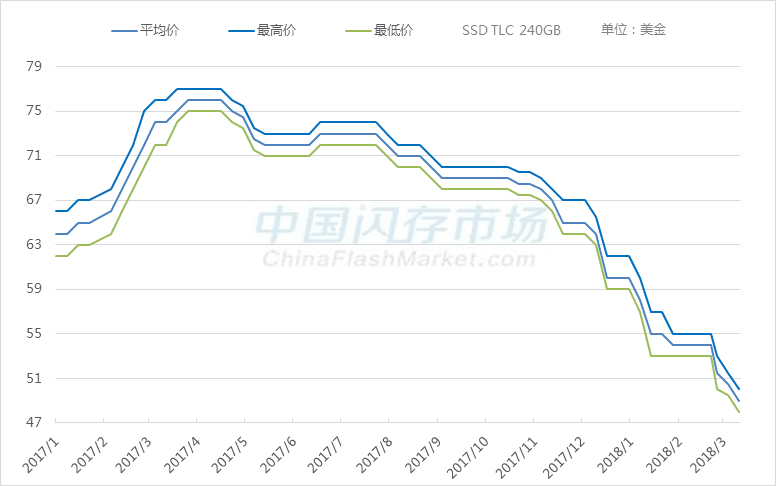
Source: China Flash Market www.chinaflashmarket.com
The continuous surge in SSD prices within a short period has led to an abnormal phenomenon in the SSD market, where the procurement price exceeds the selling price. This unhealthy market development has provided a breeding ground for cheap and low-quality SSDs. Because some merchants, in pursuit of maximum profit, have heavily adopted dismantled materials, recycled materials, Ink Die, and other NAND Flash chips to produce SSDs, selling them in the market for huge profits.
For individual consumers, it is impossible to judge the quality of low-quality SSDs from the surface of the casing, but there are significant quality issues regarding performance, lifespan, and stability, which may cause problems in future work and life, even resulting in economic losses.
For SSD brand manufacturers and market development, the impact of these cheap and low-quality SSDs not only affects the healthy growth of the SSD market but also puts great pressure on SSD brand manufacturers using original factory chips, further affecting the SSD prices, which dropped significantly by 30% in the second half of 2017. In early 2018, due to the weak demand in the off-season, SSD prices continued to decline.
However, this phenomenon of bad money driving out good will not last long in the SSD market, as manufacturers are actively shipping 3D NAND to customers, and it is expected that production will continue to expand in 2018, leading to the eventual elimination of low-quality SSDs that disrupt the market.
How to Distinguish the Quality of SSDs?
The quality of SSDs mainly depends on the quality of NAND Flash particles. The NAND Flash particles on the market are classified into four grades, with the quality as follows: original chips > self-branded chips > white chips > black chips/dismantled chips/refurbished chips.
Step 1: Preliminary Judgment from the Surface Logo of NAND Flash Particles:
NAND Flash particles are mainly supplied by major manufacturers such as Samsung, Toshiba/Western Digital, Micron, SK Hynix, and Intel. These original manufacturers print their logos on the tested and qualified NAND Flash particles or sell the Flash Wafer materials to OEM customers for self-packaging into their own brands. This type has the best quality NAND Flash particles.
Step 2: Further Analysis from NAND Flash Particle Information:
The surface of NAND Flash particles contains brand logos, coding models, production dates, etc. Further analysis can be conducted through NAND Flash coding rules and production dates.
Step 3: Accurate Judgment from Actual Testing Data of SSD:
The most effective method to determine the quality of SSDs is testing, such as read/write performance, data retention, high/low temperature aging, lifespan, power consumption, etc., which can reflect the true condition of the SSD.
The Following Details Analyze SSD Quality from NAND Flash Particle Information:
Flash Coding Information: K9CHGY8S5M-CCK0
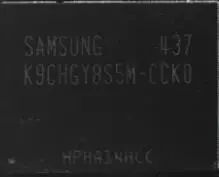
The logo on the NAND Flash particle is Samsung brand, but the NAND Flash is produced using 19nm TLC process technology, which Samsung started mass production three years ago. Furthermore, from the coding, it is identified that this chip particle was produced in the 37th week of 2014, indicating it may be a dismantled chip.
Flash Coding Information: SDTNRHAMA-016G
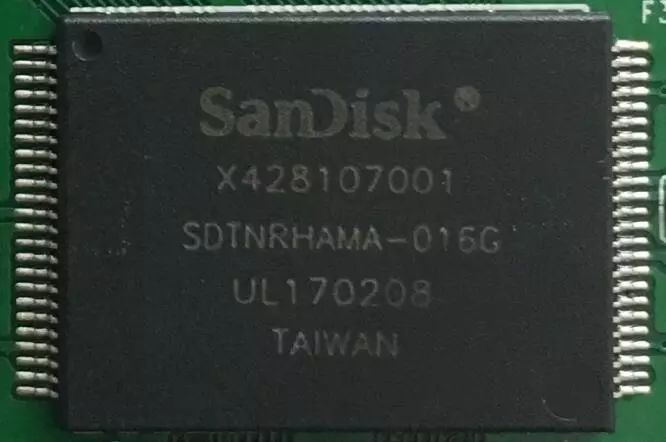
The NAND Flash particle uses SanDisk A19’s 1ynm MLC, which was mass-produced around 2013 or 2014 and has long been discontinued, indicating it may be a dismantled chip.
Flash Coding Information: Unclear Coding

The coding and original brand logo on the surface of the NAND Flash particle are unclear. The coding indicates it was produced in the 49th week of 2014, suggesting it may be a dismantled chip.
Flash Coding Information: H27QIT8QEM6R

Using a tool to query, the Flash ID number does not match the SK Hynix brand logo printed on the surface of the NAND Flash particle, indicating it may be a refurbished dismantled chip.