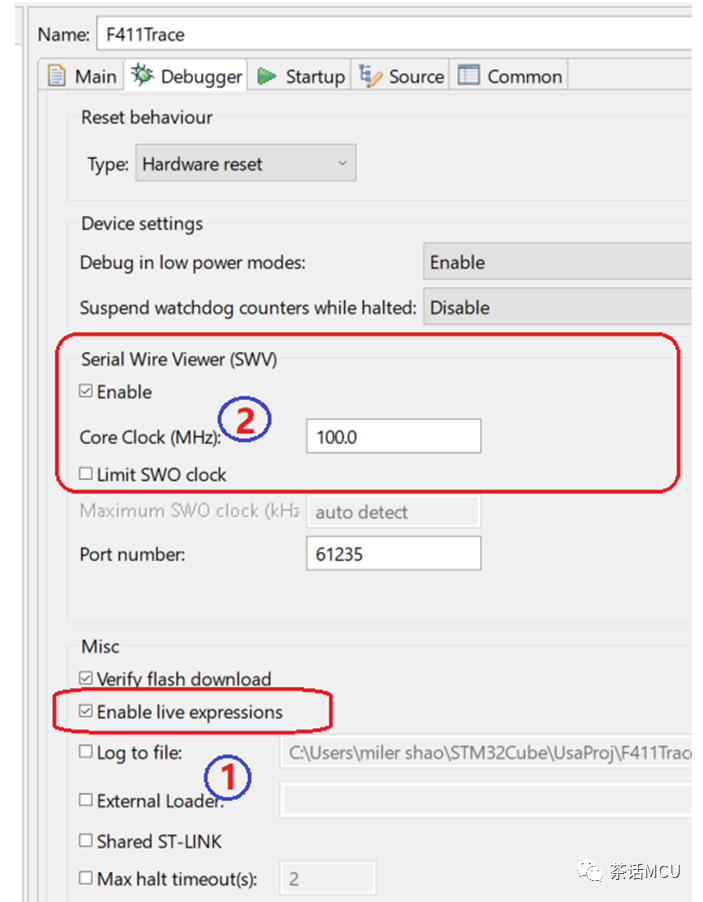
STMicroelectronics provides a powerful integrated debugging tool based on GCC, called STM32CubeIDE, for all STM32 users free of charge. This article briefly demonstrates several debugging tools and features supported by STM32CubeIDE. 1. Use Live Expression to display variable data in real-time;2. Use SWV‘s SWO feature to implement printf output;3. Use SWV to achieve real-time tracking and dynamic graphical display of data;4. Use the integrated serial terminal software of CubeIDE to implement printf output;To enable live expression, you must first enable this feature in the debugger configuration, as shown in the image below at position 1. To use the SWV feature, you also need to enable the related options in the debugger configuration, as shown in the image below at position 2.
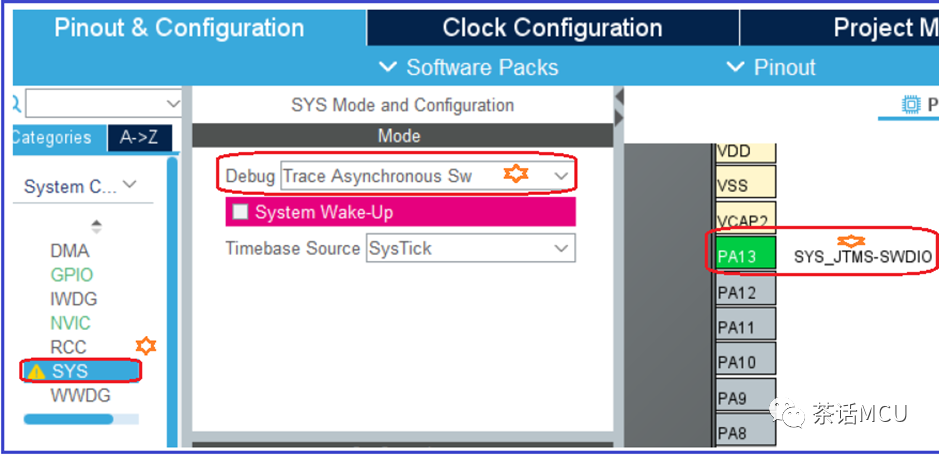
 To achieve SWO output, when configuring based on CubeMx, you need to perform the following operations:
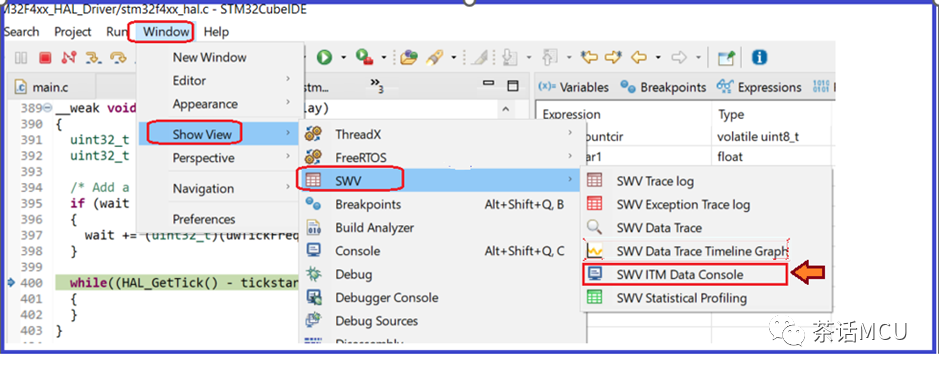
 Then, you need to add some code in the main file:#include“stdio.h”int __io_putchar(int ch){ITM_SendChar(ch);return(ch);}Additionally, add the following code in the user code area [for CubeIDE, the implementation may differ slightly for different IDEs]:/* USER CODE BEGIN 4 */int _write(int file, char *ptr, int len){int DataIdx;for (DataIdx = 0; DataIdx < len; DataIdx++){ __io_putchar( *ptr++);}return len;}/* USER CODE END 4 */[Note: The above function code may not need to be added in some versions, as this function already exists in the syscalls.c file. However, it is weakly defined, so rewriting it is also acceptable.]I defined a few global variables, and used Live Expression and SWO to print the output results.uint8_t countcir=0;float Var1=0.0;float Var2=0.0;To output results via SWO, you also need to enable related features in CubeIDE, as shown in the image below:
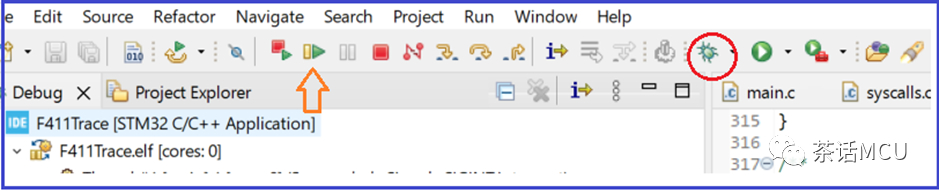
 After compiling, click the bug icon to enter debugging mode and run:
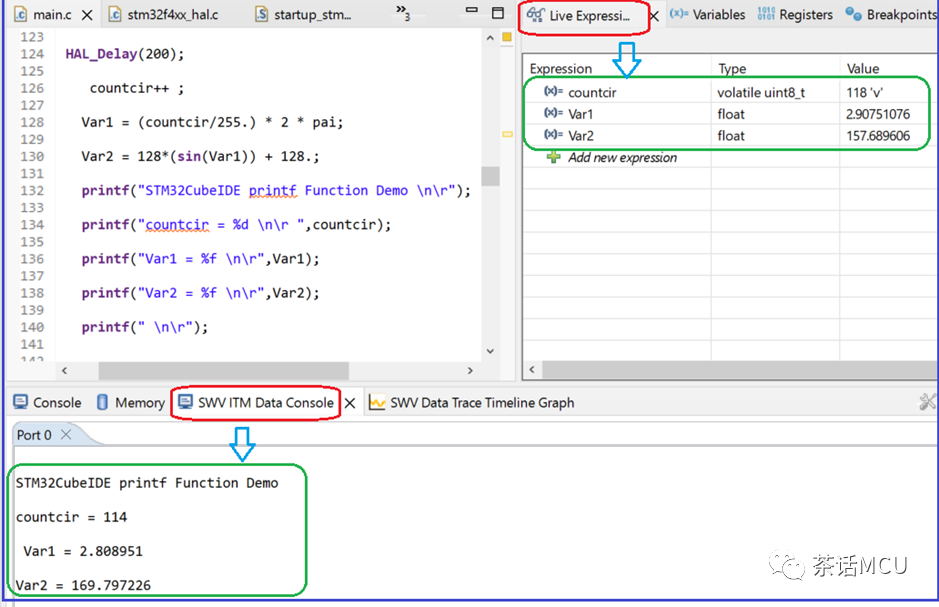
 We can see that the top right corner of the image shows the results of the live expression, and the lower part of the graph shows the printf output based on SWO.
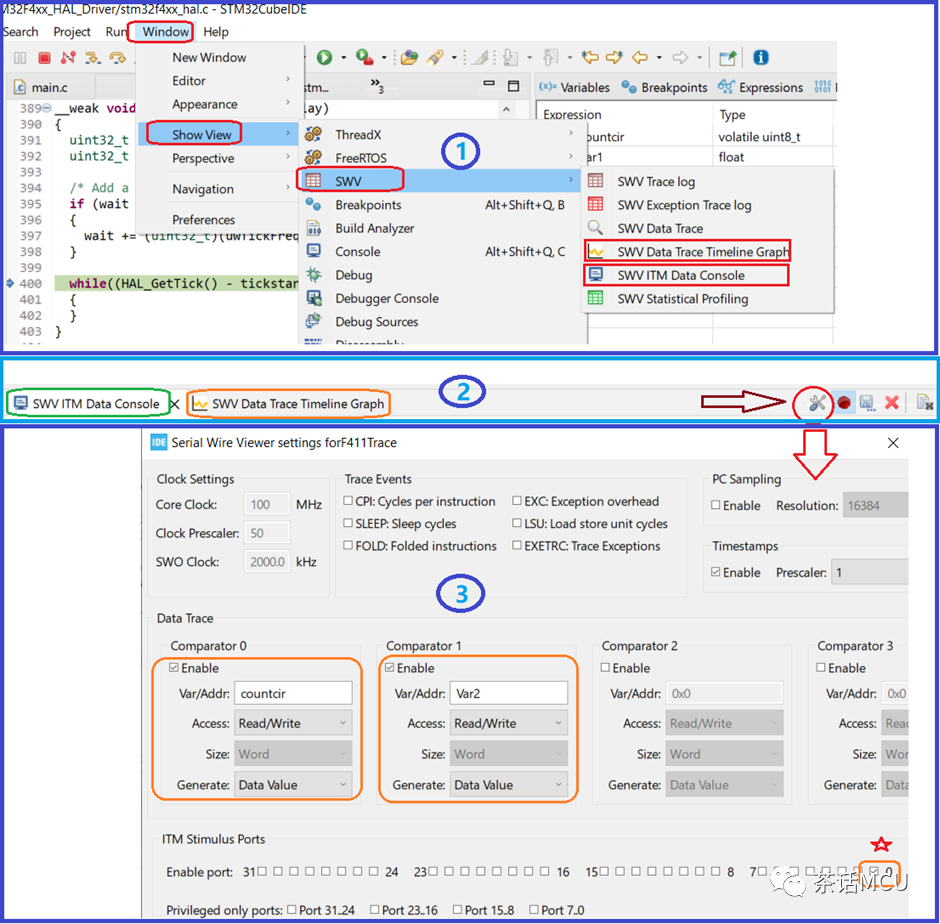
 If we want to use SWV to achieve real-time graphical display of variable data, we need to do some configuration.Open the related features under IDE environment window/SWV, and select the SWV Data Trace Timeline Graph option in part 1 of the image below. Then enter debugging mode, click the dragonfly icon in part 2 of the image below to enter the settings phase, which is part 3 of the image below.Here, I monitor the variables countcir and Var2 in real-time, making appropriate selections and entries, and enabling ITM port0. [Note the areas marked with asterisks in the image]
 After confirming the configuration, enter debugging mode and run again to see the results below:
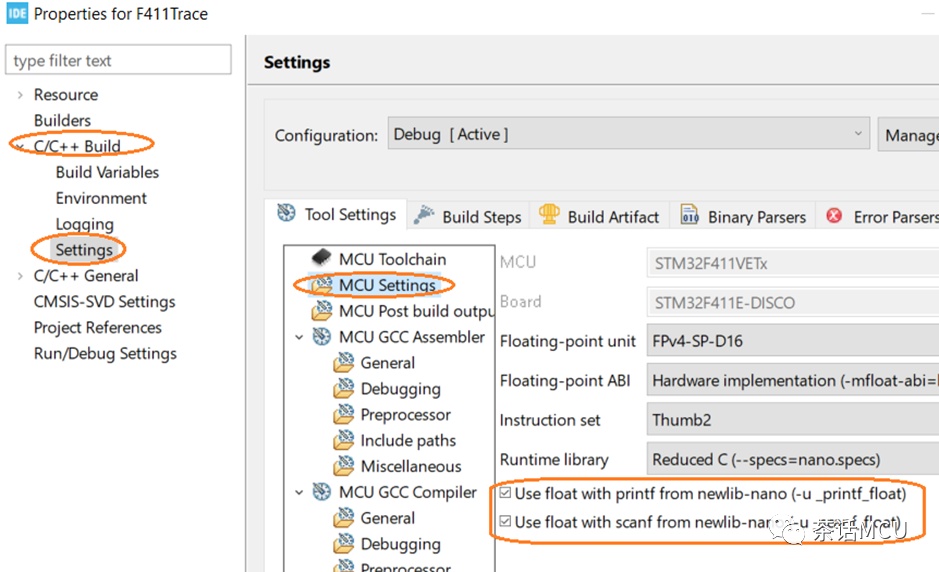
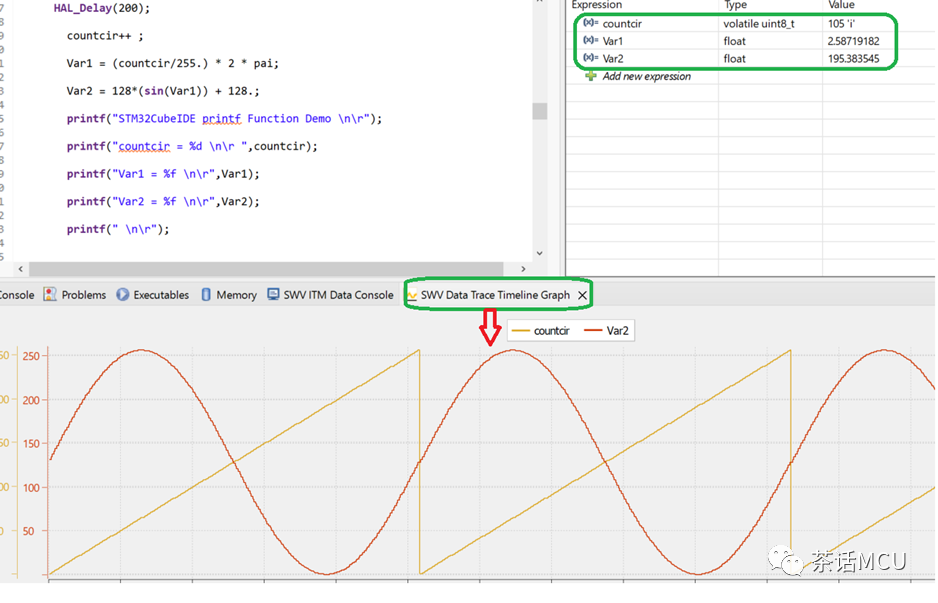 The lower half of the image shows the red sine wave representing Var2‘s real-time display, while the orange line represents countcir‘s real-time change.As a side note, I used floating-point numbers in the output above. To ensure printf runs correctly, we need to make some configurations in the project properties, as shown in the image below, just check the box.
 Next, I will briefly introduce using the integrated serial terminal software in STM32CubeIDE to perform UART based printing. Usually, when we perform printf based on UART, we often have to install a serial terminal software on the PC side. However, using CubeIDE allows us to skip this step, as it has integrated the relevant components.After completing the compilation and entering debugging mode, you can follow the steps shown in the image below for configuration..
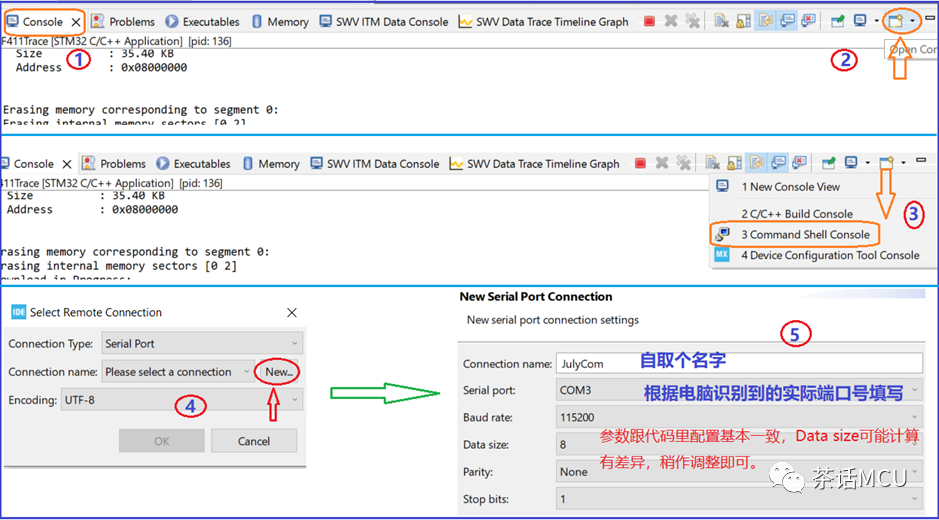 Of course, the corresponding redirection code still needs to be added manually, which is the same as using other IDEs.Taking CubeIDE as an example, add the following code before main():/* USER CODE BEGIN PM */#ifdef __GNUC__/* With GCC, small printf (option LD Linker->Libraries->Small printf set to ‘Yes’) calls __io_putchar() */#define PUTCHAR_PROTOTYPE int __io_putchar(int ch)#else#define PUTCHAR_PROTOTYPE intfputc(int ch, FILE *f)#endif/* __GNUC__ *//* USER CODE END PM */Then, add the following code in the user code area:/* USER CODE BEGIN 4 *//* @brief Retargets the C library printf function to the USART.*/PUTCHAR_PROTOTYPE{/* Place your implementation of fputc here */HAL_UART_Transmit(&huart1, (uint8_t *)&ch, 1, 0xFFFF);return ch;}/* USER CODE END 4 */This concludes the introduction to several debugging tools in the CubeIDE environment. Everyone can flexibly choose according to their preferences.Of course, STM32CubeIDE is feature-rich and powerful, and more features await your exploration.Finally, I would like to share a site with training video resources about STM32CubeIDE, located in the design resource area of www.stmcu.com.cn, as shown in the image below:
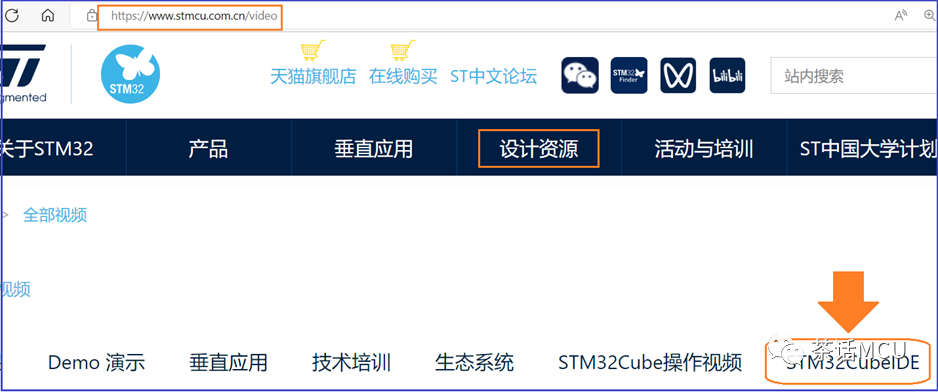 If you are interested, you can take a look. It is recommended to select ultra-clear quality for viewing, otherwise, some content may not be clear. If anyone does not know where to download the free STM32CubeIDE, click the “Read the original text” link below to get the information. It supports multiple OS versions, and you can choose the version you need, such as the Windows version.
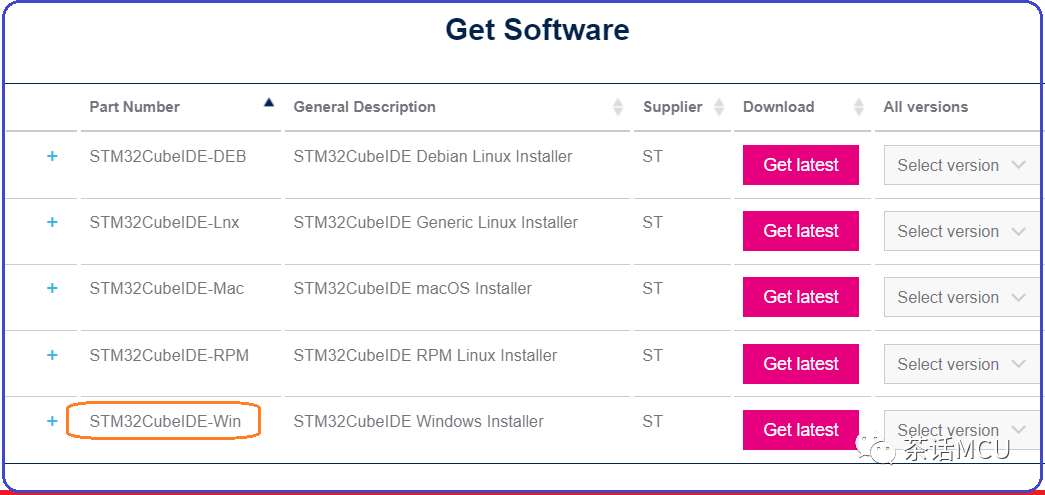
Alright, let’s stop here. I hope the above sharing can help you. Good luck!
Previous Recommendations:
Reusing Old Boards: Building a Wireless Debugging Environment!
Sharing Several Useful Code Snippets (with Code Examples)
Sharing Embedded Software Debugging Methods and Several Useful Tools!
Step-by-Step Guide to Using VSCode + gdb + gdbserver to Debug ARM Programs
Embedded Mixed Bag Weekly | Issue 9
Summary of 3 Debugging Methods for Embedded Segmentation Faults!
Writing Internationalized Embedded Code: How to Handle Time Issues?
Reply with 1024 in the public account chat interface to get embedded resources; reply with m to view the article summary.