
Ozone is a multi-platform debugging and analysis tool for J-link and J-Trace. It features an independent graphical interface that can load Elf/Dwarf executable files generated by toolchains such as IAR, Keil, Gcc, and Clang/LLVM for C/C++ source code debugging and assembly instruction debugging. You can directly use the built-in functionalities of J-Link and J-Trace, such as unlimited flash breakpoints, flash downloads, and instruction tracing. On the Cortex-M architecture, Ozone can help users quickly identify and analyze software errors that lead to CPU faults. This article will introduce how to use Ozone’s debugging features to gain deeper insights into these types of errors.
Fault Analysis Workflow
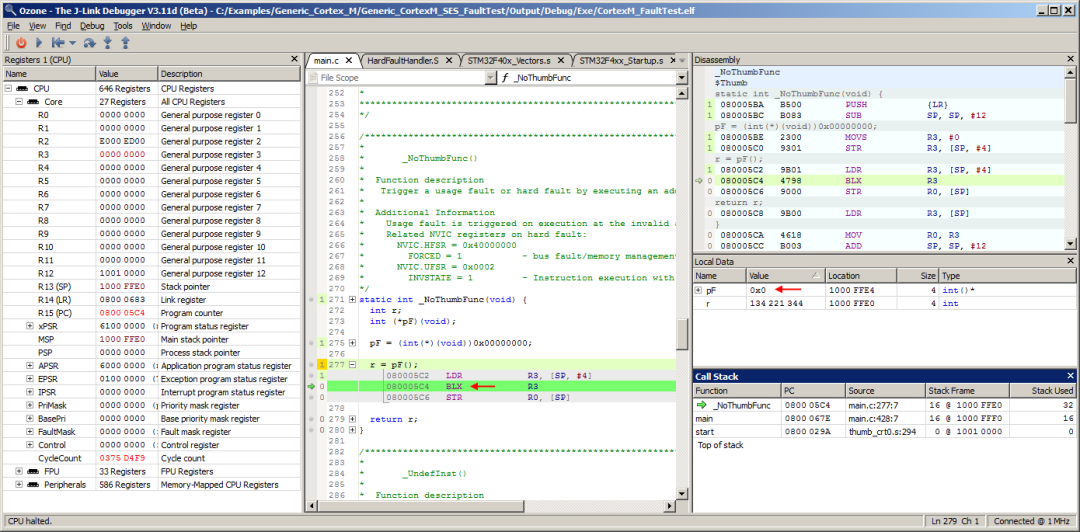
We first demonstrate the fault analysis workflow of Ozone based on an example. The sample application can generate different types of Cortex-M faults, and the example can be downloaded here (https://wiki.segger.com/File:CortexM_FaultTest.zip). In the figure below, the sample application has been downloaded to the SEGGER Cortex-M Trace development board. The emulator used is J-Trace PRO V2. The program has run to _NoThumbFunc(), and the current PC is at the branch address 0. Since address 0 contains a Thumb instruction, resuming program execution will lead to a Cortex-M CPU fault. We continue executing the program to see how Ozone handles the fault.
1. Target Exception Window
After clicking GO in the menu bar, the program execution is immediately interrupted, and Ozone’s target exception dialog box pops up:
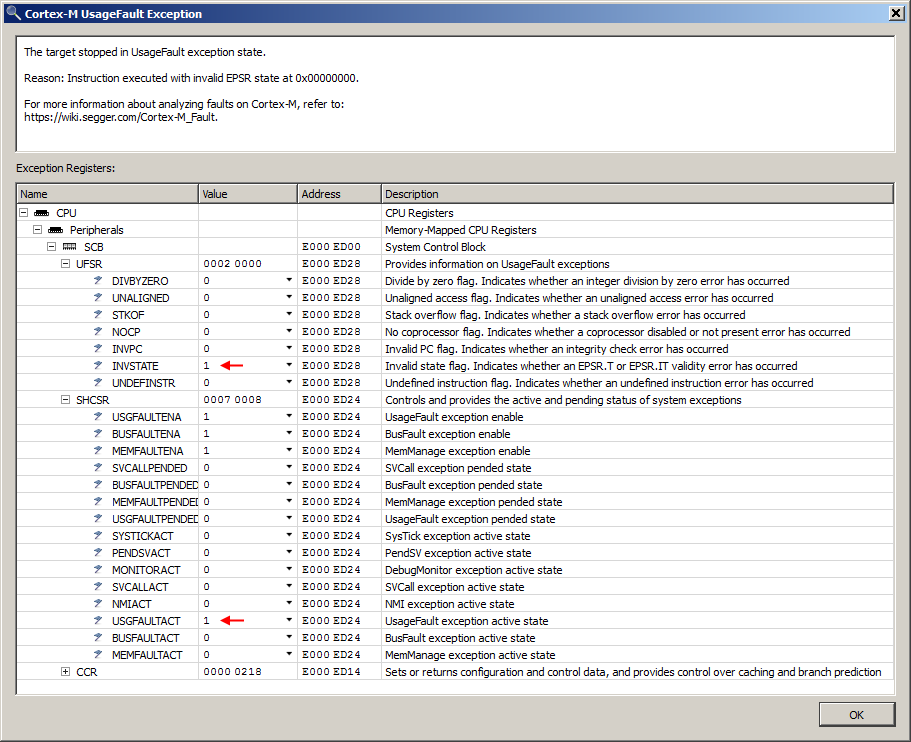
The target exception window displays the CPU fault description and the contents of its system registers. In this example, the SHCSR register USGFAULTACT indicates that a Cortex-M UsageFault exception has occurred. The UFSR register provides information about the occurred UsageFault exception; INVSTATE is set, indicating that an instruction was executed in an invalid CPU state. USGFAULTENA indicates that the UsageFault handler is enabled; if this bit is not set, the exception will escalate to HardFault. The explanation of the exception register context is architecture-specific. Therefore, Ozone displays as much processed information as possible in the exception description. The target exception window will be displayed whenever the program execution is paused and the target is in an exception state.
2. Vector Capture
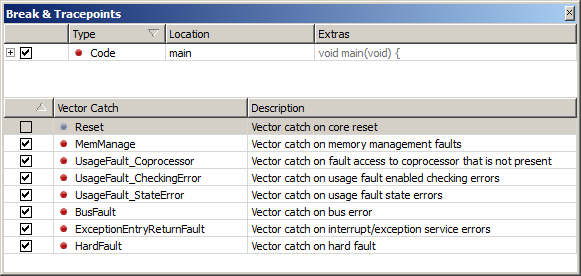
When debugging begins, Ozone enables Cortex-M fault vector capture. This causes program execution to immediately halt upon entering the fault handler. Ozone will display the target exception window. As shown in the above figure, you can use Ozone’s Break & Tracepoints window to set or clear individual vector captures. Ozone also provides the command Break.SetVectorCatch to programmatically edit the target’s vector capture state. For example, this command can be used to modify Ozone’s default vector capture initialization behavior at the start of debugging. This command is used in the project script function OnProjectLoad.
3. Debug Window
Now we use Ozone’s debug window to further understand the fault.
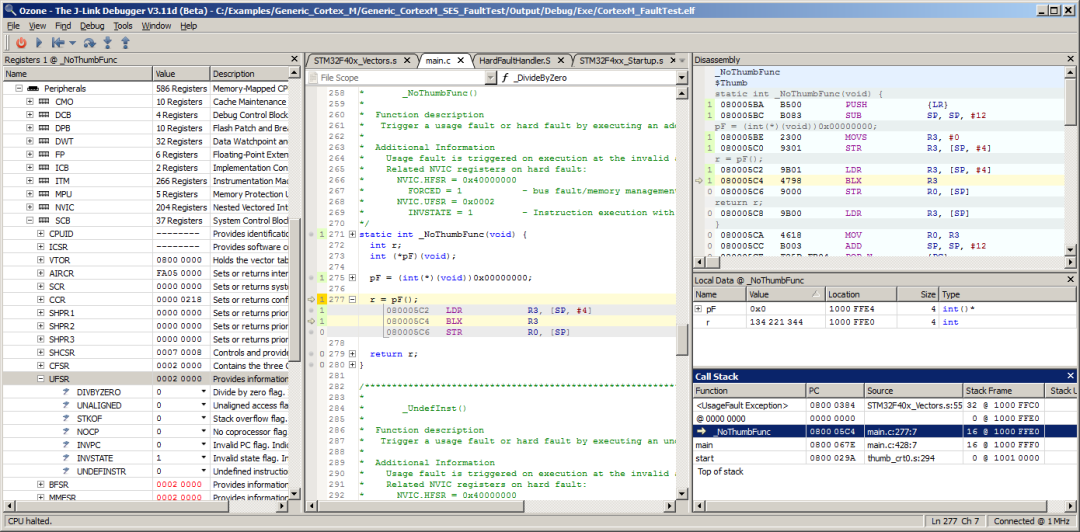
The Call Stack window shows that the target is in a UsageFault exception state. This window indicates that the fault originated from the function _NoThumbFunc. When we select _NoThumbFunc in the Call Stack window, Ozone’s call frame-aware debug window switches the output to the execution context of the selected frame (see the above figure). The Local Data window indicates that the execution at address 0 branch occurred in the function _NoThumbFunc. This caused the CPU to execute a Thumb instruction in ARM state. Looking at Ozone’s register window, the UFSR register confirms that the CPU has issued an INVSTATE UsageFault.
Using Trace Features to Analyze Faults
In uncertain fault scenarios, the Cortex-M core cannot provide the accurate PC of the fault instruction. You can use Ozone’s trace window to quickly identify the fault instruction.
As shown in the example above, using Ozone’s Backtrace Highlighting feature makes it easy to trace the imprecise BusFault exception back to the erroneous store instruction.
Conclusion
Cortex-M processor exceptions include:
(1) HardFault exception, which is the default exception with a fixed priority of -1, higher than all interrupts and exceptions except NMI.
(2) MemManage exception, which can cause memory access violation exceptions using the Memory Protection Unit (MPU).
(3) BusFault exception, which is triggered on any memory access error, such as illegal read/write or vector capture.
(4) UsageFault exception, which is triggered on execution errors. The UsageFault exception is at vector table position 6, IRQ -11, with configurable priority. If UsageFault is not enabled, it will trigger HardFault instead.
In any exception, the exception handler is called from the vector table, similar to the interrupt handling process. When Ozone detects that the target system has crashed, it automatically analyzes the target state and provides the necessary information. The exception window indicates the cause of the crash, location, and NVIC registers; The Call Stack Window can also unwind from an exception to enable easy navigation to the location of error, even across multiple exceptions.
For more information, please refer to:
https://wiki.segger.com/Analyzing_Cortex-M_Faults_with_Ozone
Follow our WeChat public account [Miketech]
Reply “segger free software” to get the download link as prompted.
Reply “join group” to join the technical exchange group as prompted.
Product consultation:
Beijing: 010-62975900
Shanghai: 021-62127690
Shenzhen: 0755-82977971

Share, watch, and like; at least I want to have one