Abstract: PLC system failures can lead to significant losses. Rapidly locating and resolving issues is a core competency for engineers. This article systematically introduces practical tools such as LED status light diagnostics, online diagnostics, and Trace tracking functions using Siemens S7-1200/1500 PLC and TIA Portal as examples, establishing an efficient fault troubleshooting methodology.
No matter how stable a system is, it can still encounter faults. Efficient diagnostic capabilities can minimize downtime. The Siemens TIA Portal platform provides extremely powerful diagnostic tools, transforming troubleshooting from ‘guessing based on experience’ to ‘data-driven analysis.’
1. First Site: Interpreting CPU Module LED Status Lights
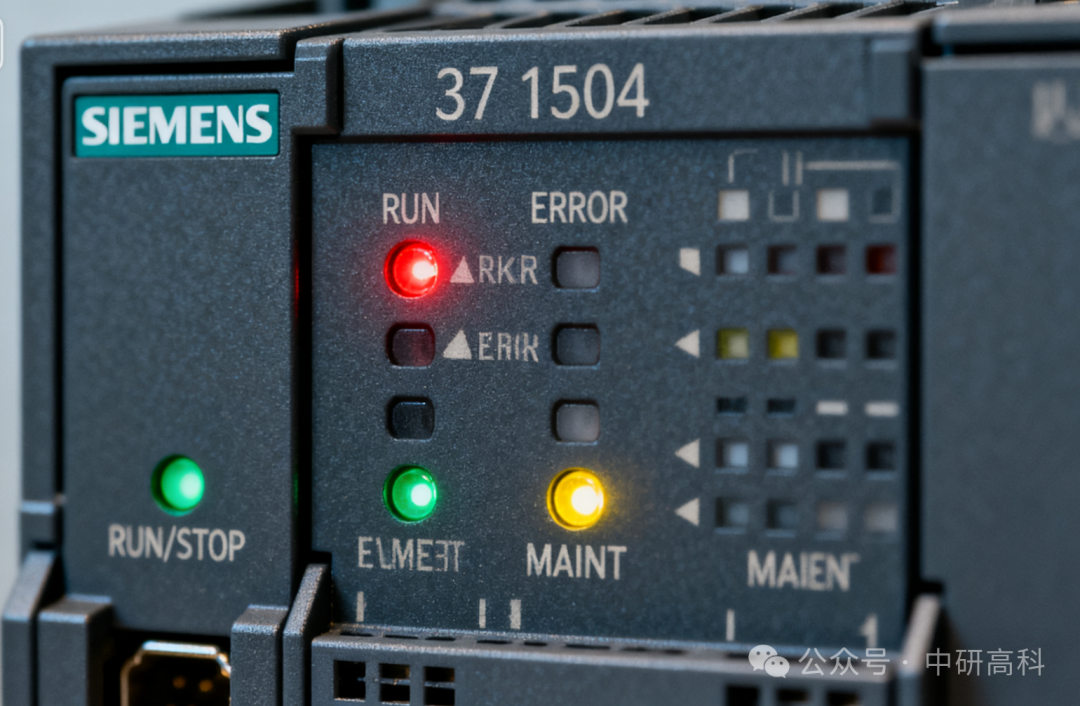
When the system exhibits abnormalities, the first step is to observe the LED indicators on the PLC CPU module, which is the most direct and rapid preliminary judgment method.
-
RUN/STOP: Green RUN indicates it is running; Yellow STOP indicates a stopped state, possibly due to program errors, hardware configuration errors, or manual switch settings.
-
ERROR: Red flashing indicates an error, such as hardware failure or network configuration errors; Red solid indicates a fatal error, and the CPU has stopped.
-
MAINT: Yellow solid indicates a maintenance event, such as the need to insert a storage card.
-
LINK/RX/TX: Used for PROFINET interfaces, displaying the connection and communication status of the port.
2. Core Tool: TIA Portal Online and Diagnostic Functions
-
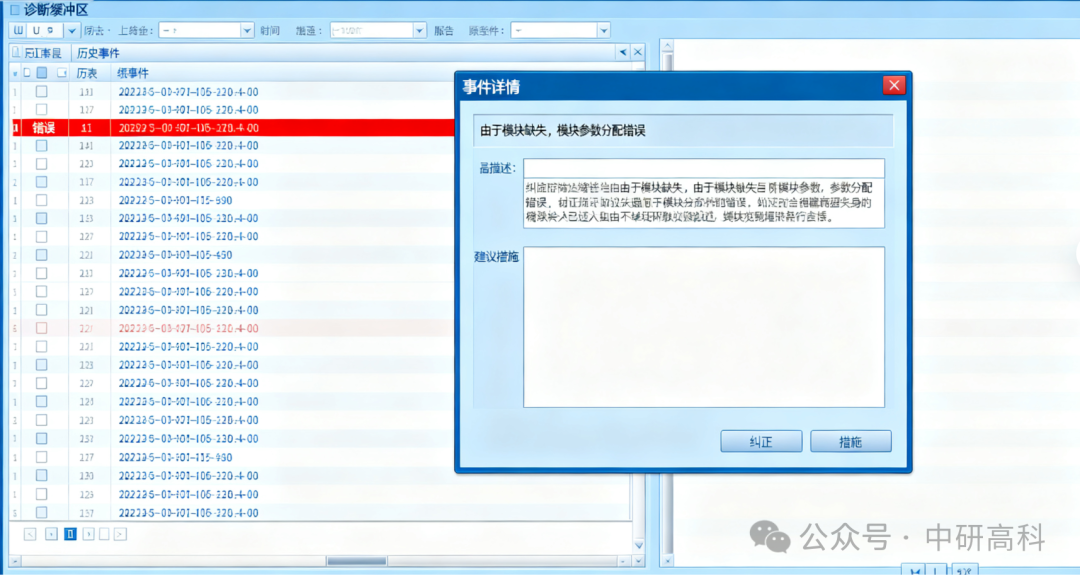
Online Connection and Diagnostic Scan: After connecting the computer to the PLC, click on the PLC device in the project tree and select “Online > Go Online.” TIA Portal will automatically perform a diagnostic scan and generate a detailed history of all events in the diagnostic buffer. This is the most powerful diagnostic tool.
-
Interpreting the Diagnostic Buffer: This records all information, warnings, and error events in chronological order. Clicking on any event will provide a detailed explanation of that event, possible causes, and handling suggestions. For example, it will clearly inform you of “module not found” or “spare part for IO device not found.”
-
Hardware Diagnostic View: After going online, the modules in the device configuration view will display their status in intuitive colors:
-
Green: Normal
-
Yellow: Warning or configuration issue
-
Red: Error, module failure or missing
-
Gray: Unable to connect or powered off. Click on any colored module to view its specific diagnostic information.
3. Advanced Tool: Trace Tracking Function
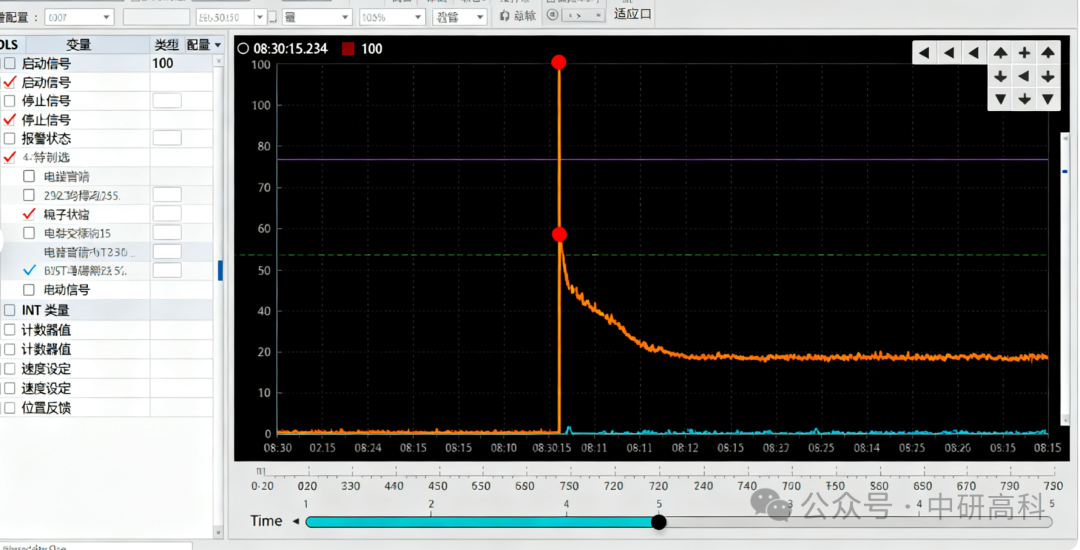
For intermittent faults, such as a suddenly changing signal, conventional monitoring may struggle to capture the issue. In this case, the Trace function can be used. It can continuously record the changes of specified variables (such as a BOOL emergency stop signal or an INT speed value) at a very high sampling rate, similar to an “oscilloscope,” and plot them as a curve, helping engineers accurately locate momentary anomalies.
Conclusion: Efficient fault diagnosis is a systematic process. From observing hardware indicator lights, to using the TIA Portal diagnostic buffer and hardware diagnostics for precise localization, and finally utilizing the Trace function to capture transient faults, Siemens provides a complete toolchain. Mastering these tools can minimize the Mean Time To Repair (MTTR) and ensure continuous and stable production operations.