Click on the above ” Technical Training “, select “Pin to Top Public Account”
Over 110,000 industrial control professionals follow this WeChat platform: Technical sharing, learning exchange, industrial control videos
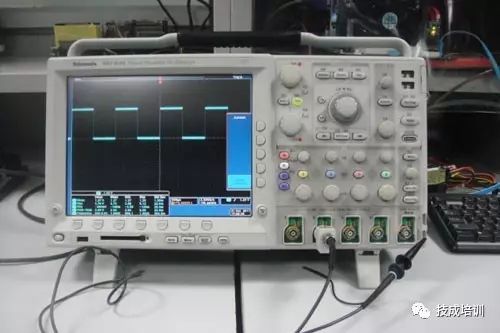
Using an oscilloscope, you can observe the waveform curves of various electrical signals’ amplitudes changing over time. Based on this, oscilloscopes can be used to measure parameters such as voltage, time, frequency, phase difference, and modulation depth. Below are the steps for using an oscilloscope to observe electrical signal waveforms.
Depending on the frequency of the signal being measured, set the Y-axis input coupling switch to AC or DC.
Based on the approximate peak-to-peak value of the signal being measured (if using an attenuating probe, divide by the attenuation factor; when the coupling mode is set to DC, also consider the superimposed DC voltage), set the Y-axis sensitivity V/div switch (or Y-axis attenuation switch) to the appropriate level. In practical use, if voltage measurement is not needed, you can adjust the Y-axis sensitivity fine-tuning (or Y-axis gain) knob to display the desired waveform height on the screen.
Typically, set the trigger (or sync) signal polarity switch to the “+” or “-” position.
Based on the approximate value of the signal’s period (or frequency), set the X-axis scanning speed t/div (or scanning range) switch to the appropriate level. In practical use, if time measurement is not needed, you can adjust the scanning speed t/div fine-tuning (or scanning fine-tuning) knob to display the required number of cycles of the waveform on the screen. If you need to observe the edge of the signal, the scanning speed t/div switch should be set to the fastest scanning speed level.
Good resources – need to share!
Click to read the original text to learn about PLC, mechanical drawing, and CNC robot knowledge