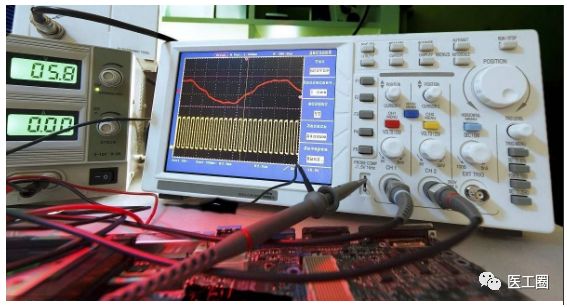
Oscilloscope, as its name implies, is a machine that displays waveforms, and it is also known as the “eye of the electronic engineer.” Its core function is to display the actual waveform of the measured signal on the screen, allowing engineers to locate problems or evaluate system performance, among other tasks. Its development has also gone through two eras: analog and digital. First, let’s take a look at the images, as shown in Figure 1.
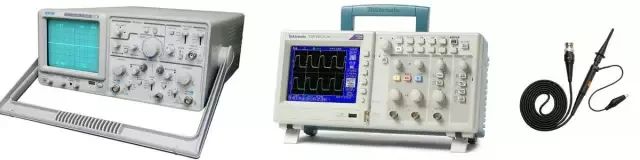
Figure 1: Analog Oscilloscope, Digital Oscilloscope, Oscilloscope Probe
Currently, analog oscilloscopes have mostly been phased out; it is now the era of digital oscilloscopes. Accordingly, I will only use digital oscilloscopes as an example for explanation.
Digital Oscilloscope, more accurately called a Digital Storage Oscilloscope (DSO), does not refer to its ability to store waveforms onto USB drives or other media, but rather in contrast to the real-time display feature of analog oscilloscopes. Analog oscilloscopes rely on cathode ray tubes (CRT, commonly known as electronic guns) to emit electron beams, which are deflected by the magnetic fields created by the measured signals, thus reflecting the waveform of the measured signal on the screen. This process is instantaneous, with no storage involved. In contrast, the principle of the digital oscilloscope is as follows: first, the oscilloscope uses a front-end ADC to rapidly sample the measured signal, with sampling speeds typically reaching hundreds of millions to billions of samples per second; however, the refresh rate of the liquid crystal display (LCD) in the back end is generally only a few dozen to over a hundred Hz. Thus, the data sampled at the front end cannot be displayed in real-time on the screen, leading to the creation of the storage stage: the oscilloscope temporarily stores the data sampled at the front end in its internal memory, and when refreshing the display, it reads data from this memory, thereby resolving the speed discrepancy between front-end sampling and back-end display.
Many people may be intimidated by the numerous buttons on the oscilloscope’s panel when they first encounter it, especially since oscilloscopes are generally quite expensive. This fear is unnecessary because, although oscilloscopes appear complex, using their core function—displaying waveforms—is not complicated; it can be accomplished in just three or four steps. The complexity of modern oscilloscopes arises from the addition of many auxiliary functions, all of which have their value. Skillfully applying them can yield significant benefits, but as beginners, we will focus solely on utilizing the core, fundamental functions.
Similar to a multimeter, to use an oscilloscope, it must first be connected to the system under test using an oscilloscope probe, as shown in Figure 1. Oscilloscopes typically have 2 or 4 channels (usually labeled with the numbers 1 to 4, with any additional probe socket being for external triggering, which is generally not used). The low positions of these channels are equivalent, allowing you to choose freely. Insert the probe into one of the channels and connect the small clip at the other end of the probe to the reference ground of the system being tested (it is crucial to note that the clip on the oscilloscope probe is directly connected to the ground, i.e., the ground wire of the three-prong plug. Therefore, if there is a voltage difference between the reference ground of the system being tested and the earth, it may damage either the oscilloscope or the system under test). Once the probe contacts the test point, the oscilloscope can capture the voltage waveform at that point (ordinary probes cannot be used to measure current; a special current probe must be selected for current measurement).
Next, you need to adjust the buttons on the oscilloscope panel to display the measured waveform at an appropriate size on the screen. You only need to adjust the oscilloscope’s parameters based on the two major elements of a signal—amplitude and period (frequency and period are conceptually equivalent), as shown in Figure 2.
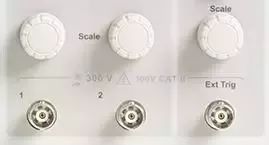
Figure 2: Oscilloscope Amplitude and Time Axis Knobs
As shown in the figure, the knobs above each channel socket are used to adjust the amplitude of that channel, which is the vertical size adjustment of the waveform. By turning them, you can change the voltage value represented by each vertical grid on the oscilloscope screen, which is referred to as “volt/div” adjustment. As shown in the following two comparison images: the left image is 1V/grid, and the right image is 500mV/grid. The amplitude of the left image’s waveform occupies 2.5 grids, thus it is 2.5V; the right image’s waveform occupies 5 grids, also 2.5V. It is recommended to adjust the waveform to resemble the right image, as this allows the waveform to occupy a larger portion of the measurement range, thus improving measurement accuracy, as shown in Figure 3.
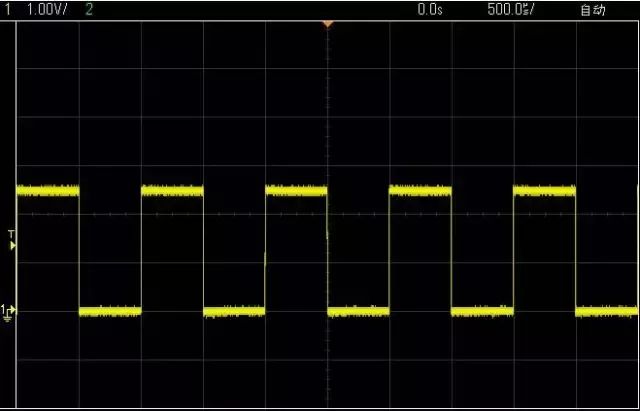

Figure 3: Comparison of Oscilloscope Volt/Div Adjustment
In addition to the volt/div knob usually found at the top, there is typically another knob of the same size on the panel, which is used to adjust the period, i.e., the horizontal size adjustment of the waveform. By turning it, you can change the time value represented by each horizontal grid on the oscilloscope screen, which is referred to as “sec/div” adjustment, as shown in the following two comparison images: the left image is 500us/grid, and the right image is 200us/grid. In the left image, one period occupies 2 grids, so the period is 1ms, corresponding to a frequency of 1KHz. In the right image, one period occupies 5 grids, also 1ms, thus 1KHz. There is no issue of which is more reasonable here; specific problems should be addressed specifically, and both are very reasonable, as shown in Figure 4.
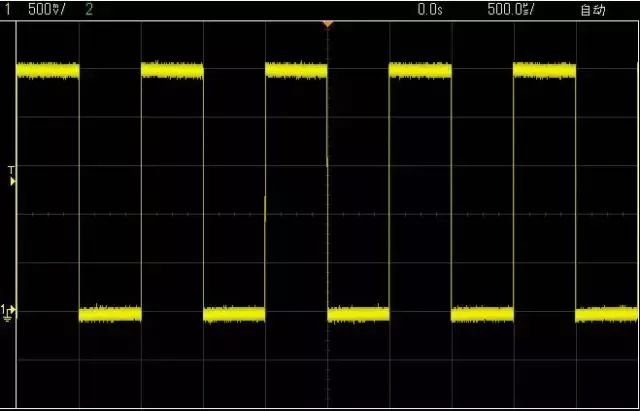
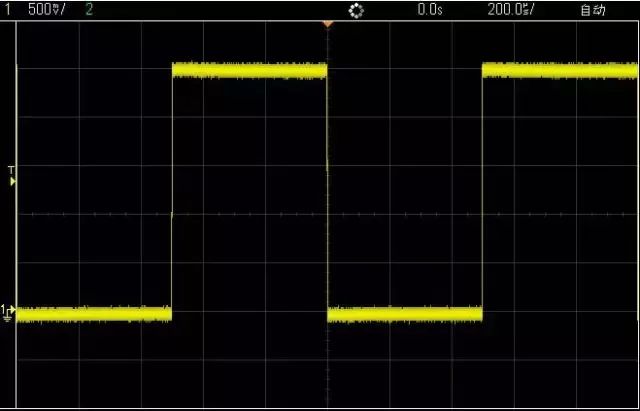
Figure 4: Comparison of Oscilloscope Sec/Div Adjustment
Often, simply performing the above two adjustments may yield a visible waveform, but this waveform may be very unstable, shaking back and forth, overlapping, making it difficult to see, as shown in Figure 5.
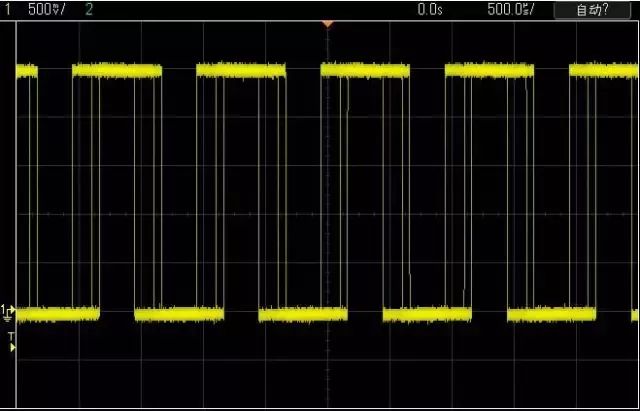
Figure 5: Illustration of Improper Trigger Level Adjustment on Oscilloscope
This is due to the trigger settings on the oscilloscope not being adjusted correctly. So, what is triggering? Simply put, triggering is setting a reference point around which the waveform’s acquisition and display revolve. The most commonly used trigger setting is based on voltage level (it can also be based on time or other quantities; the principle is the same). In the several waveform images above, there is always a T and a small arrow on the left side; T indicates triggering, and the position pointed to by the small arrow corresponds to the current trigger level voltage. The oscilloscope captures and displays a portion of the data before and after the waveform crosses this level, allowing you to see the waveforms shown in Figures 4 and 5. As shown in Figure 6, we can see that the waveform will never cross the position pointed to by T, meaning it will never reach the trigger level, resulting in an unstable appearance. How do we adjust the trigger level? Look for a knob labeled Trigger on the oscilloscope panel; turning this knob will change the position of T.

Figure 6: Oscilloscope Trigger Knob
In addition to changing the trigger level, you can also set the trigger mode: for instance, choosing to trigger on the rising edge or the falling edge, meaning deciding whether to trigger when the waveform crosses the trigger level while increasing or while decreasing. These settings are generally made through buttons in the Trigger section and easy-to-navigate menu keys on the screen.
By following the above three or four steps, you can utilize the core functionality of the oscilloscope to observe various signals in a microcontroller system. For instance, if the system does not operate after powering on, you can use it to check whether the waveform at the crystal oscillator pin is normal. It is important to note that the waveform at the crystal oscillator pin is not a square wave; it resembles a sine wave more closely. Additionally, the waveforms on the two pins of the crystal oscillator are different; one with a smaller amplitude is the input, and the one with a larger amplitude is the output, as shown in Figure 7.
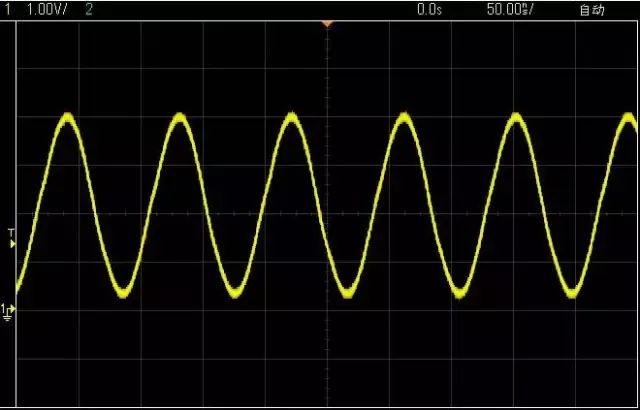
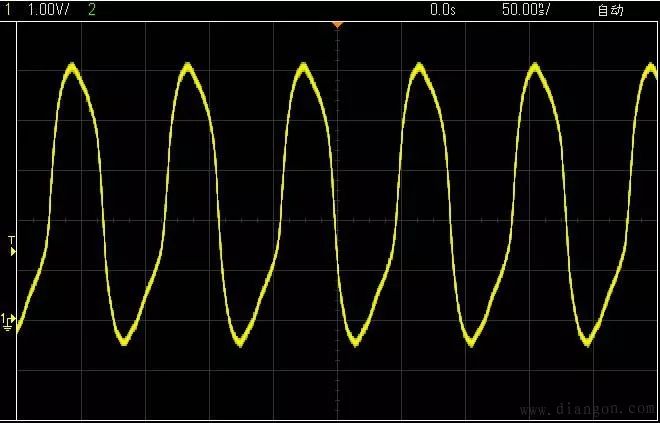
Figure 7: Measured Crystal Oscillator Waveform with Oscilloscope
Copyright Statement: The material is sourced from Medical Engineering Home, and the copyright belongs to the original author. This article is for educational sharing purposes only.

How to Quickly Master Basic Knowledge and Service Skills for Medical Equipment?
Medical Engineering Classroom: Inductor Knowledge and Exam Points
Medical Engineering Classroom: Capacitor Knowledge and Exam Points
Medical Engineering Classroom: Basic Concepts of Sine AC
Medical Engineering Classroom: Knowledge of Power Supply and Rectifier Circuits
Medical Engineering Classroom: Knowledge of Filter Circuits
Medical Engineering Classroom: Resistor Knowledge and Exam Points
Composition and Classification of Medical X-ray Equipment
Clinical Engineers, Coming to the Forefront from Behind the Scenes
Medical Engineering Skills 365: Common Fault Repair Examples for MRI BG-4 Linear Accelerators
Medical Engineering Classroom: Basic Learning of DR Equipment Maintenance
Medical Engineering Practical Skills: How to Repair Dialysis Machines, Do You Know?
Friendly Reminder: Clinical Engineering Tutoring Class will start at the end of December; replies can inquire.