Introduction: Misconceptions about ADC Noise Floor
Many performance metrics of ADCs need to be obtained through spectrum analysis. The general process involves the ADC first collecting a set of data, and then generating a spectrum graph on a PC through FFT calculations.
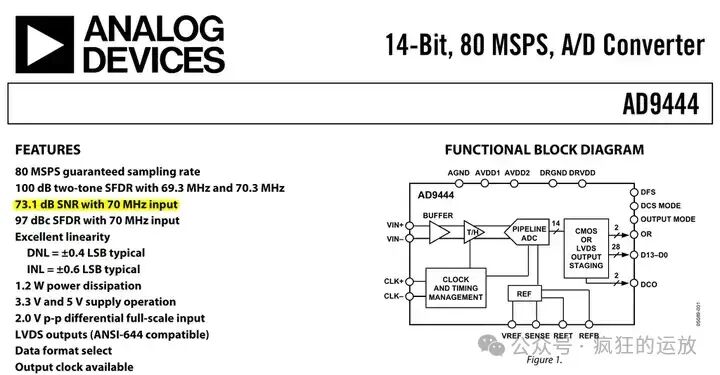
The data sheet of the ADC will also display such spectrum graphs. For example, the screenshot below is from the AD9444, an ADC chip from Analog Devices (ADI):
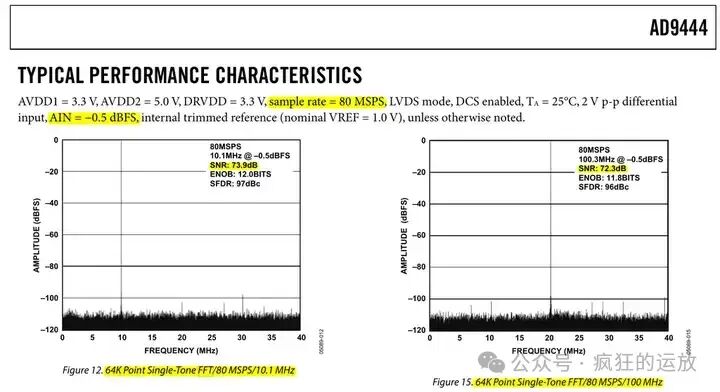
Figures 2 show the spectrum graphs for input signals of 10.1 MHz and 100.3 MHz, respectively, and as mentioned in the text, they underwent a 64K Points FFT calculation.
Note: The 100.3 MHz input was sampled at 80 MSPS, which causes aliasing according to the Nyquist sampling theorem, thus folding to around 20 MHz.
Looking closely at Figure 2, if we ask what the noise floor of this ADC is, how should we respond?
Many would intuitively say: -120 dBFS.
This statement is incorrect.
You might also realize that the input signal is -0.5 dBFS, and if the noise floor is -120 dBFS, the difference would yield an SNR of 119.5 dB, which clearly contradicts the ADC’s specifications.
So where is the problem?
Analysis of the Cause
FFT divides the horizontal axis of the spectrum graph into many bins. The number of points participating in the FFT calculation is M (64K Points in the above graph), and the bandwidth is half of the sampling rate Fs (80 MSPS / 2 = 40 MHz in the above graph), thus the number of bins is M / 2, and the Δf contained in each bin is (Fs/2) / (M/2) = Fs / M.
The vertical axis of the spectrum graph represents the energy or RMS value of the bins, and importantly, it only represents the situation within a single bin.
For ADC SNR, to calculate the signal-to-noise ratio, the noise comes from quantization, thermal noise, clock jitter, etc., and the key point is that the noise is distributed across the entire bandwidth.
The noise of a single bin being -120 dBFS is correct, but if the signal is only compared to a single bin, the result will definitely be larger than the SNR.
Now let’s look at one of ADI’s classic MT series tutorials, MT-003 (reference [2]), which includes a diagram showing the relationship between SNR and the “ADC Noise Floor” in the spectrum graph, and it gives this so-called “ADC Noise Floor” an accurate name, called “FFT Noise Floor”, which is not the true “ADC Noise Floor”:
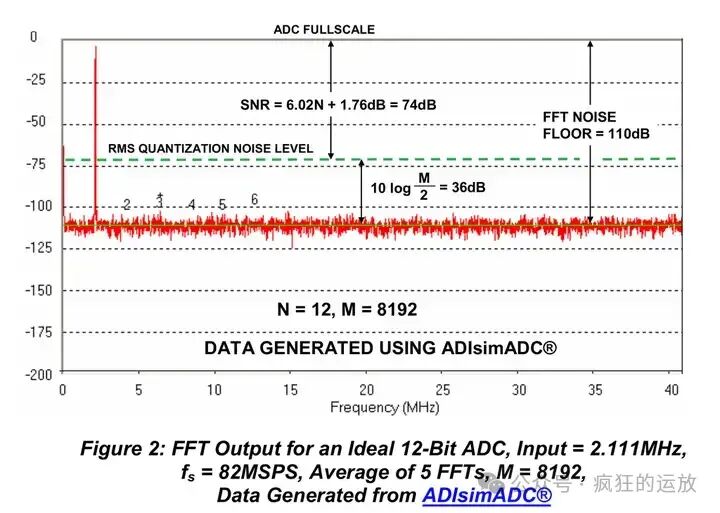
For the example in the figure:
- An ADC with N = 12 bits was used, and the FFT point count M was 8192 Points;
- SNR only considers quantization noise, so it can be calculated using the ideal formula, SNR = 6.02*N + 1.76 = 74 dB;
- The position of the FFT Noise Floor must be lower than the SNR, and the difference in position between the FFT Noise Floor and SNR can also be calculated using the formula, 10 log (M/2) = 36 dB;
- Subtracting the two, FFT Noise Floor = -74 – 36 = -110 dB, which corresponds to the position of -110 dB on the vertical axis of the spectrum graph.
In the MT-003 document, the difference in position between the FFT Noise Floor and SNR is defined as “FFT Process Gain”. Therefore, remember that the FFT Noise Floor seen on the spectrum graph is lower than the SNR, and the actual ADC noise calculation needs to be accumulated across the entire bandwidth.
Additionally, it is important to note that FFT bins have variability. This variability is related to the “bandwidth” and the “FFT point count”. For example, the following figure is from another technical article by ADI, “Use Noise Spectral Density to Evaluate ADCs in Software-Defined Systems” (reference [3]):
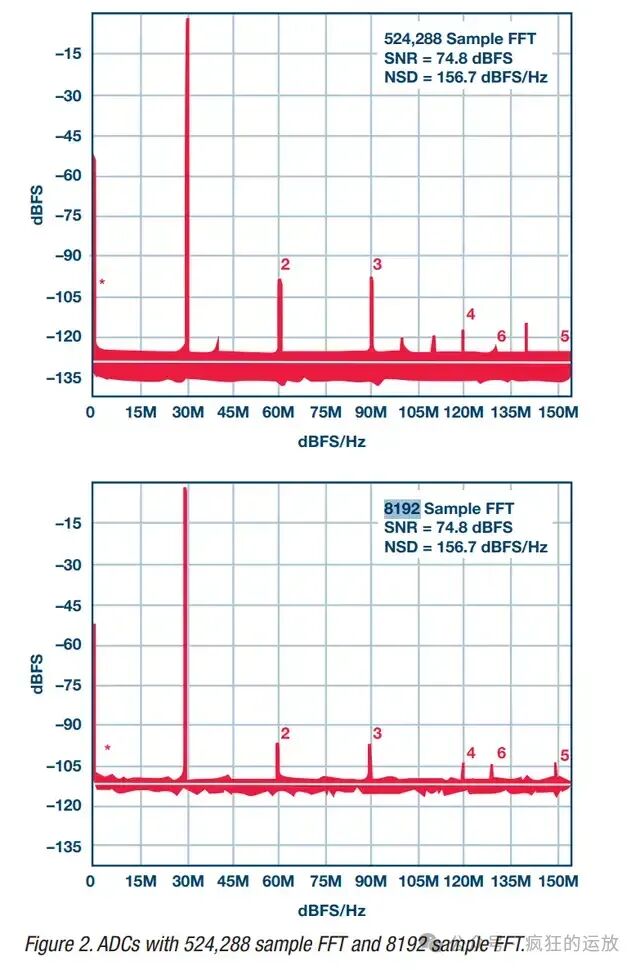
In the figure, both have a bandwidth of 150 MHz, but the upper graph used 524,288 Points for FFT, while the lower graph used 8192 Points. This results in one FFT Noise Floor being approximately -130 dB and the other being approximately -110 dB.
We can understand this from the perspective that the former has more bins, dividing the bandwidth into smaller Δf (higher spectral resolution); the latter has fewer bins, dividing the bandwidth into larger Δf (lower spectral resolution). Ideally, the total noise remains unchanged, but with fewer bins, a single bin covers more frequencies, resulting in a higher FFT Noise Floor.
Correct Interpretation of ADC Noise Floor
Returning to Figures 1 and 2, let’s see if we can deduce the correct noise floor from the information in the figures.
First, convert the -120 dBFS FFT Noise Floor to a linear value: 10^(-120/10) = 10^(-12)
With a total of 64K Points for FFT, but the bandwidth range is Fs/2, corresponding to the number of FFT bins being M/2, we accumulate it across the bandwidth range: 10^(-12) * 64,000/2 = 0.000000032
Then convert it to dBFS: 10 * log(0.000000032) = −74.95 dBFS
This -74.95 dBFS is the ADC noise floor.
Considering the input signal is -0.5 dBFS, the difference gives us the SNR: SNR = -0.5 – (-74.95) = 74.45 dB
This is close to the SNR described for the AD9444, which is 72.3 dB, 73.9 dB, etc. The specific difference may come from the precise reading of the spectrum graph, estimating that the FFT Noise Floor is actually slightly higher than -120 dBFS.
We can also verify this using the earlier formula for FFT Process Gain: FFT Process Gain = 10 log (M/2) = 10 log (64,000/2) = 45.05 dB
Then calculate the SNR: SNR = Input Level – FFT Noise Floor – FFT Process Gain = -0.5 – (-120) – 45.05 = 74.45 dB
Conclusion
This article discusses the common spectrum graphs found in ADC data sheets, emphasizing that the noise in the spectrum graph is the FFT Noise Floor, which does not represent the ADC noise floor. The SNR should be calculated after correcting with formulas like FFT Process Gain.
References
-
ADI AD9444 Datasheet: https://www.analog.com/en/products/ad9444.html
-
ADI MT-003: https://www.analog.com/media/en/training-seminars/tutorials/mt-003.pdf
-
ADI Use Noise Spectral Density to Evaluate ADCs in Software-Defined Systems: https://www-cce.cldnet.analog.com/media/en/technical-documentation/tech-articles/Use-Noise-Spectral-Density-to-Evaluate-ADCs-in-Software-Defined-Systems.pdf
Book RecommendationAbout Crazy Operational Amplifiers
This public account is designed to provide interesting and useful hardware and software columns for makers. Welcome to follow, like, and star~