Original source: Cytiva Academy
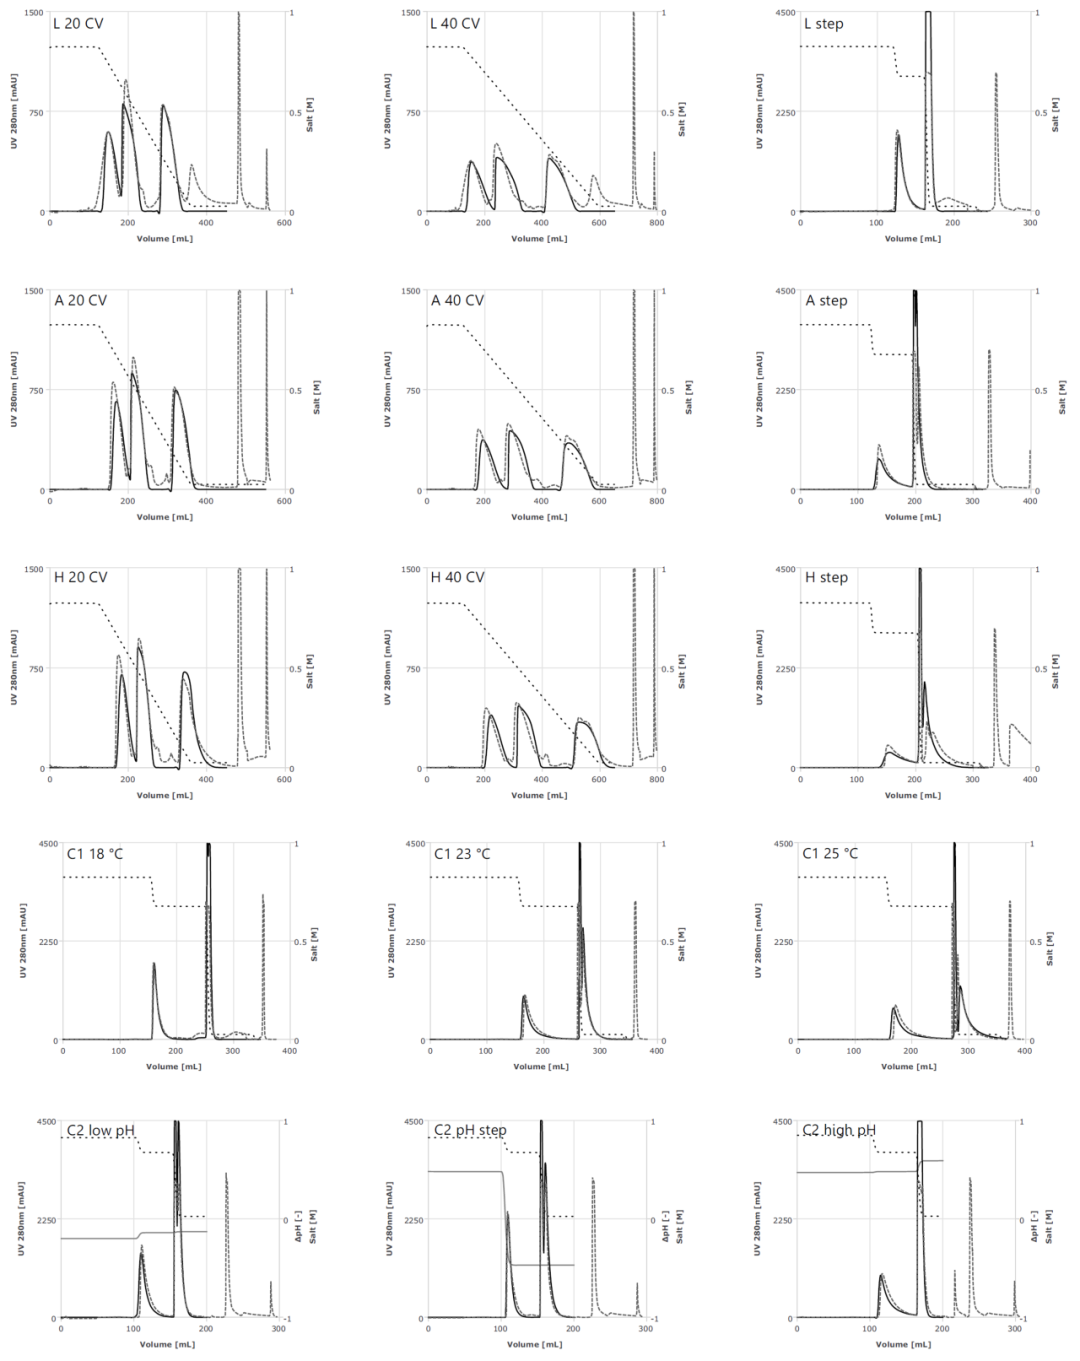
Table 1: Parameters and ranges selected during the simulation screening
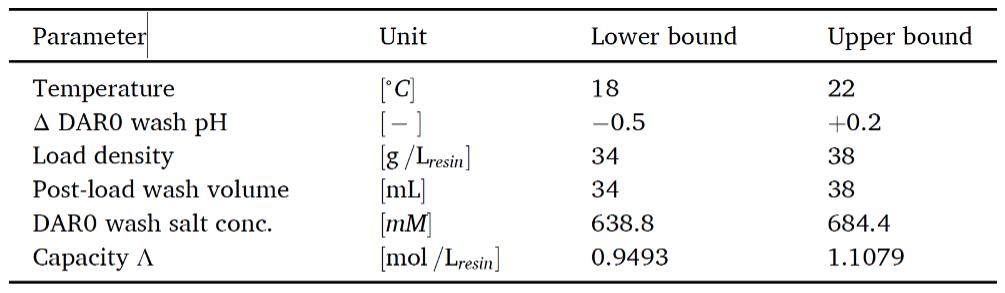
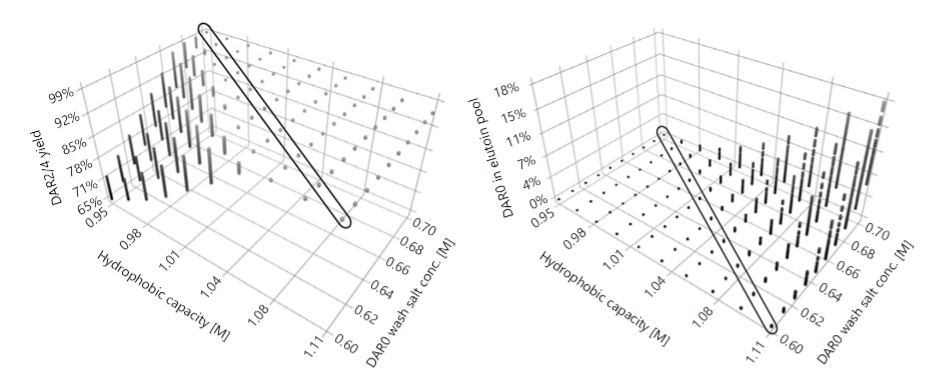
Figure 2:Results of the simulation screening based on the above table displayed as a scatter plot

Table 2: Comparison of model predicted values and actual measured values in the isocratic elution process
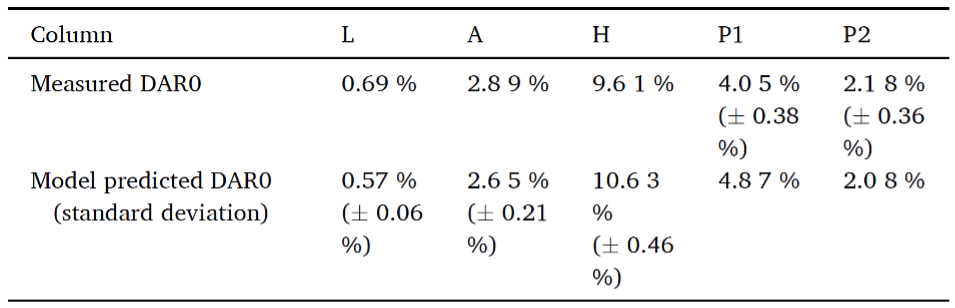
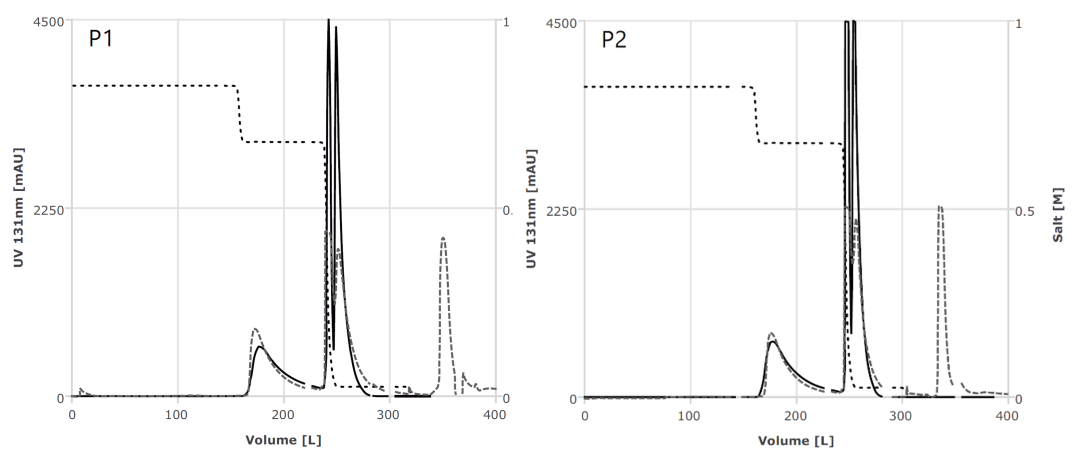
Figure 3:P1 and P2 are both chromatography columns with a volume of approximately 14 L. The dashed lines represent the actual measured values of conductivity and UV, while the solid lines represent the simulated values from GoSilico software
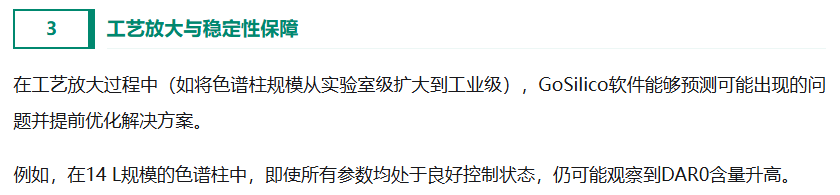
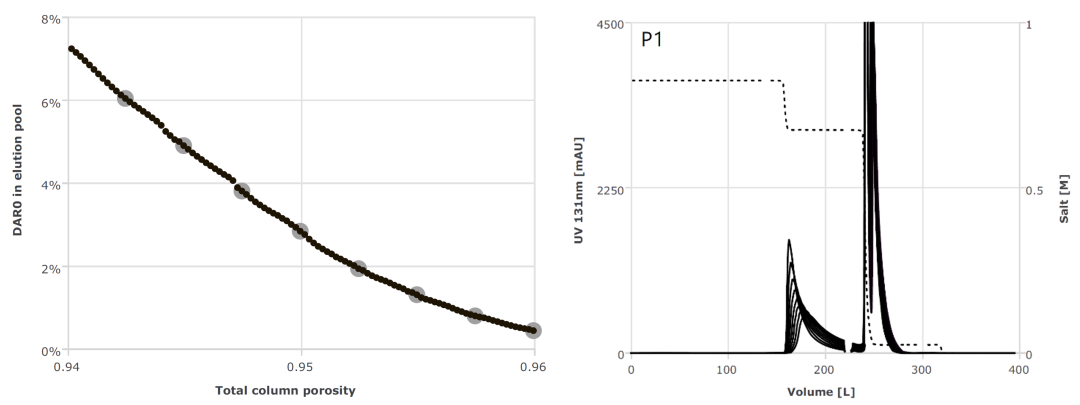
Figure 4: The model predicts the effect of total porosity on the DAR0 level of the elution component in column P1 (left image). The points marked with gray circles in the left chart correspond to the chromatography profiles overlaid in the right image. The highest DAR0 peak is produced by high total porosity

Related Articles:
GoSilico Mechanism Modeling Chromatography Metaverse (I): Evolution of Downstream Process Development Methods
GoSilico Chromatography Mechanism Modeling Software Debuts

This issue’s keywords:
#GoSilico