MRI is a noninvasive medical imaging test that uses magnets and radio waves to create detailed images of almost every internal structure in the body. The core components of MRI include:
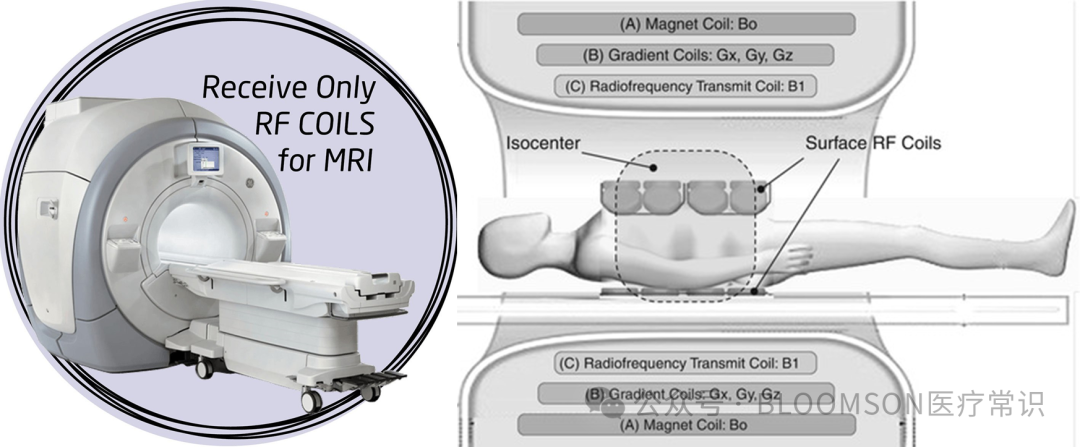
- Main Magnetic Field, in the most common cylindrical (closed) MRI devices, the direction of B₀ is parallel to the long axis of the examination hole (the passage the patient enters), with an intensity measured in teslas (Tesla, T). The commonly used clinical strengths are 1.5T and 3.0T, while ultra-high field devices for research can reach 7.0T or even higher (the Earth’s magnetic field strength is approximately 0.00005T or 50 microteslas).
- Transmit Coil, which generates radio frequency pulses (RF Pulse), producing magnetic field components (B1 field) to excite protons (hydrogen nuclei) in the human body, causing their magnetization direction to deviate from equilibrium. The transmit coil is typically a large, fixed coil integrated into the inner wall of the scanner’s opening. The RF field it generates needs to uniformly cover the entire scanning area (such as the entire head or body) to ensure that all protons in the target area are evenly excited. For most clinical examinations, an MRI machine usually has only one transmit coil.
- Receive Coil, when protons are excited, they release electromagnetic signals during their return to equilibrium (relaxation). The role of the receive coil is to detect these very weak signals. The closer the receive coil is to the target tissue, the stronger the signal it receives, resulting in a higher signal-to-noise ratio (SNR) and better image quality. Therefore, receive coils are usually “customized” for specific body parts and need to be placed close to the scanned area. An MRI machine is equipped with many different receive coils, for example, the head coil wraps around the head like a helmet.
1. Magnetic Resonance Imaging
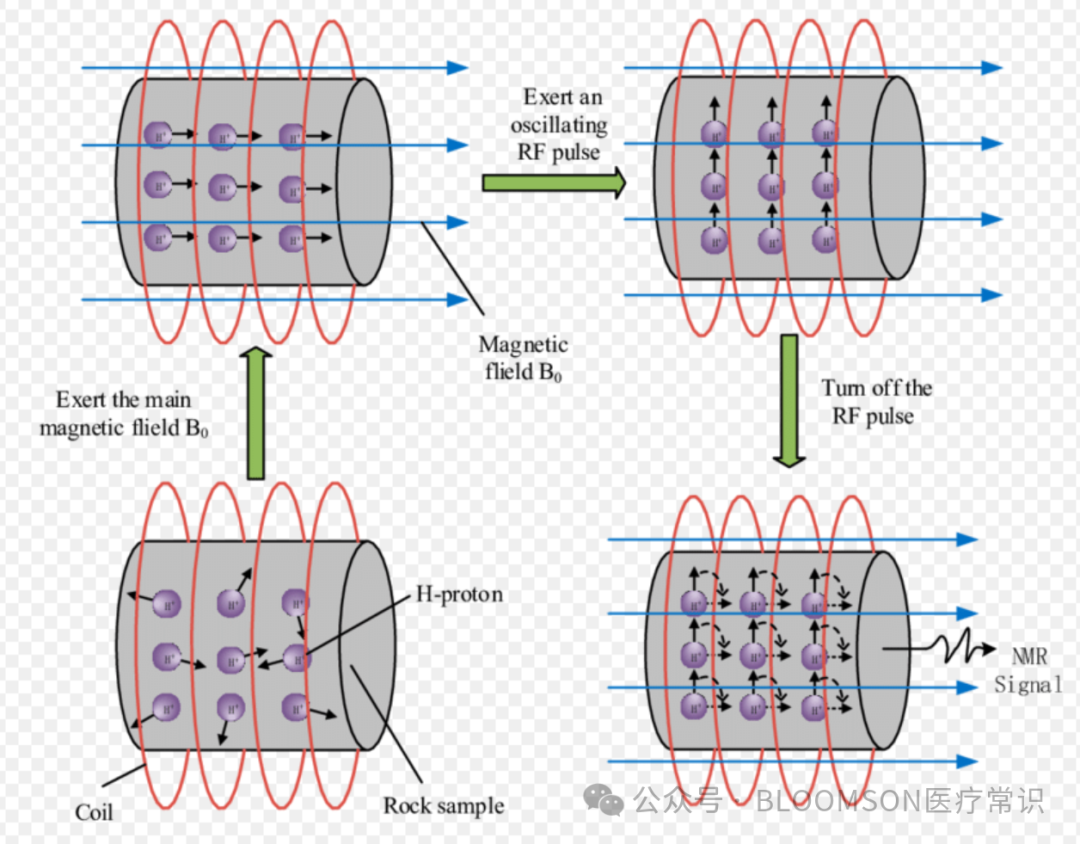
MRI is the abbreviation for Magnetic Resonance Imaging, also known as magnetic resonance imaging. The core process of MRI is to use a strong magnetic field (the main magnetic field of the device, B0, such as 1.5T, 3.0T) to align the rotation direction of hydrogen nuclei (protons, including those in water molecules and fat) in the human body, and then under the influence of radio frequency pulses (which are oscillating electromagnetic fields, a specific frequency of electromagnetic waves, Radio Wave), this alignment will change, leading to changes in the magnetic field signal. Different pathological tissues have different water content, resulting in variations in this change over time, which, after computer processing and reconstruction, forms anatomical images reflecting the structure of the tissues and the pathological states of different diseases.
The basic process is as follows:
- Alignment: The human body is placed in a strong static magnetic field (MRI device), and the disordered motion of protons (mainly hydrogen nuclei in water molecules) aligns like countless small magnetic needles along the direction of the magnetic field.
- Excitation: A specific frequency radio frequency pulse (Radiofrequency Pulse, generating B1 magnetic field) is emitted, disturbing the ordered state of the protons, causing them to absorb energy and deviate and resonate.
-
The frequency of the radio frequency pulse = The Larmor frequency of the protons
-
When the frequencies match, resonance occurs. Protons efficiently absorb energy from the radio frequency pulse, and the macroscopic manifestation is that the net magnetization vector (Net Magnetization Vector) is tilted from the longitudinal (Z-axis) to the transverse (XY plane).
- Relaxation: After the radio frequency pulse is turned off, protons release the absorbed energy and gradually return to their original equilibrium state, a process known as “relaxation”, which is the so-called retraction after withdrawal.
-
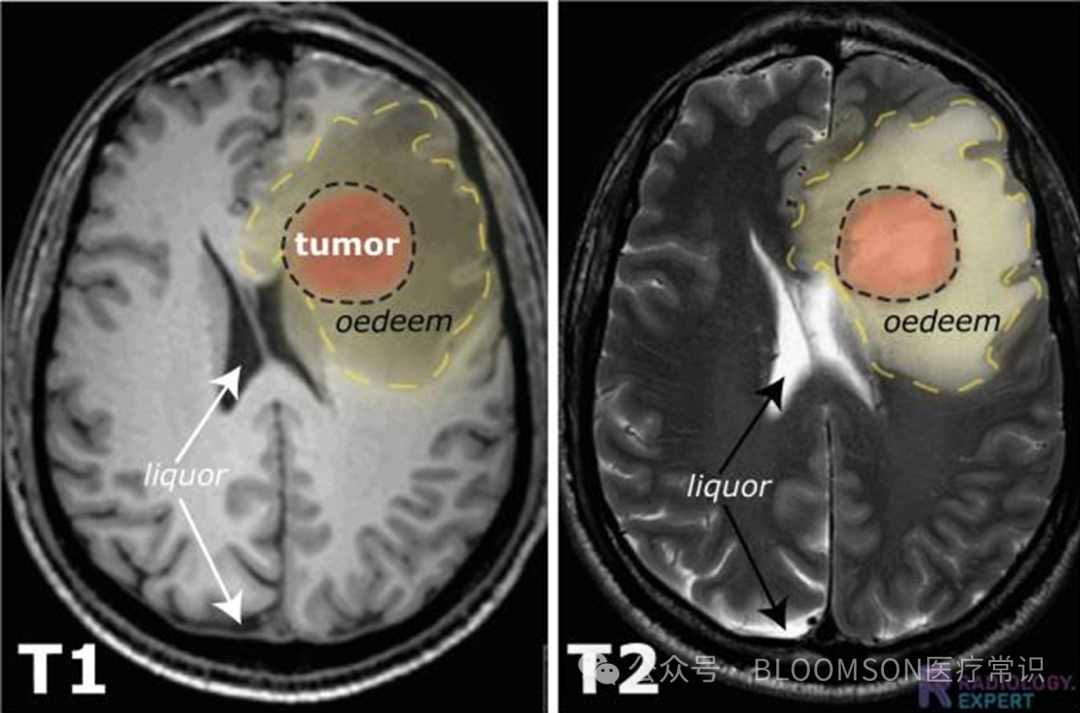
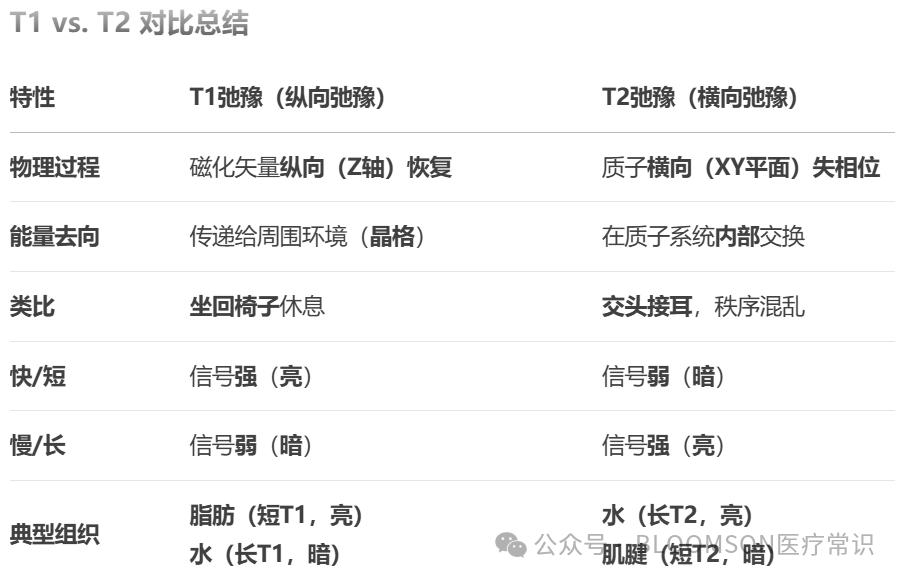
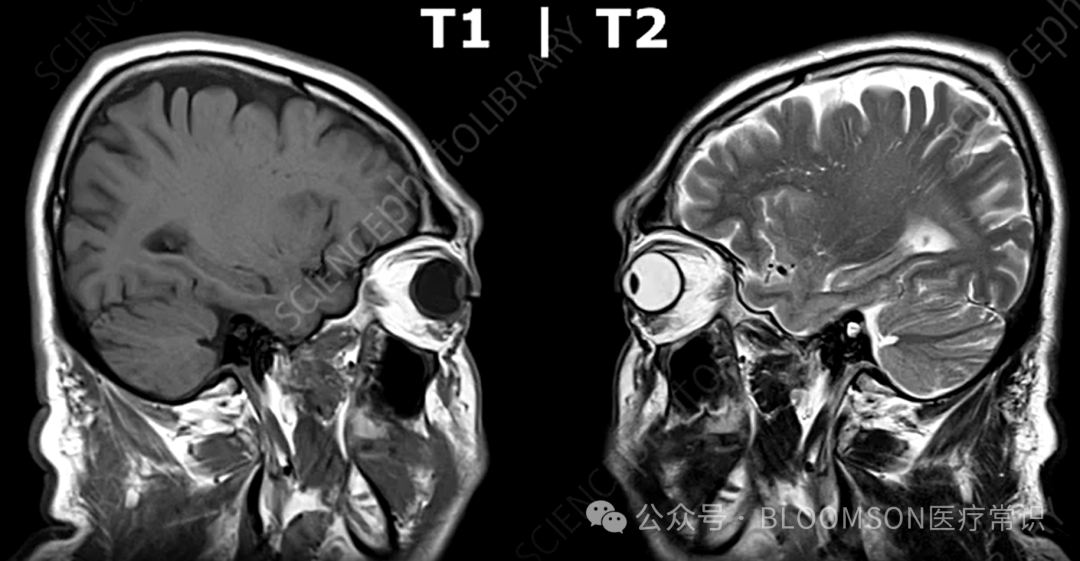
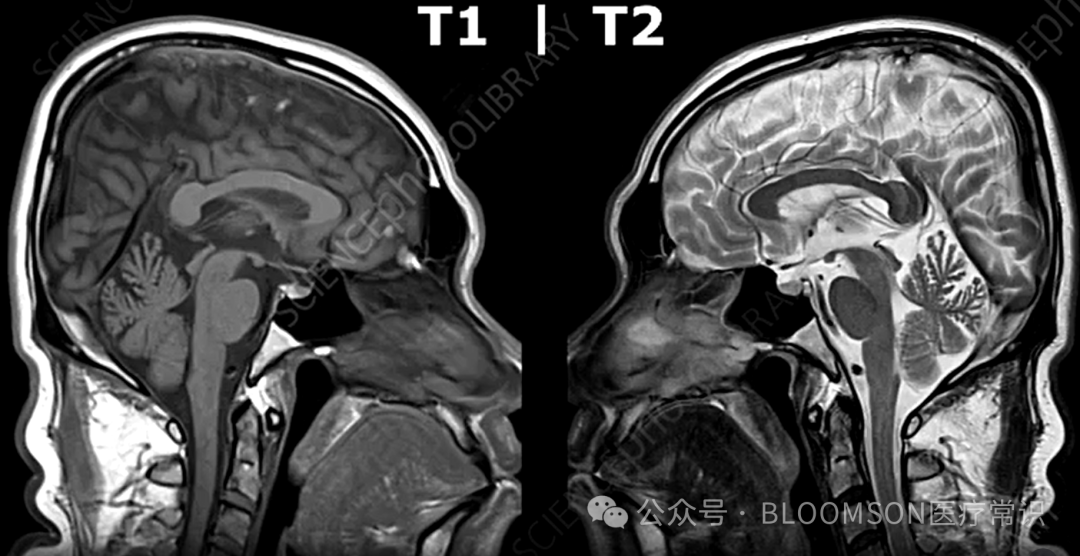
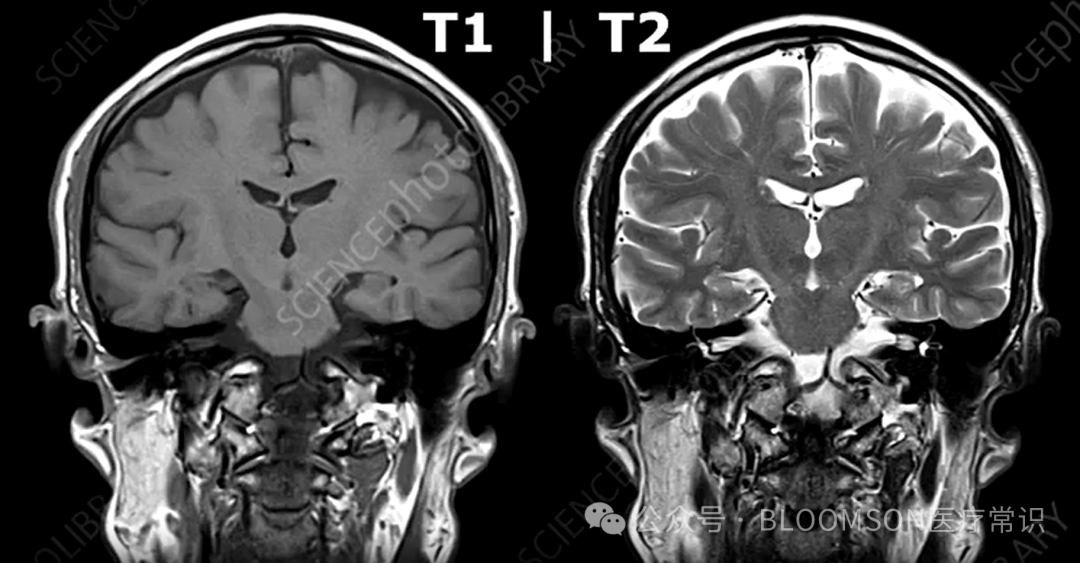
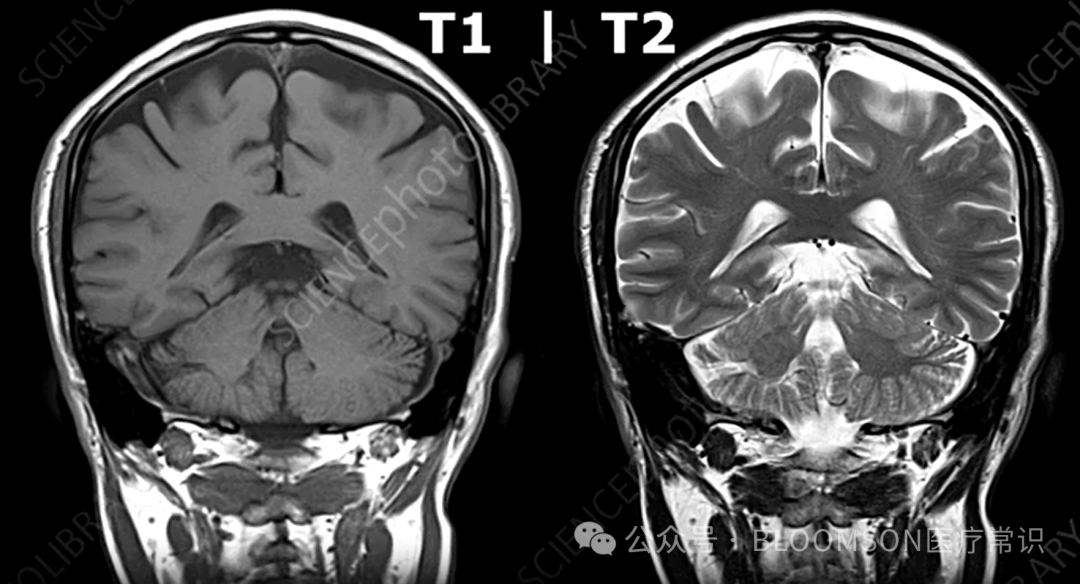
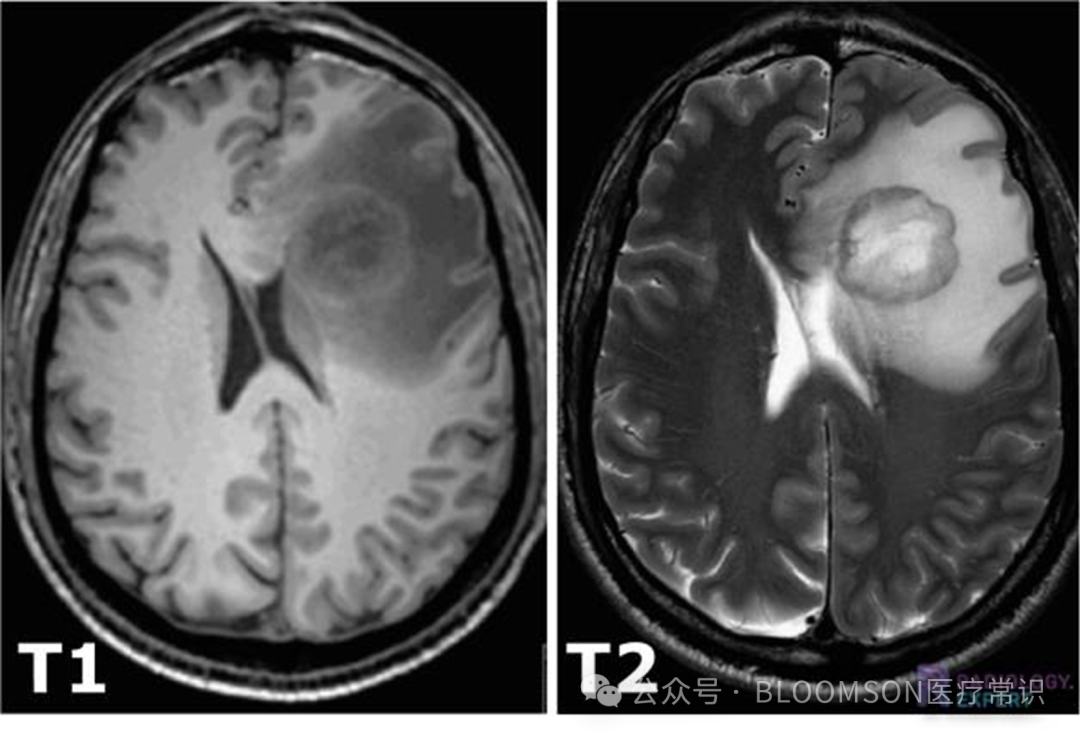
T1 is longitudinal relaxation, which measures the time constant required for the net magnetization vector that has been tilted to recover along the direction of the (longitudinal) main magnetic field (Z-axis) to its initial equilibrium state. A short time indicates a short T1, quick recovery, strong signal, bright image, seen in fat, paramagnetic substances (such as gadolinium contrast agents), and subacute hemorrhage.
-
T2 is transverse relaxation, which measures the time constant required for protons rotating in the XY plane to lose phase coherence (dephase). The time from order to disorder is due to energy transfer between protons; a long time indicates a long T2, slow recovery, strong signal, bright image, seen in water, cerebrospinal fluid (CSF), and water/cysts.
- Signal Acquisition: The surrounding receive coils detect the electromagnetic signals released during proton relaxation, which have varying retraction times, allowing for imaging.
- Image Formation: The computer uses complex algorithms to reconstruct images based on the spatial frequency of the signals (achieved through gradient magnetic fields for spatial encoding) and their strength (determined by relaxation times, including T1, T2, etc.).The signals ultimately collected by MRI are time-varying voltage signals, more professionally referred to as free induction decay (FID) signals or echo signals. Essentially, it is an analog electrical signal in the time domain.
 2. Diffusion Weighted Imaging
Diffusion is like dropping a drop of ink into a glass of clear water; over time, the ink will slowly and spontaneously spread out into the surrounding clear water, eventually turning the entire glass of water a light color. The process of water molecules moving randomly and irregularly (Brownian motion) from areas of high concentration to low concentration is also diffusion..
In human tissues, water molecules are also engaged in this never-ending, random thermal motion. Diffusion Weighted Imaging (DWI) is a magnetic resonance imaging technique that is very sensitive to this random movement of water molecules.
The MRI machine can “mark” the movement of water molecules by applying a pair of special, equal intensity but opposite direction diffusion-sensitive gradient pulses.
-
If the water molecules are stationary: The first gradient pulse will cause all water molecules’ phases to deviate, and the second reverse gradient pulse (called diffusion encoding) will perfectly “correct” this deviation. There is almost no signal loss, which is due to pathological conditions, known as restricted diffusion, appearing bright on the image.
-
If the water molecules have moved: If a water molecule has moved position between the two gradient pulses, the second gradient pulse will not be able to perfectly “correct” the phase deviation caused by the first pulse. These molecules will “lose phase”, resulting in signal loss, appearing as low signal, indicating unrestricted diffusion, which is a physiological state, appearing darker on the image.
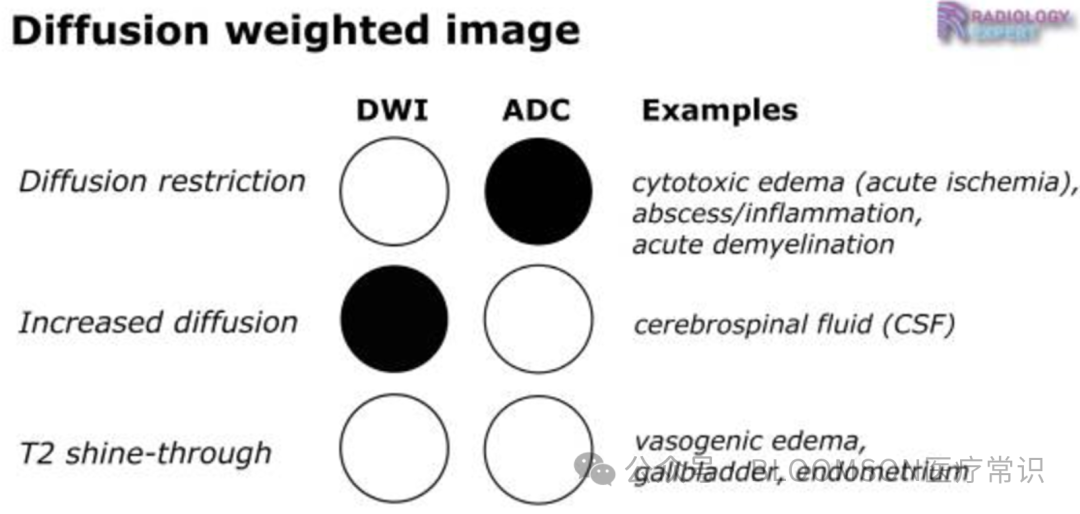
The result is that the signal intensity (brightness) on DWI images reflects the degree of restriction of water molecule diffusion. Restricted diffusion, stationary water molecules have strong signals (bright); unrestricted diffusion, moving water molecules have weak signals (dark).
-
High signal (bright) areas: indicate restricted diffusion, resulting from the obstruction of free movement of water molecules, seen in pathological conditions, especially acute cerebral infarction which leads to cytotoxic edema, cell swelling, and reduced extracellular space, trapping water molecules inside cells, thus appearing as abnormally high signals on DWI.
-
Low signal (dark) areas: indicate unrestricted diffusion, such as free water in cerebrospinal fluid or cysts, where water molecules can move freely, leading to significant signal loss from the diffusion-sensitive gradient pulses, making the local area appear dark.
If an area appears bright on DWI, indicating strong signals, there could be two reasons:
-
True restricted diffusion (this is the pathological information we want to see).
-
The T2 value of the tissue itself is long (for example, some cysts or old infarcts), which may appear bright on DWI even if its diffusion is unrestricted.
Therefore, the high signals appearing on DWI may indicate pathological conditions, but to eliminate the influence of the high T2 of the tissue itself and obtain pure diffusion information of the lesion (pathological state), the ADC value is introduced.
3. Apparent Diffusion Coefficient
Apparent Diffusion Coefficient, or ADC, ultimately forms a recognizable anatomical image, known as the ADC map, which is calculated from at least two different b-values of DWI images, quantifying the diffusion rate of water molecules.
The b-value is the “knob” that controls the degree of diffusion weighting, measured in s/mm², which can be understood as observing image changes at different thresholds.
-
The higher the b-value, the greater the sensitivity to water molecule movement, but the signal-to-noise ratio of the image will decrease.
-
The lower the b-value, the less sensitive it is to water molecule movement, making the image closer to a conventional T2-weighted image.
In practice, multiple b-values (e.g., b=0, b=1000) are typically used to collect data, which is then used to calculate the ADC map using formulas.
-
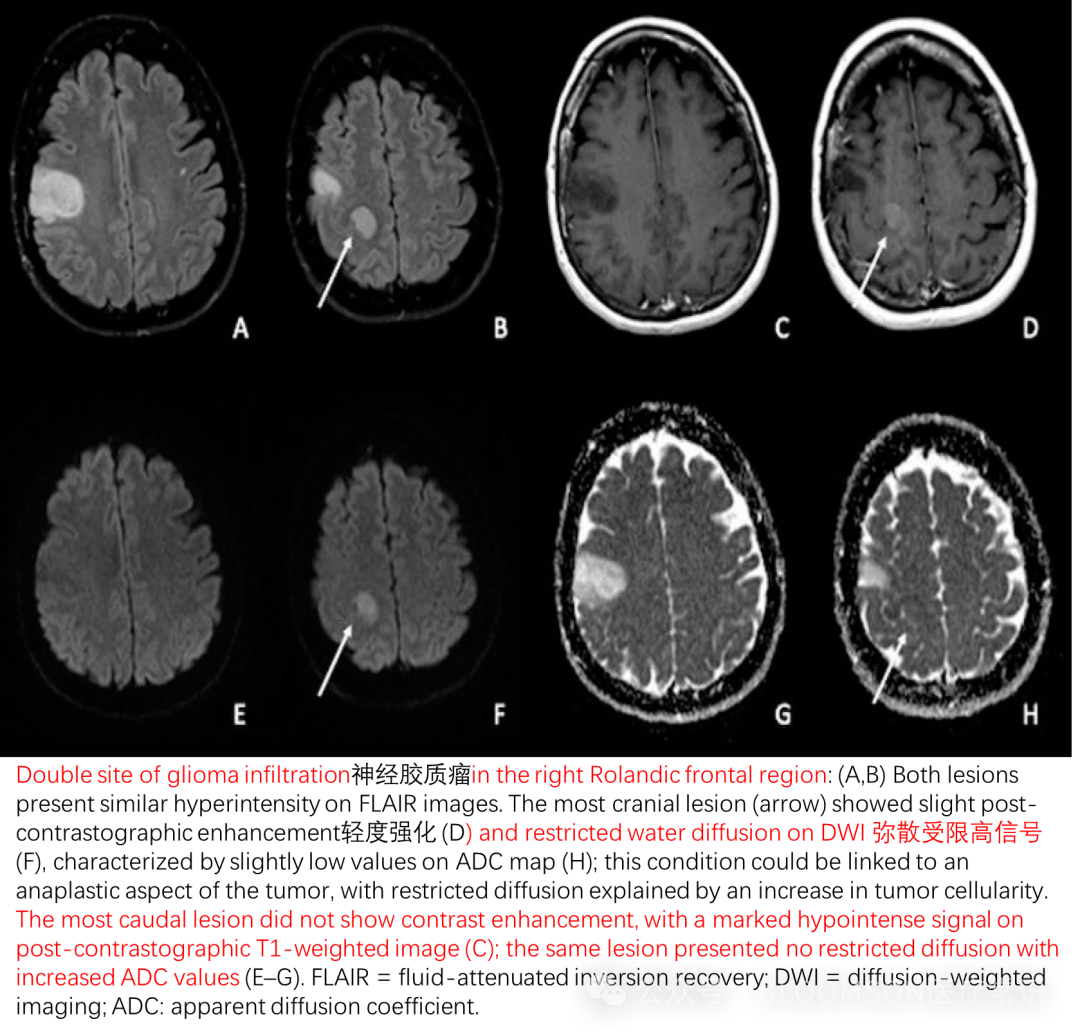
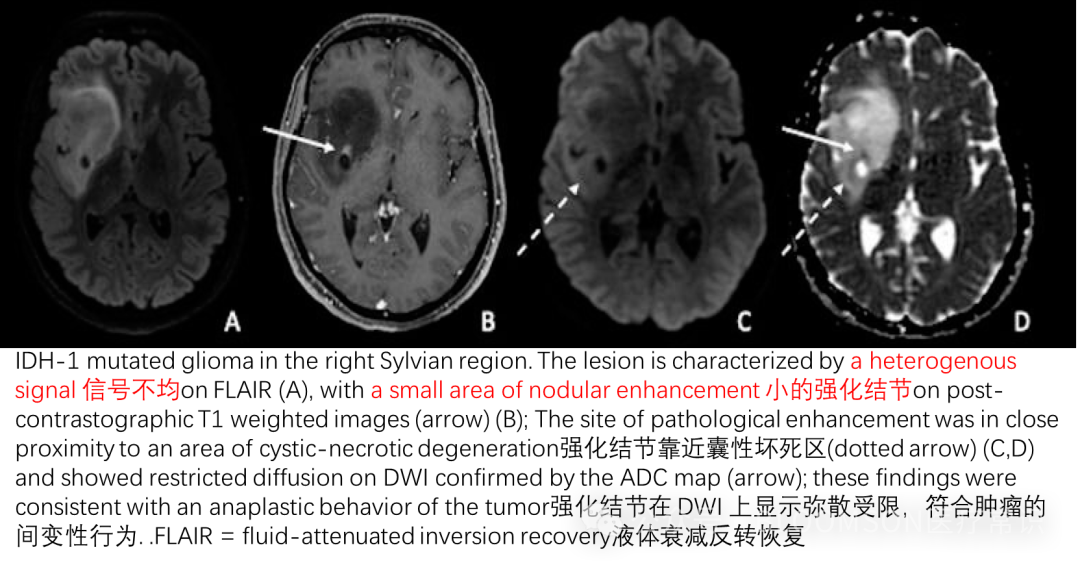
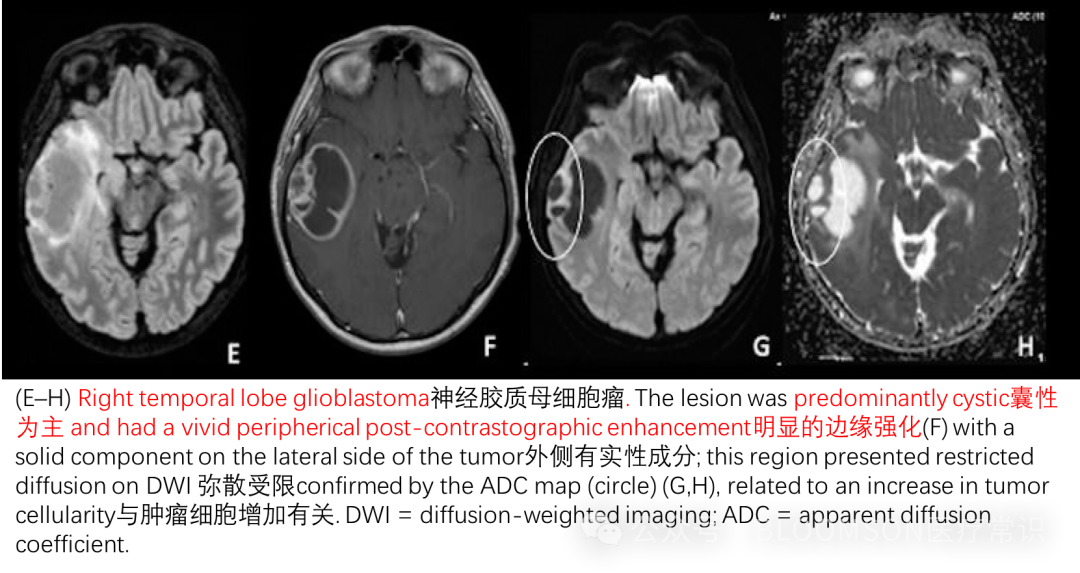
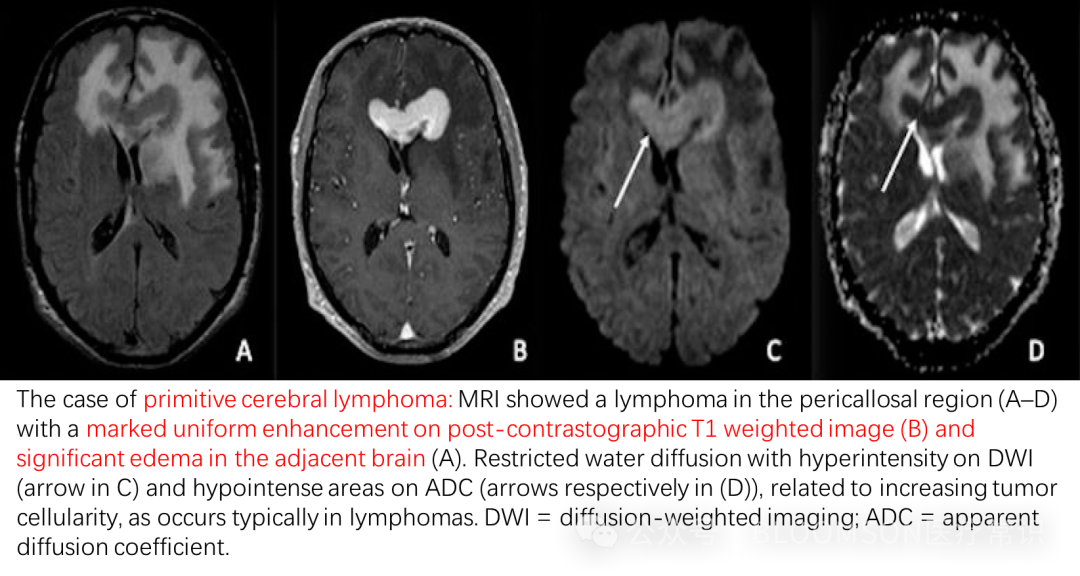
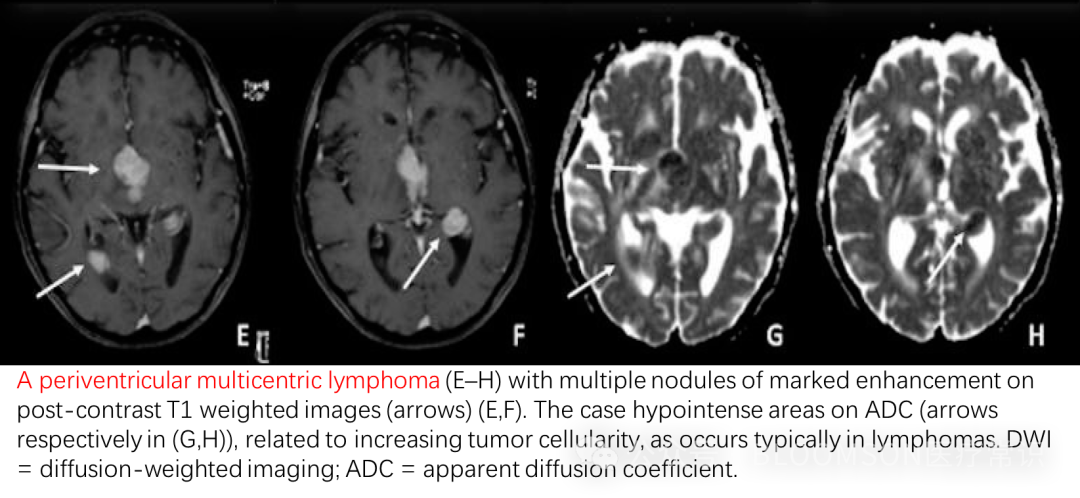
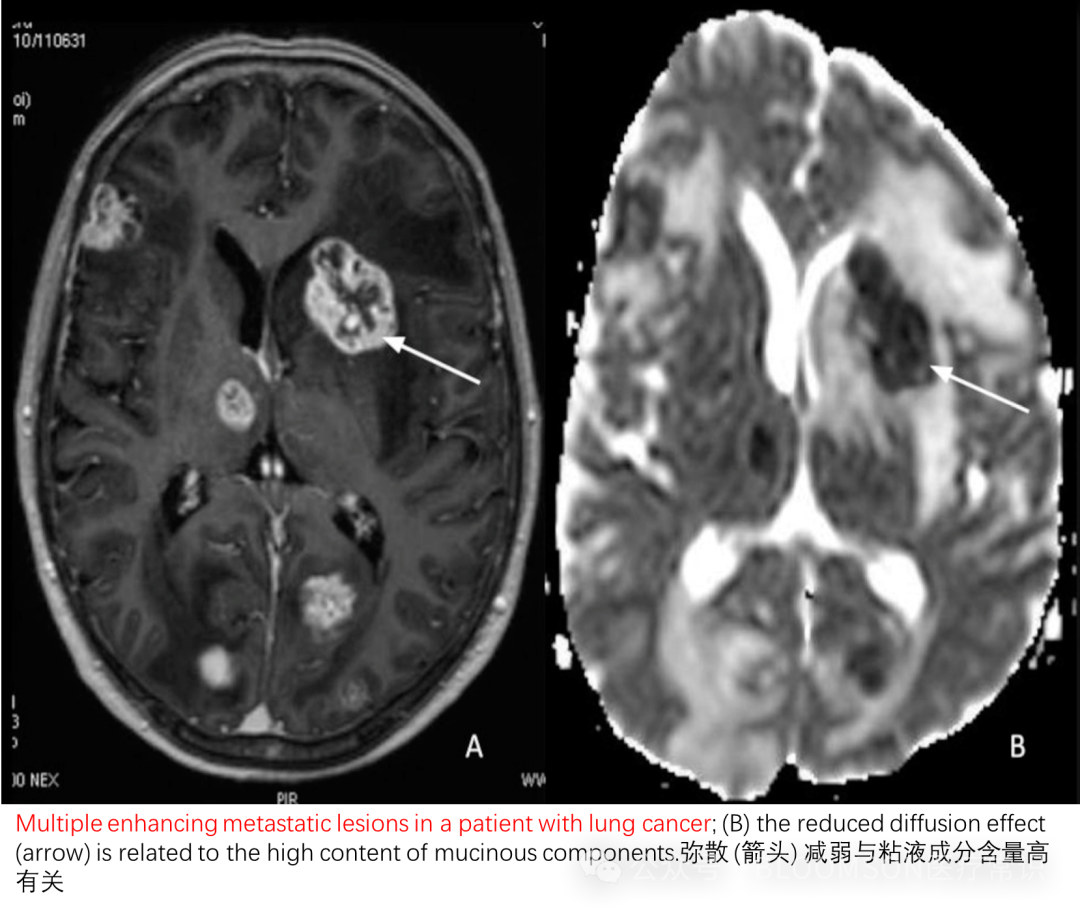
Low ADC values indicate slow diffusion rates of water molecules, severely restricted diffusion, such as in tumors, appearing as low signals (dark) on the ADC map; the lower the ADC value, the more restricted the diffusion.
-
High ADC values indicate fast diffusion rates of water molecules, unrestricted diffusion, such as in cysts, appearing as high signals (bright) on the ADC map.
Thus, DWI is used to observe the state of water in diseased tissues, as diffusion varies under different physiological and pathological conditions. To further differentiate the influence of high T2 (water-rich), ADC is continuously used for differentiation. Therefore, for image interpretation, DWI images and ADC images should be compared together. In tumors, restricted diffusion is often associated with high cell density, as tumor cells proliferate vigorously and are closely packed, occupying extracellular space and limiting the free movement of water molecules.
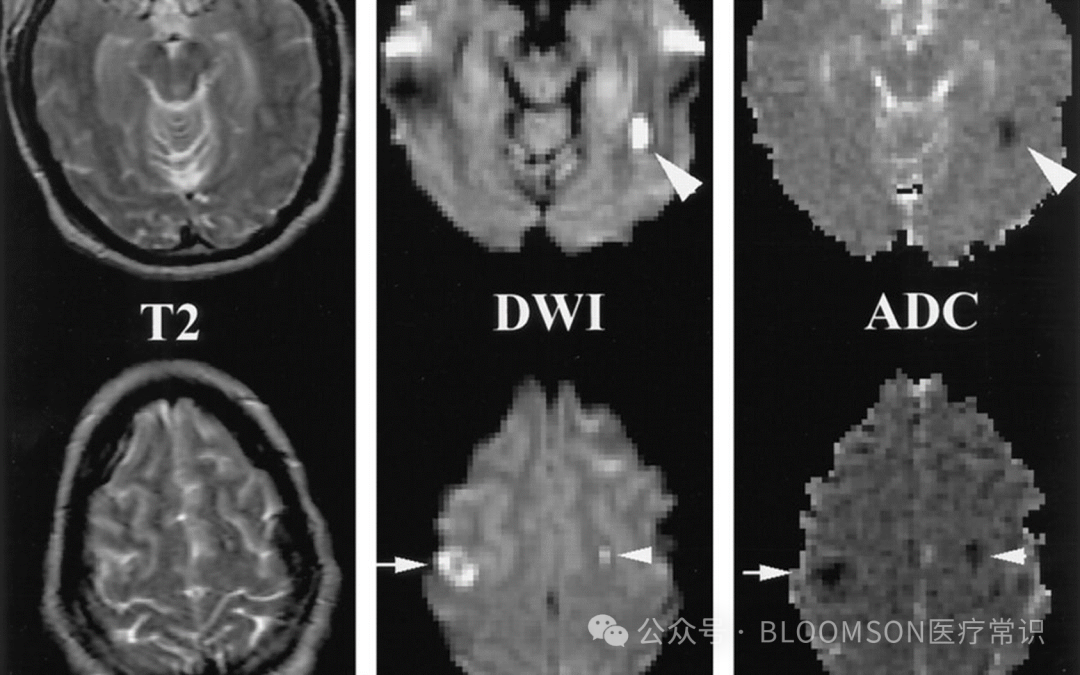
DWI represents T2 with superimposed bright signals indicating restricted diffusion – often an indicator of cytotoxic edema (e.g., ischemia). The most notable use of DWI is for the diagnosis of acute ischemic stroke. DWI images must always be compared to T2 and ADC images.
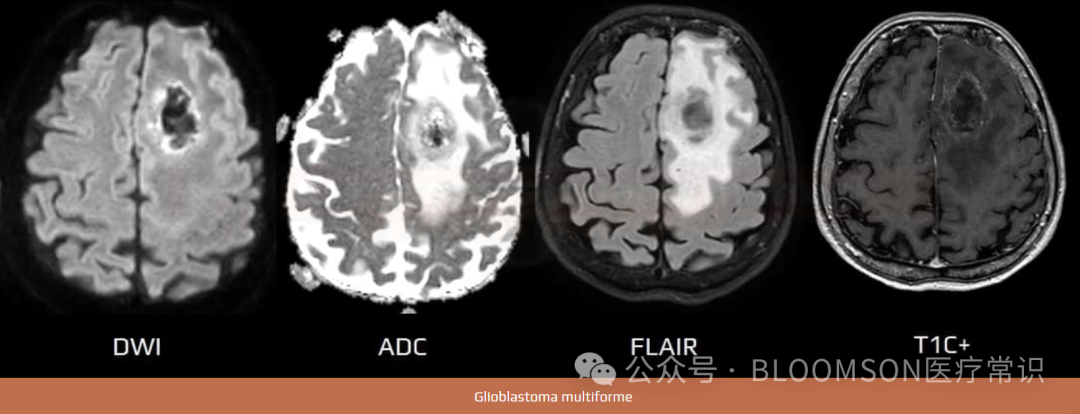
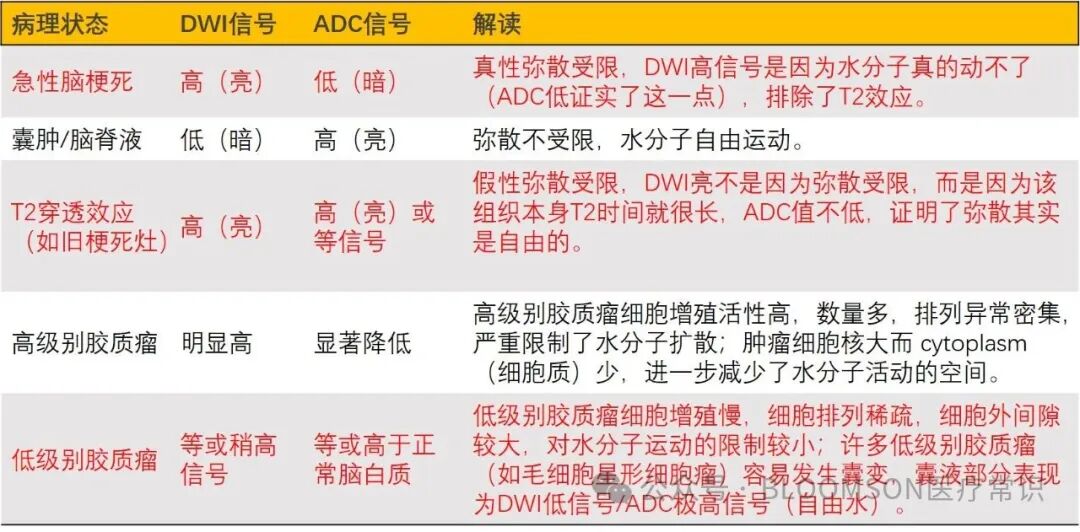
Summary: High DWI and low ADC indicate true restricted diffusion, visible in tumors; high DWI and high ADC indicate T2 penetration effect (false restriction), visible in old cerebral infarcts.
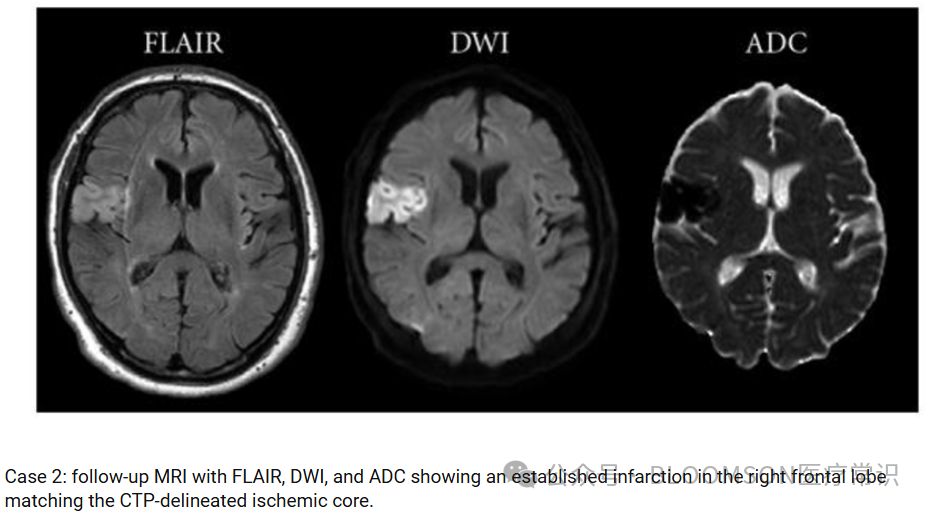
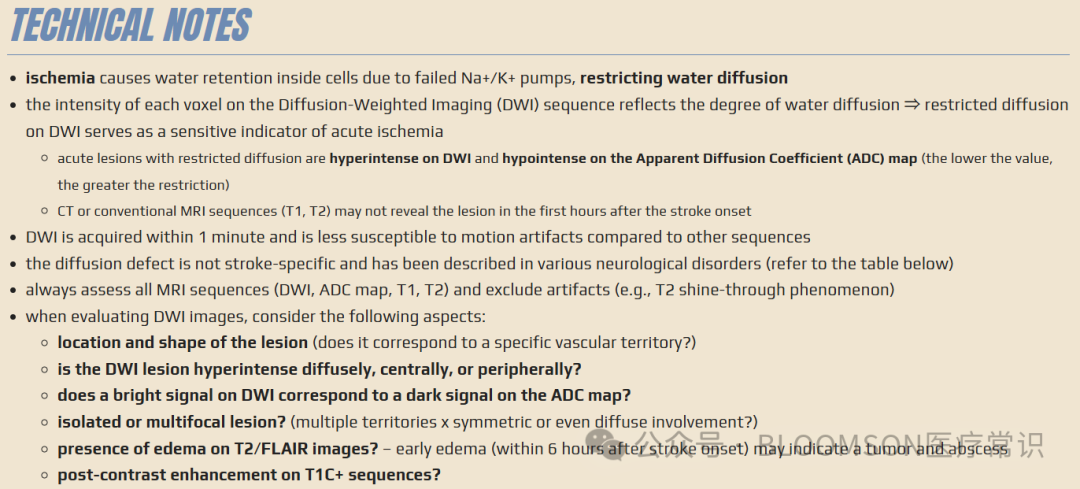
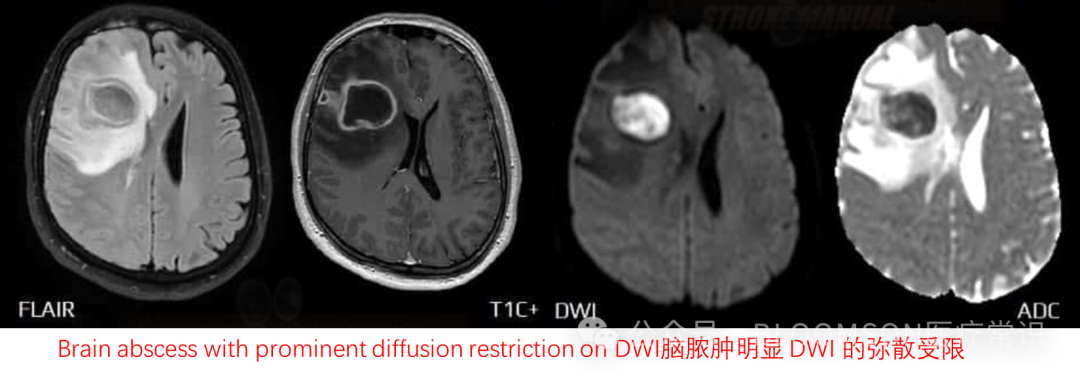
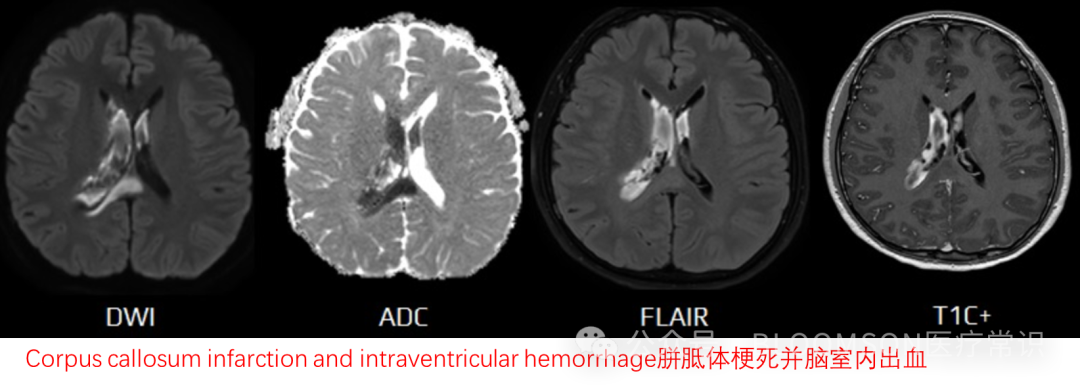
Diffusion-weighted imaging (DWI) is a commonly performed MRI sequence for the evaluation of acute ischemic stroke and is very sensitive in the detection of small and early infarcts. Conventional MRI sequences (T1WI, T2WI) may not demonstrate an infarct for 6 hours, and small infarcts may be hard to appreciate on CT for days, especially without the benefit of prior imaging.
Typical clinical scenarios are as follows:
-
Acute ischemic stroke, admitted 2 hours after onset
-
Conventional T2 images: may not show obvious abnormalities, or only very subtle changes.
-
DWI images: clearly show an abnormally high signal bright spot in a certain area of the patient’s brain (e.g., basal ganglia region).
-
ADC images: in the corresponding area of high signal on DWI, the ADC image shows a significantly low signal dark spot.
-
DWI high signal + ADC low signal indicates true restricted diffusion, strongly suggesting that the brain tissue in that area has undergone acute cytotoxic edema, which is clear evidence of hyperacute/acute cerebral infarction. DWI can detect lesions within minutes to hours after infarction, much more sensitively than CT and other MRI sequences.
-
Tumor diagnosis and differentiation, due to the dense packing of malignant tumor cells, extracellular space is small, water molecule diffusion is often restricted (high DWI, low ADC), while benign lesions or necrotic cystic areas have higher ADC values, which can be used to differentiate high-grade gliomas from low-grade gliomas, and qualitative assessment of breast cancer masses.
-
Abscess versus necrotic tumor differentiation, due to the viscous pus and numerous inflammatory cells within the abscess cavity, diffusion is severely restricted, resulting in very low ADC values, while the necrotic area of the tumor has higher ADC values.
Thanks to the following resources for the above content:
-
https://ukuxoxadjglibguide.z14.web.core.windows.net/mri-machine-schematic-diagram.html
-
https://www.sciencephoto.com/media/1304889/view/mri-brain-scans-comparing-t1-and-t2-weighted-imaging
-
https://mrimaster.com/t1-vs-t2-mri/
-
https://matlab1.com/diffusion-weighted-imaging/
-
https://www.mdpi.com/2072-6694/15/3/618
-
http://www.theevolutionofimagingtechnology.com/diffusion-weighted-imaging-dwi/
-
https://www.ahajournals.org/doi/10.1161/STROKEAHA.113.002135
-
https://www.stroke-manual.com/mri-dwi-in-stroke-diagnosis/
-
https://www.ahajournals.org/doi/10.1161/STROKEAHA.113.002135
-
https://www.researchgate.net/figure/Diffusion-weighted-imaging-DWI-A-and-apparent-diffusion-coefficient-ADC-imaging-B_fig3_331193535
-
https://www.researchgate.net/figure/Case-2-follow-up-MRI-with-FLAIR-DWI-and-ADC-showing-an-established-infarction-in-the_fig3_51156755
-
https://radiopaedia.org/articles/diffusion-weighted-imaging-in-acute-ischaemic-stroke?lang=us