Python
Implementation of Support Vector Machine (SVM) Model for Precipitation Prediction at Meteorological Stations Based on Random Search Parameter Optimization
Author: Xu Haoyuan, Eighth Galaxy
Email: [email protected]
Data Description
The data used in this article is the precipitation data from a meteorological station over the past 3 hours. It is not completely real data and is for demonstration purposes only.
Model Implementation
Due to the poor prediction performance of the SVM model without hyperparameter tuning on the station’s precipitation data, this article employs a SVM model with optimal parameters found through random search for precipitation prediction. The following is the code implementation:
# Import necessary libraries
import numpy as np
import pandas as pd
from sklearn.model_selection import train_test_split, RandomizedSearchCV
from sklearn.preprocessing import MinMaxScaler
from sklearn.svm import SVR
from sklearn.metrics import mean_squared_error, mean_absolute_error, r2_score
import matplotlib.pyplot as plt
from scipy.stats import uniform, randint

# Read data
file_path = '/home/xhy/station precipitation data example.xlsx'
data = pd.read_excel(file_path)

# Data processing
data.columns = data.columns.str.strip()
data['资料时间'] = pd.to_datetime(data['资料时间'])
data = data.sort_values(by='资料时间')

# Data smoothing (moving average)
data['过去3小时降水量'] = data['过去3小时降水量'].rolling(window=3).mean().fillna(method='bfill')

# Log transformation of the target variable
data['过去3小时降水量_log'] = np.log1p(data['过去3小时降水量'])

# Feature engineering (combining rolling statistics and lag features)
data['precipitation_rolling_mean_3'] = data['过去3小时降水量_log'].rolling(window=3).mean()
data['precipitation_rolling_std_3'] = data['过去3小时降水量_log'].rolling(window=3).std()
data['precipitation_rolling_mean_7'] = data['过去3小时降水量_log'].rolling(window=7).mean()
data['precipitation_rolling_std_7'] = data['过去3小时降水量_log'].rolling(window=7).std()
data['precipitation_lag_1'] = data['过去3小时降水量_log'].shift(1)
data['precipitation_lag_2'] = data['过去3小时降水量_log'].shift(2)
data['precipitation_lag_4'] = data['过去3小时降水量_log'].shift(4)
data['precipitation_lag_5'] = data['过去3小时降水量_log'].shift(5)

# Clean data
data = data.dropna()

# Select features and target
features = ['precipitation_rolling_mean_3', 'precipitation_rolling_std_3',
            'precipitation_rolling_mean_7', 'precipitation_rolling_std_7',
            'precipitation_lag_1', 'precipitation_lag_2', 'precipitation_lag_4', 'precipitation_lag_5']
X = data[features].values
y = data['过去3小时降水量_log'].values

# Data normalization
scaler_X = MinMaxScaler()
scaler_y = MinMaxScaler()
X = scaler_X.fit_transform(X)
y = scaler_y.fit_transform(y.reshape(-1, 1)).flatten()

# Data splitting
X_train, X_test, y_train, y_test = train_test_split(X, y, test_size=0.3, random_state=42, shuffle=False)

# Initialize SVM model
svm_model = SVR()

# Define parameter distribution
param_dist = {
    'C': uniform(1, 1000),
    'gamma': uniform(0.001, 0.1),
    'epsilon': uniform(0.01, 0.5),
    'kernel': ['rbf', 'poly', 'sigmoid']}

# Random search
random_search = RandomizedSearchCV(svm_model, param_distributions=param_dist, n_iter=50, cv=5, random_state=42, scoring='neg_mean_squared_error')
random_search.fit(X_train, y_train)

# Output best parameters
print("Best Parameters:", random_search.best_params_)

# Train model with best parameters
best_svm_model = random_search.best_estimator_
best_svm_model.fit(X_train, y_train)

# Prediction
y_pred = best_svm_model.predict(X_test)

# Inverse normalization and log transformation
y_pred = np.expm1(scaler_y.inverse_transform(y_pred.reshape(-1, 1)).flatten())
y_test = np.expm1(scaler_y.inverse_transform(y_test.reshape(-1, 1)).flatten())

# Evaluate model
mse = mean_squared_error(y_test, y_pred)
mae = mean_absolute_error(y_test, y_pred)
r2 = r2_score(y_test, y_pred)
rmse = np.sqrt(mse)
print(f'R^2: {r2}, MSE: {mse}, RMSE: {rmse}, MAE: {mae}')

# Visualization
timestamps_test = data['资料时间'].iloc[X_test.shape[0] * -1:]
plt.figure(figsize=(14, 7))
plt.plot(timestamps_test, y_test, label='True Precipitation', color='blue', marker='o')
plt.plot(timestamps_test, y_pred, label='Predicted Precipitation (SVM)', color='red', marker='x')
plt.title('SVM: True vs Predicted Precipitation')
plt.xlabel('Time')
plt.ylabel('Precipitation')
plt.legend()
plt.grid(True)
plt.xticks(rotation=45)
plt.show()
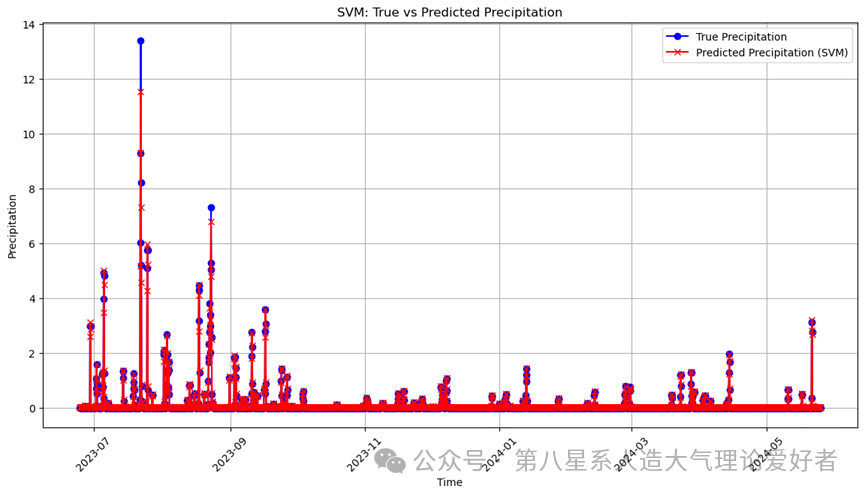
Results Display
Best Parameters: {‘C’: 8.066305219717407, ‘epsilon’: 0.02153121252070788, ‘gamma’: 0.053477466025838916, ‘kernel’: ‘sigmoid’}
R2: 0.9900674184355446
MSE: 0.0036162195436601255
RMSE: 0.06013501096416401
MAE: 0.028928425508511633
– END –
Private message in the background:Eighth Galaxy
Daily updates and data sharing in the group
Reply in the group with Eighth Galaxy
Editor: Eva