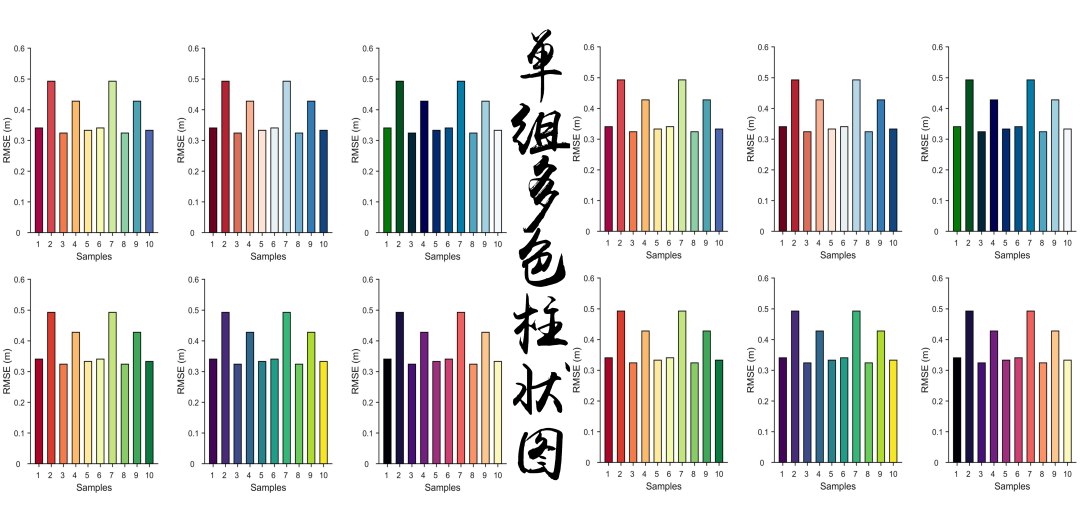
In previous articles, we shared methods for creating single group bar charts (Matlab Paper Illustration Drawing Template – Bar Chart (Single Group Multi-color)):
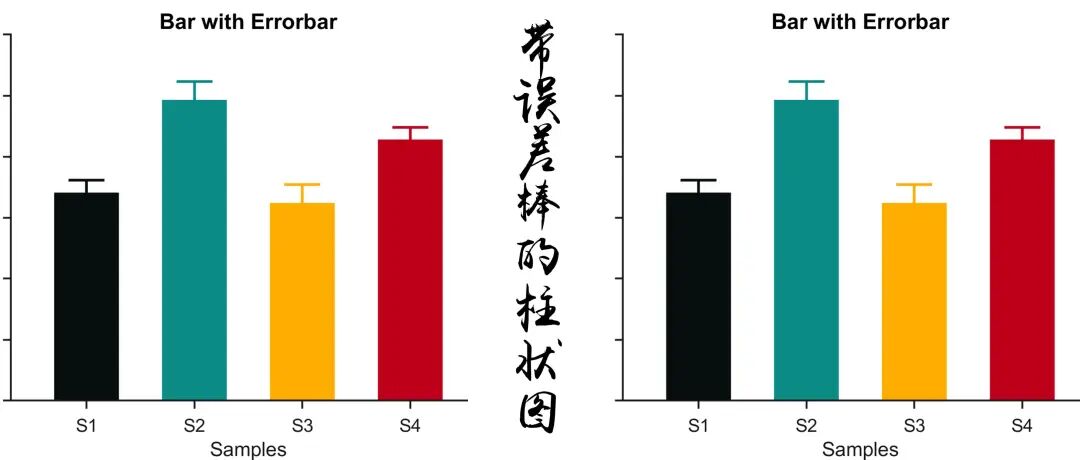
Single group bar chart with error bars (Matlab Paper Illustration Drawing Template Issue 70 – Bar Chart with Error Bars):
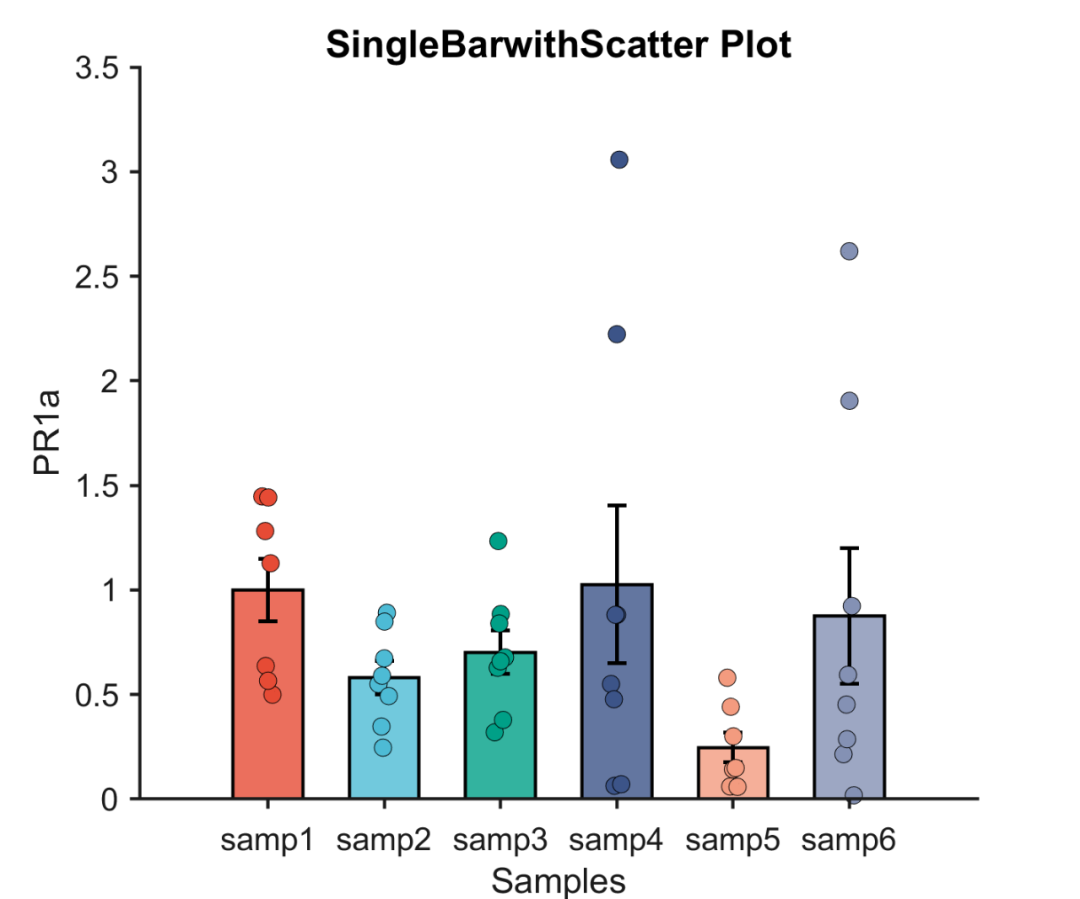
Bar chart with jitter points (Advanced Matlab Plotting Issue 88 – Bar Chart with Jitter Points):
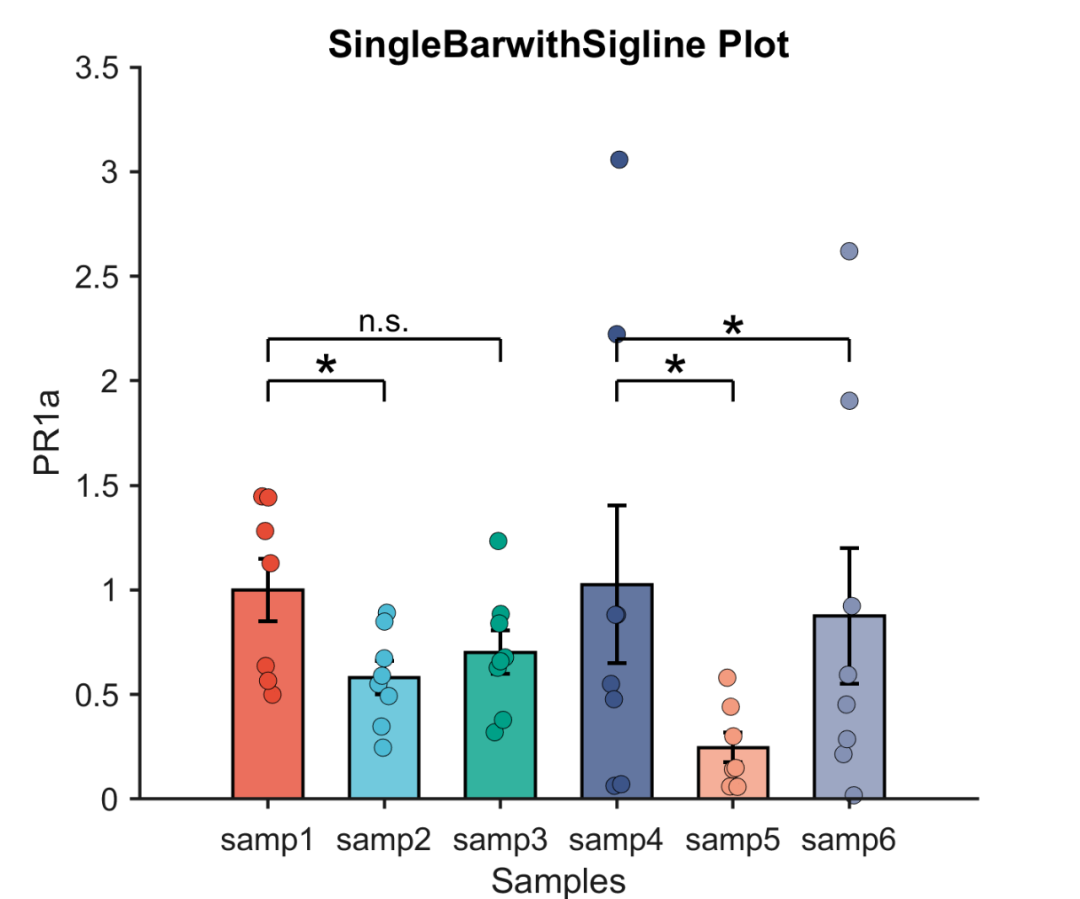
Next, we will share how to create a single group bar chart with significance markers.
First, let’s take a look at the final result:
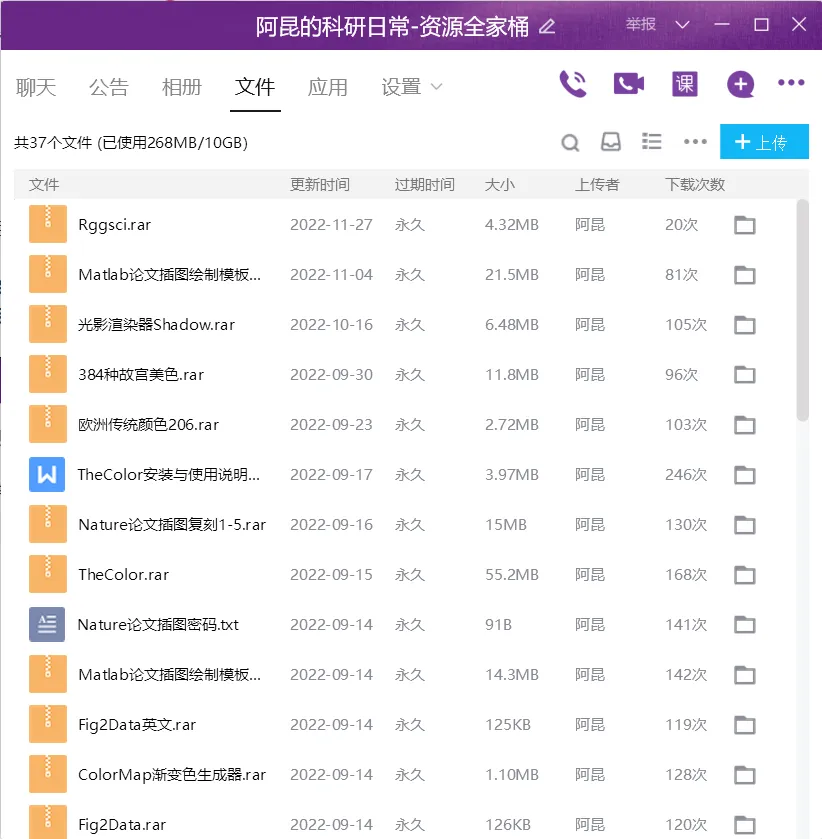
Special Note: The content of this issue, ‘Data + Code’, has been uploaded to the resource group. Friends who join the group can download it themselves. If you need it, you can follow the public account with the same name 【Akun’s Research Daily】 and reply with the keyword 【Full Package】 to see how to join.
1. Data Preparation
This part mainly involvesreading the raw data.
% Load data
load data.mat
2. Color Definition
Creating plots without color is like cooking without salt; it always feels like something is missing.
However, color matching tests personal aesthetics and requires more experimentation.
Here, wedirectly use the SCI authoritative color library from TheColor color matching tool:
C = TheColor('sci',500);

(Click the image above to view TheColor’s specific functions)
Access method: Public account (Akun’s Research Daily) reply TC
3. Drawing Single Group Bar Chart with Significance Markers
Call the ‘bar’, ‘errorbar’, ‘sigline’, and ‘swarmchart’ functions to draw the initial single group bar chart with significance markers.
% Draw initial bar chart
GO = bar(xx,yy,0.6,'EdgeColor','k','FaceAlpha',0.8,'LineWidth',1);
hold on
% Color the bar chart
GO.FaceColor = 'flat';
for i = 1:6
    GO.CData(i,:) = C(i,:);
end
% Add error bars
[M,N] = size(yy);
xpos = xx;
hE = errorbar(xpos, yy, ee);
% Error bar properties
set(hE, 'LineStyle', 'none', 'Color', 'k', 'LineWidth', 1.2)
% Add jitter points
jitter = 0.1;
flag = 1;
for j = 1:size(xpos,2)
    xx0 = xpos(1,j);
    xx00 = xx0*ones(1,size(Y,2));
    yyj = Y(flag,:);
    s(j) = swarmchart(xx00,yyj,30,C(j,:),'filled','MarkerEdgeColor','k','LineWidth',0.2,'XJitter','rand','XJitterWidth',0.1);
    flag = flag + 1;
end
% Add significance markers
% Coordinates for significance difference lines
a1 = xpos(1,1);
a2 = xpos(1,2);
b1 = xpos(1,1);
b2 = xpos(1,3);
c1 = xpos(1,4);
c2 = xpos(1,5);
d1 = xpos(1,4);
d2 = xpos(1,6);
% Draw significance differences
sigline([a1,a2],2, '*',20);
sigline([b1,b2],2.2, 'n.s.',10);
sigline([c1,c2],2, '*',20);
sigline([d1,d2],2.2, '*',20);
hTitle = title('SingleBarwithSigline Plot');
hXLabel = xlabel('Samples');
hYLabel = ylabel('PR1a');
4. Detail Optimization
To enhance the aesthetics of the illustration, beautify the axis details, and after setting, output the image at the required resolution and format for the journal.
%% Detail Optimization
% Adjust coordinate area
set(gca, 'Box', 'off', ...                                    % Border
    'LineWidth',1,...                                         % Axis line width
    'XGrid', 'off', 'YGrid', 'off', ...                       % Grid
    'TickDir', 'out', 'TickLength', [.01 .01], ...            % Scale
    'XMinorTick', 'off', 'YMinorTick', 'off', ...             % Minor scale
    'XColor', [.1 .1 .1],  'YColor', [.1 .1 .1])              % Axis color
% Adjust axis ticks
set(gca, 'YTick', 0:0.5:3.5,...
    'Ylim' , [0 3.5], ...
    'xtick',1:6,...
    'Xticklabel',{'samp1' 'samp2' 'samp3' 'samp4' 'samp5' 'samp6'})
% Font and size
set(gca, 'FontName', 'Arial', 'FontSize', 10)
set([hXLabel, hYLabel], 'FontSize', 11, 'FontName', 'Arial')
set(hTitle, 'FontSize', 12, 'FontWeight' , 'bold')
% Background color
set(gcf,'Color',[1 1 1])
%% Image Output
figW = figureWidth;
figH = figureHeight;
set(figureHandle,'PaperUnits',figureUnits);
set(figureHandle,'PaperPosition',[0 0 figW figH]);
fileout = 'test';
print(figureHandle,[fileout,'.png'],'-r300','-dpng');
That’s all.
5. Full Package
The 【Data + Code】 for the single group bar chart with significance markers in Matlab has been added to the full package (Group Announcement -> Advanced Plotting).
The full package plan refers to uploading all related resources released in the past and future to a group, allowing everyone who joins the full package plan to download all resources in the group anytime, anywhere.
Included in the full package are the Matlab plotting tutorial series,
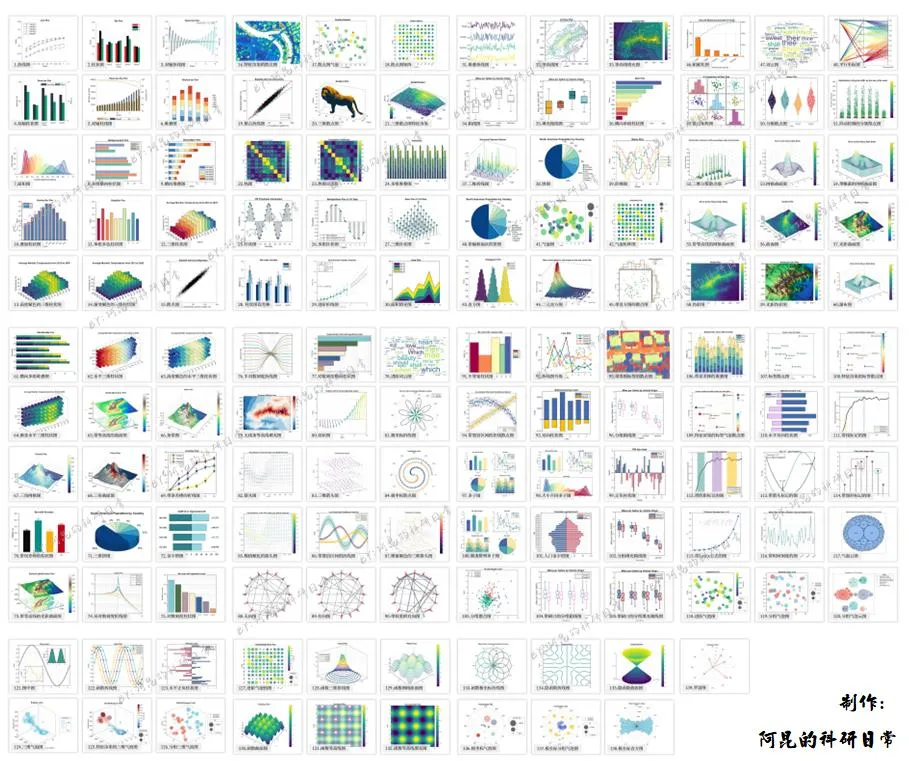
Matlab Paper Illustration Drawing Template series (completed, includes 3 versions of 139 classic data charts, reply with the keyword 【139】 to see the individual acquisition method):
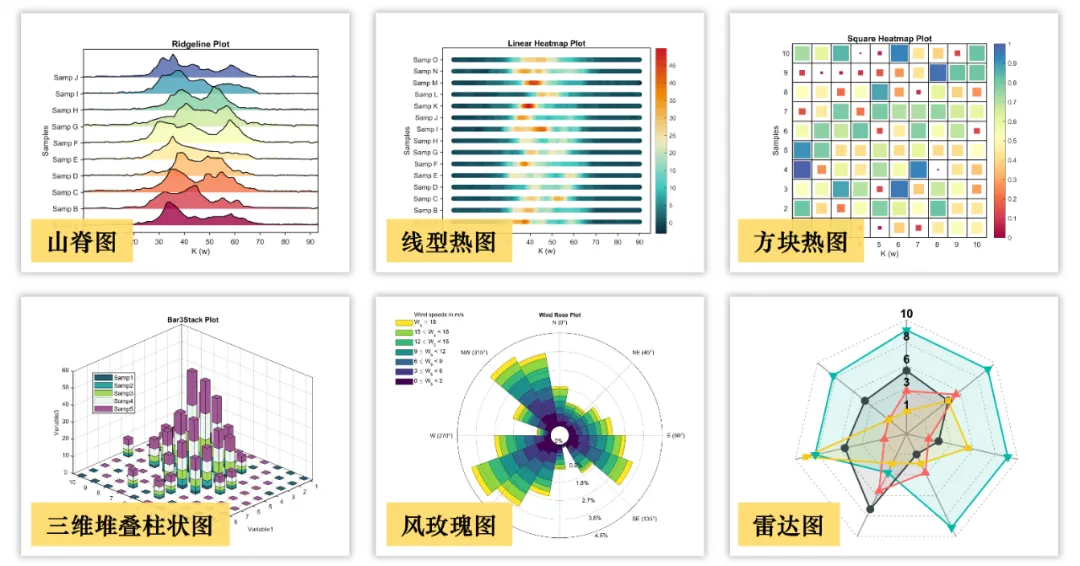
Matlab Advanced Plotting series (complex plotting beyond Matlab’s default plotting, currently includes 89 classic data charts):
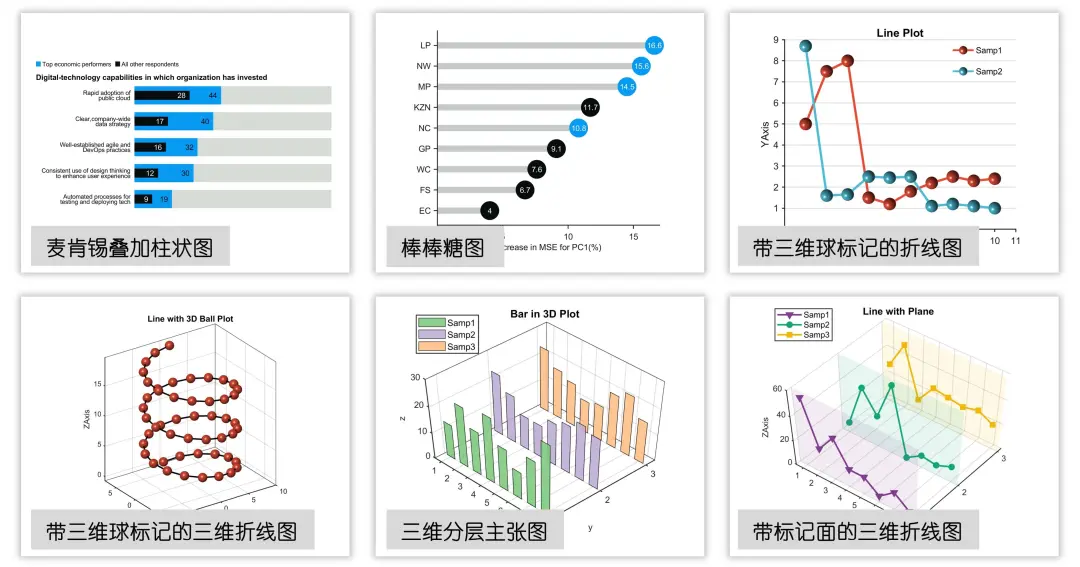
Matlab Personalized Plotting series (diversified style plotting, currently includes 24 types of data charts):
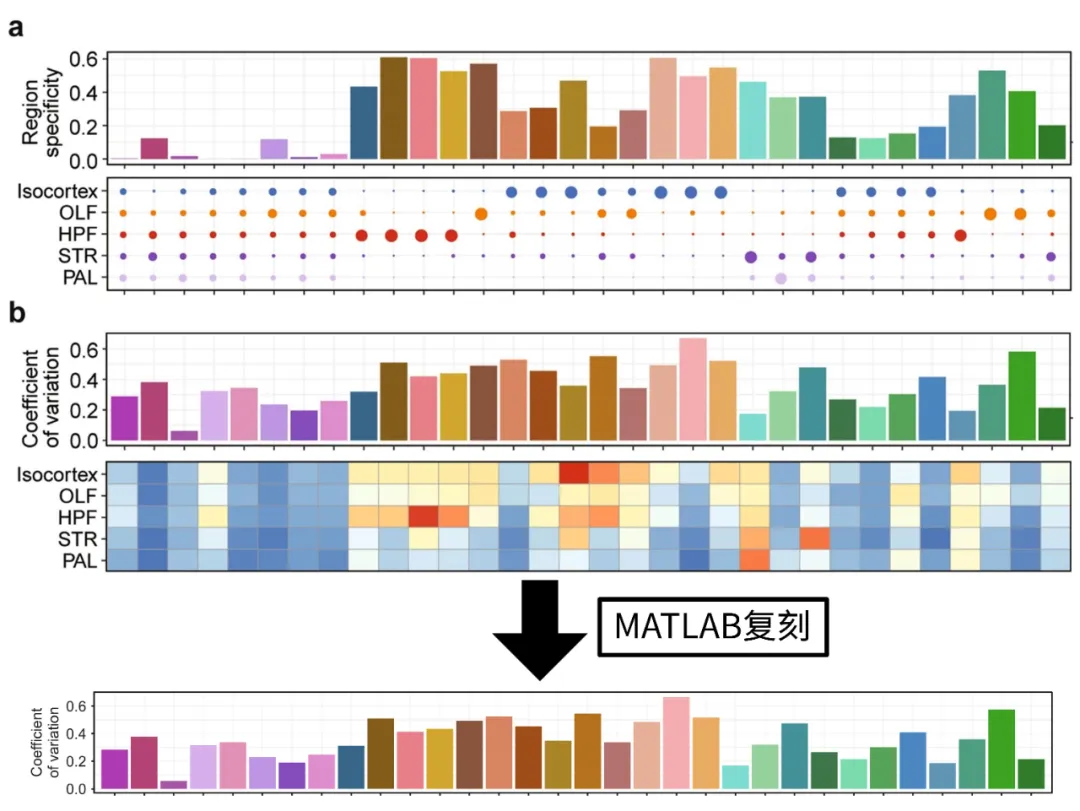
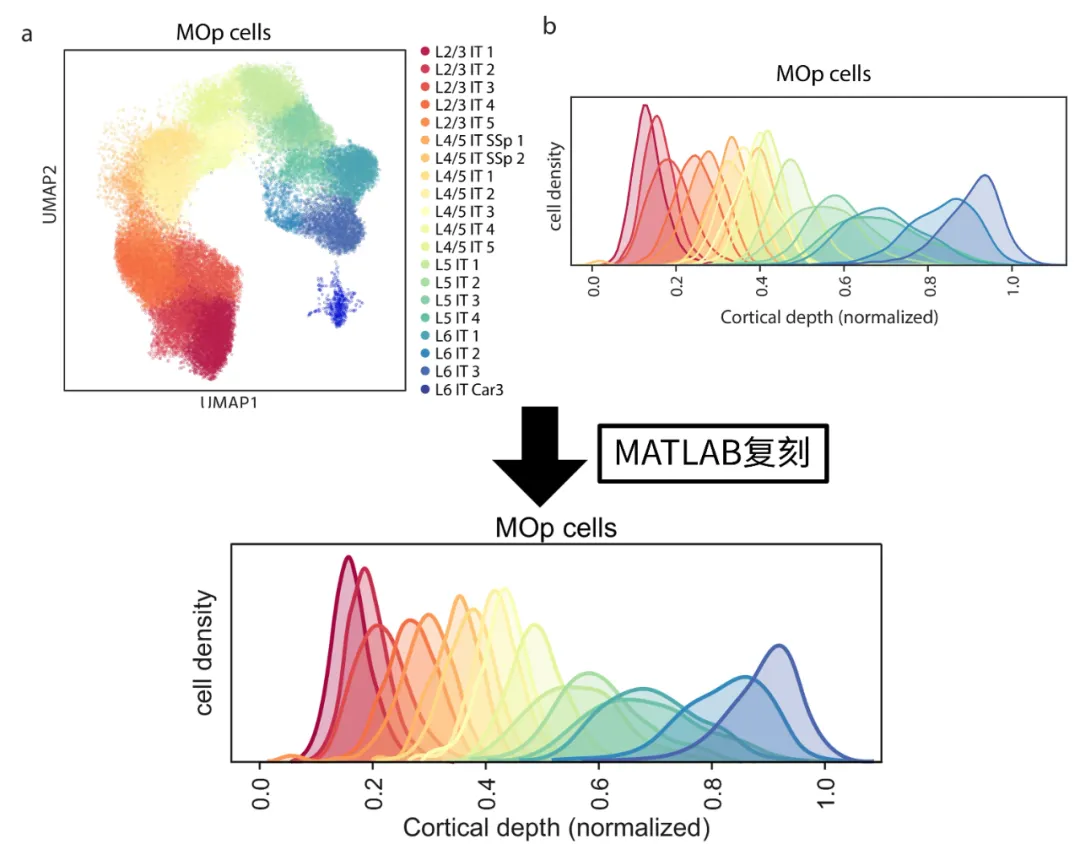
Nature/Science Paper Illustration Replication series (to achieve top journal illustration effects, currently includes 5 types of data charts):
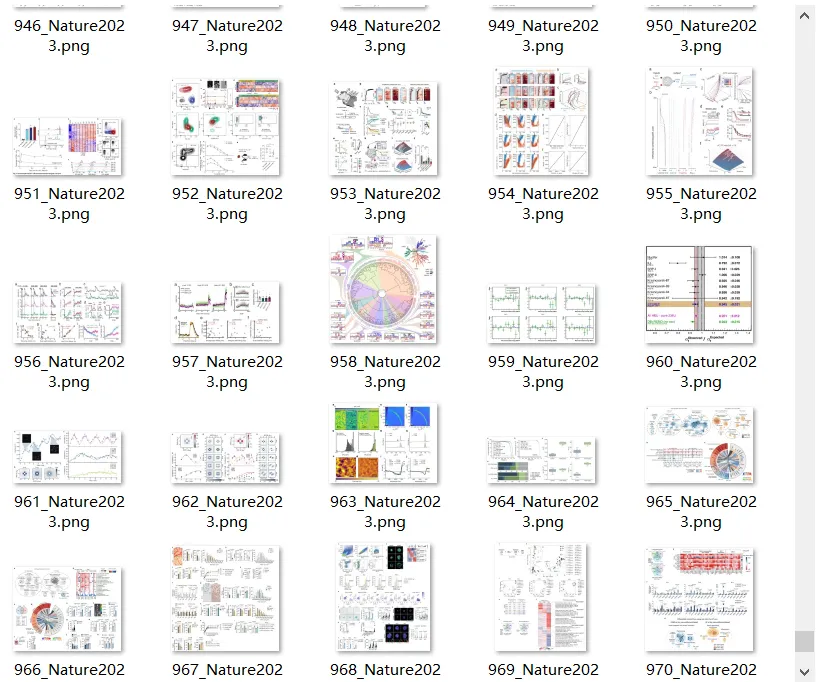
High-Resolution Image Collection series for Top Journals, including Nature high-resolution collection (learning Nature’s plotting ideas, includes around 2400 images):
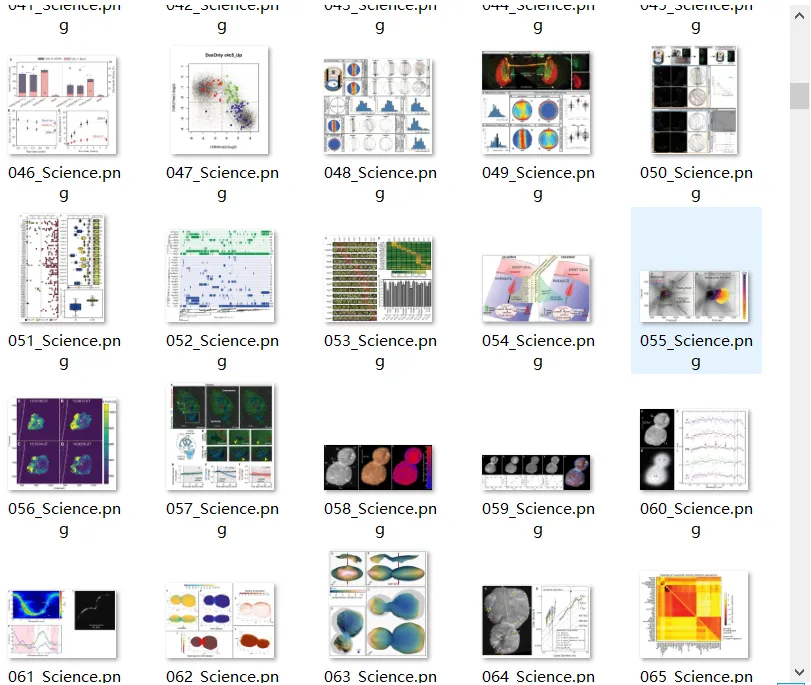
Science high-resolution collection (learning Science’s plotting ideas, over 1000 images):
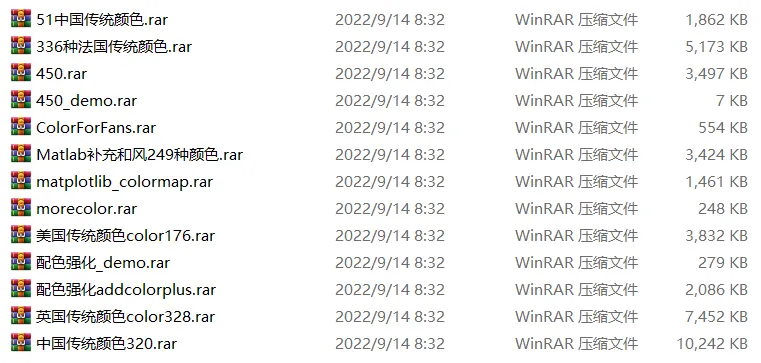
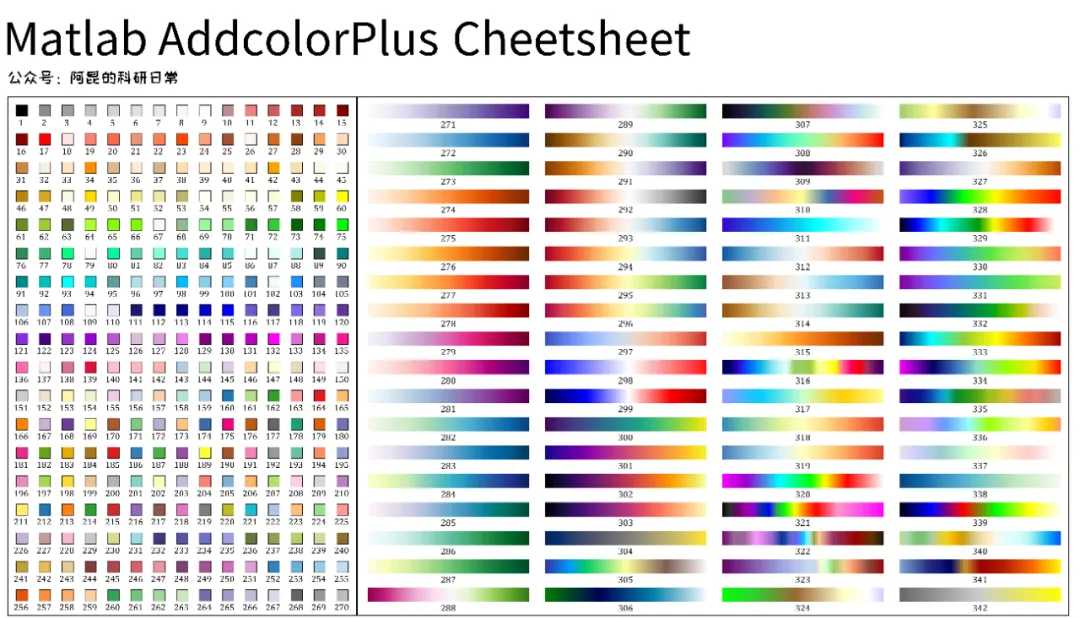
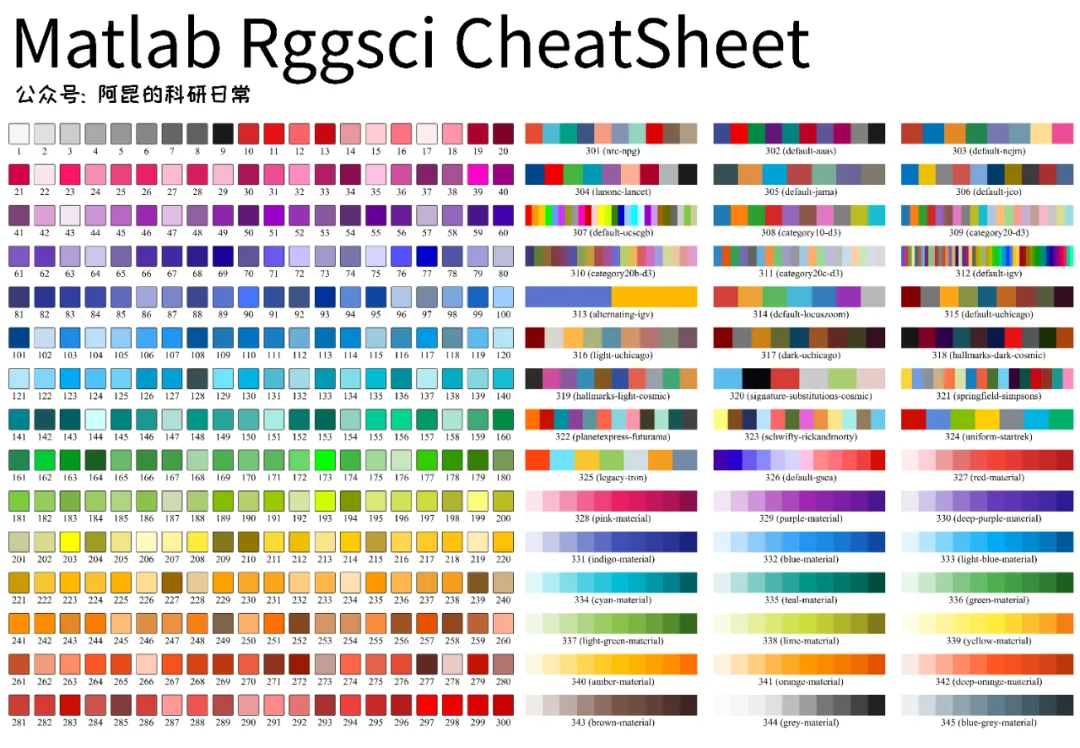
Matlab Color Supplement Package series (including color enhancement addcolorplus, 450 common colors colorplus, SCI dedicated color tool Rggsci, art color package Metbrewer, and traditional colors from China, Japan, the USA, the UK, and France):
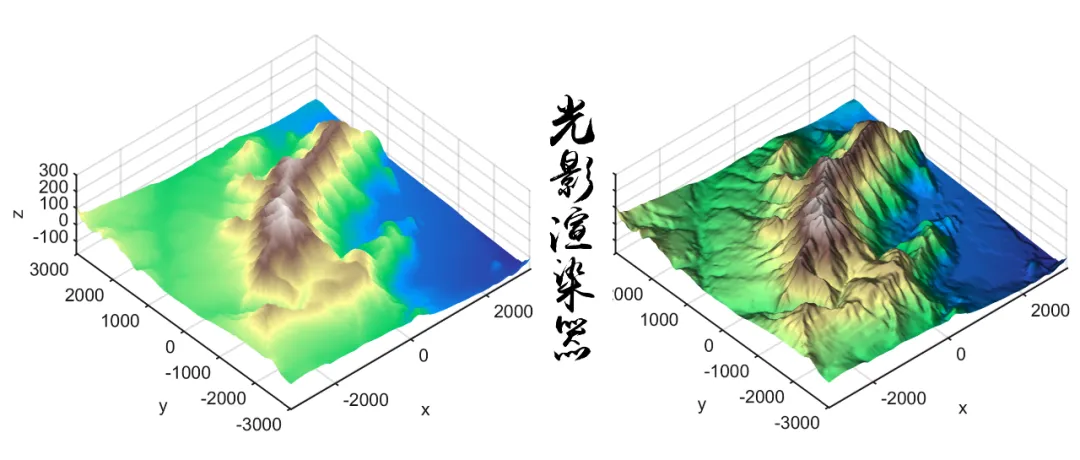
Matlab Research Plotting Premium Toolkit (including gradient color generator/editor ColorMap, professional version of gradient color generator ColorMapPro, shadow renderer Shadow, top journal color copy tool ColorCopy, and image data extraction tool Fig2Data):


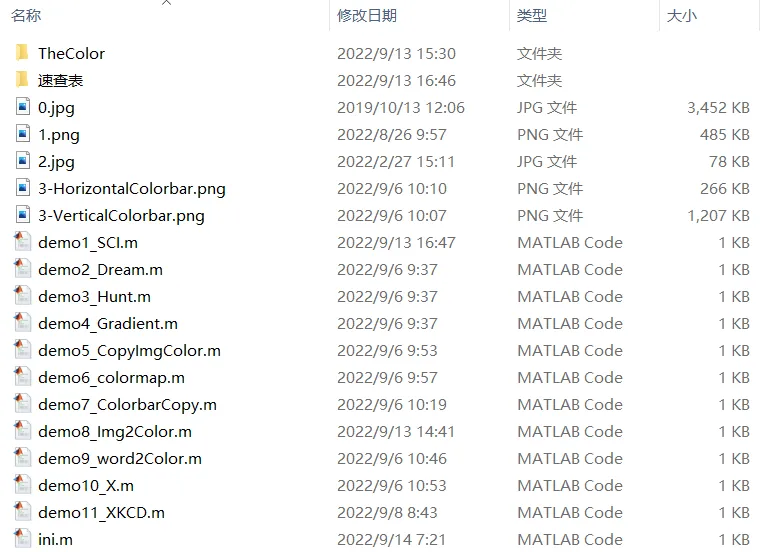
and the ultimate Matlab color tool TheColor (2 sets):

Reply with the keyword 【Full Package】 in the public account to see how to join.
That’s all.
If you find my sharing helpful, feel free to like, view, and share. Of course, donations are also welcome. The more interaction, the faster the updates~
Disclaimer: All original content of this public account may not be used for any commercial purposes without permission, and violators will be prosecuted.