The author previously introduced the Microsoft certificate vulnerability CVE-2020-0601, explaining the ECC algorithm and Windows verification mechanism, and reproducing an example of executable file signature certificates. This article will detail the basic usage of the reverse analysis tool OllyDbg for dynamic debugging, including interface introduction, commonly used shortcuts, and a case analysis of TraceMe.
These foundational knowledge points are not only related to system security but also closely linked to the software, documents, and operating systems we commonly use. I hope this knowledge is helpful to you, and even more so, I hope everyone can enhance their security awareness, as the journey to ensure safety is long and arduous. This article references materials from Bilibili’s vulnerability bank, security websites, and literature, combined with my own experience and practice. I would like to thank these experts.
Article Directory:
-
1. OllyDbg Interface Introduction and Configuration
-
2. Common Shortcuts
-
3. OllyDbg Dynamic Cracking Software Demonstration
-
4. Summary
Since July 2019, I have entered an unfamiliar field—cyberspace security. Entering the security field is very painful and difficult, as there is so much to learn and the scope is so broad. However, I have managed to share 100 articles in the “Self-study in Cybersecurity” series, trudging along. I am grateful for this year of acquaintance, understanding, and interest with security experts and friends. If my writing is poor or lacking, please bear with me! Next, I will start a new security series called “System Security”, which will also consist of 100 free articles. I will delve deeper into malicious sample analysis, reverse analysis, internal network penetration, and practical network offense and defense, and will share my learning with fellow bloggers through online notes and practical operations. I hope to progress together with you, let’s go!~
Recommended previous article: Self-study in Cybersecurity Series – 100 Articles
https://blog.csdn.net/eastmount/category_9183790.htm
Author’s GitHub Resources:
-
Reverse Analysis: https://github.com/eastmountyxz/
SystemSecurity-ReverseAnalysis
-
Network Security: https://github.com/eastmountyxz/
NetworkSecuritySelf-study
Statement: I firmly oppose the use of teaching methods for criminal acts. All criminal acts will be severely punished. A green network needs our joint maintenance. I also recommend everyone to understand the principles behind them to better protect themselves. This sample will not be shared with everyone, but the analysis tools will be shared. (References are noted later)
1. OllyDbg Interface Introduction and Configuration
OllyDbg is a dynamic tracing tool that combines the ideas of IDA and SoftICE, a Ring 3 level debugger that is very easy to use, and is one of the most popular debugging and decryption tools today. It also supports plugin extension functions and is one of the most powerful debugging tools available.
OD and IDA can be said to be the “Heavenly Sword” and “Dragon-slaying Saber” of reverse analysis, one for dynamic analysis and the other for static analysis.

This series of articles references videos from Bilibili’s vulnerability “Game Reverse Communication” experts, mainly covering:
-
OllyDbg Interface Introduction and Configuration
-
Common Shortcuts
-
Basic Operations of OllyDbg
-
Common Breakpoint INT 3 Principle Analysis
-
Anti-debugging and Anti-anti-debugging of INT 3 Breakpoints
-
Common Breakpoint Hardware Principle Analysis
-
Common Breakpoint Memory Principle Analysis
-
Common Breakpoint Message Principle Analysis
-
Common Breakpoint Conditional Principle Analysis
-
One-time Memory Access Breakpoint and Conditional Record Breakpoint
-
Plugins
-
Run trace and Hit trace
-
Debugging Symbols
-
Common Issues in OllyDbg
I recommend everyone to study, reference URL:
-
https://www.bilibili.com/video/BV1cE411f7sE
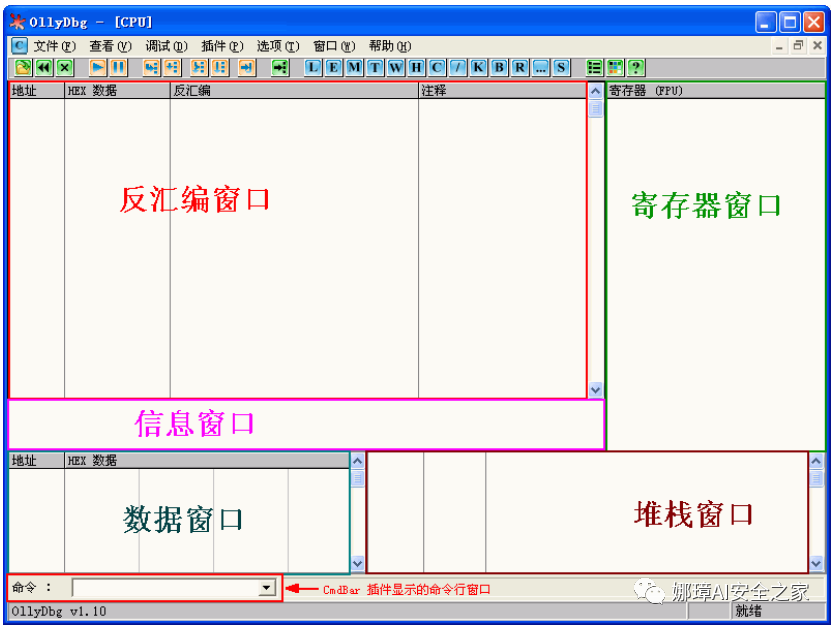
OllyDbg is a commonly used debugging tool for reverse analysis. The main interface is shown in the following figure, including disassembly window, register window, information window, data window, and stack window.
-
Common Dynamic Debugging Tools: OllyDbg, WinDbg, x64Dbg
-
Common Static Debugging Tool: IDA
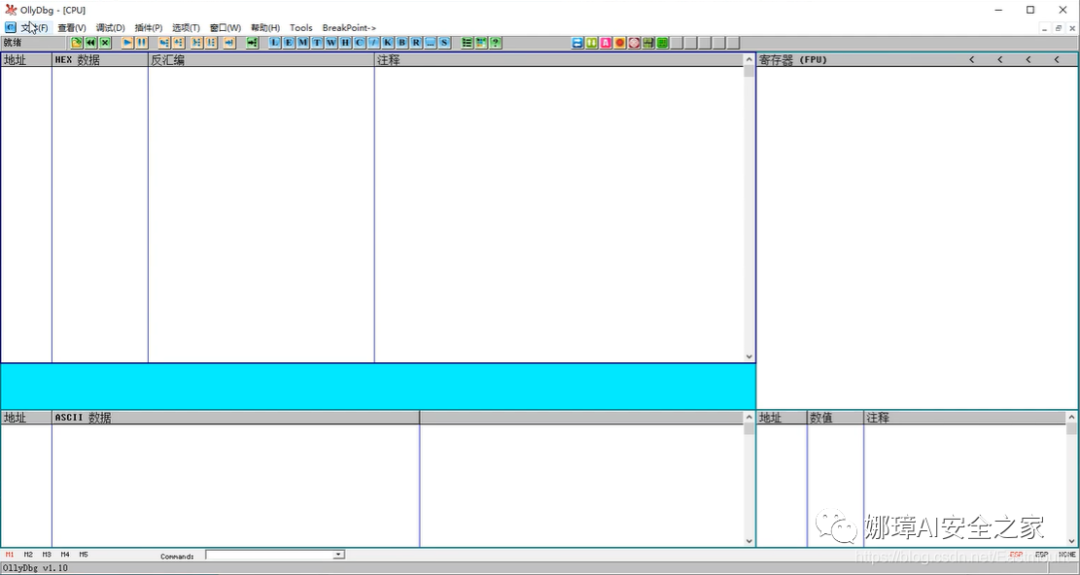
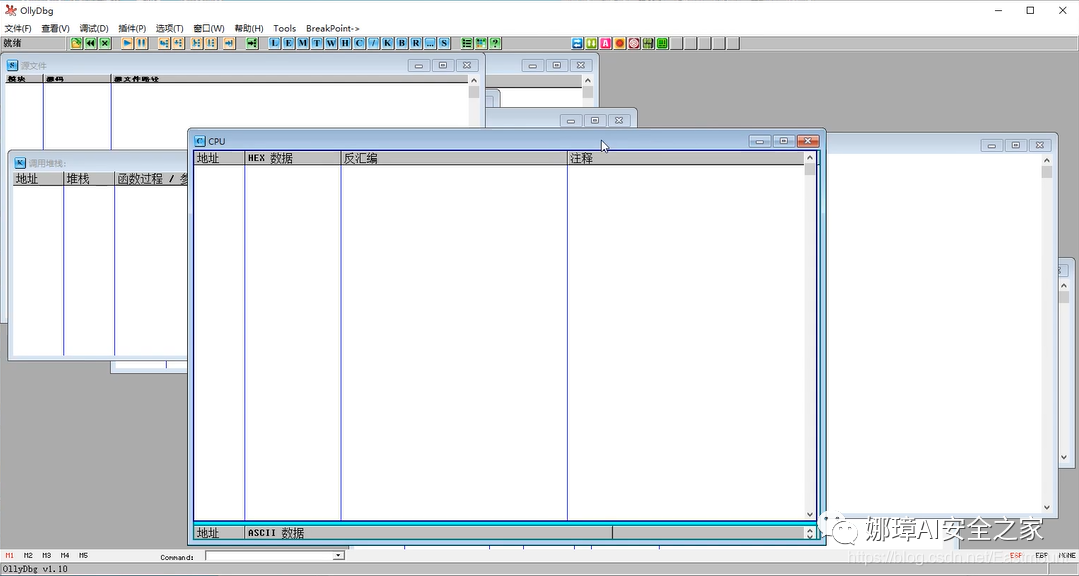
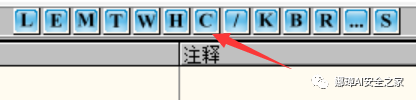
If the interface we opened looks messy as shown below, we can click the top shortcut key C, and then maximize the main window to optimize the layout.
Next, open any EXE program, as shown in the following figure:
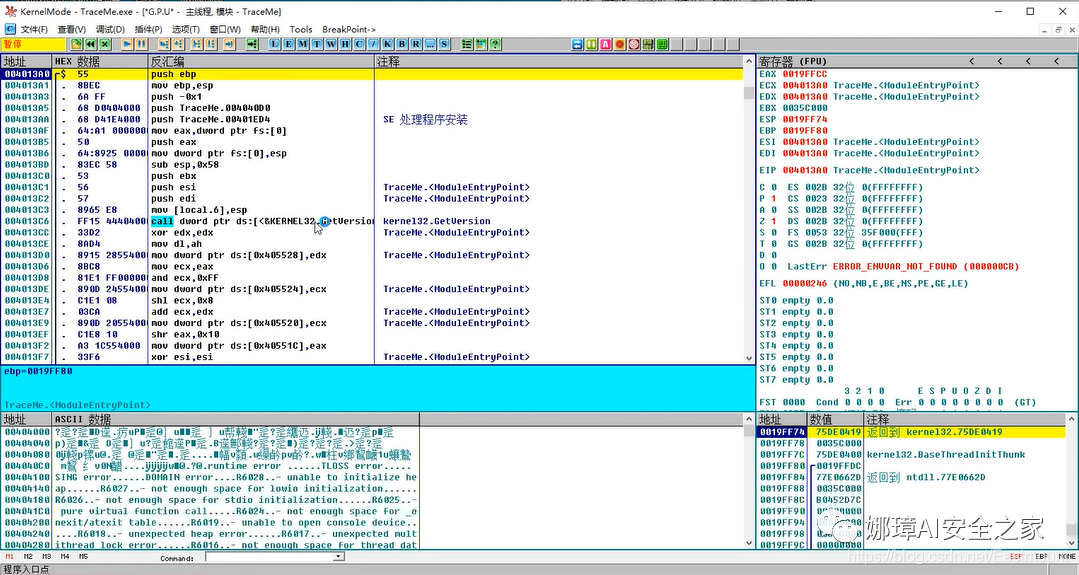
Now let’s explain the meaning of each window:
-
Disassembly Window: Displays the disassembled code of the debugged program, including address, HEX data, disassembly, and comments.
-
Register Window: Displays the CPU register contents of the currently selected thread. Click the tab to switch the display method of the registers.
-
Information Window: Displays the parameters and jump target addresses of the first command selected in the disassembly window, characters, etc.
-
Data Window: Displays the contents of memory or files; the right-click menu can switch the display method.
-
Stack Window: Displays the stack of the current thread, recording passed parameters or local variables.
-
Sub-window Shortcuts
Next, supplement the knowledge points of the interface options, click “Options” -> “Interface”, set the UDD path and plugin path.
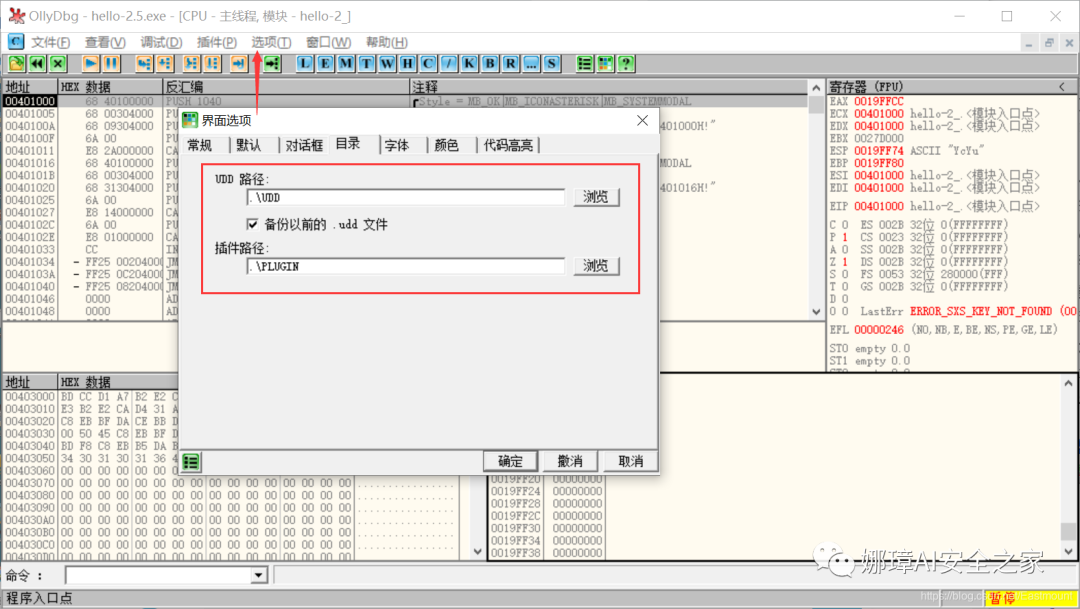
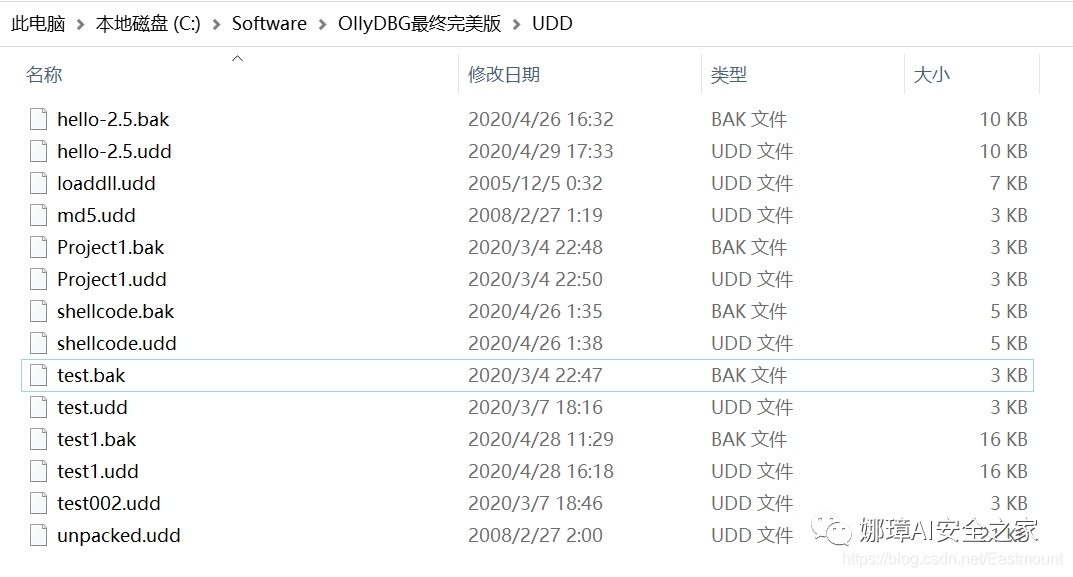
The UDD path is used to save our debugging information.
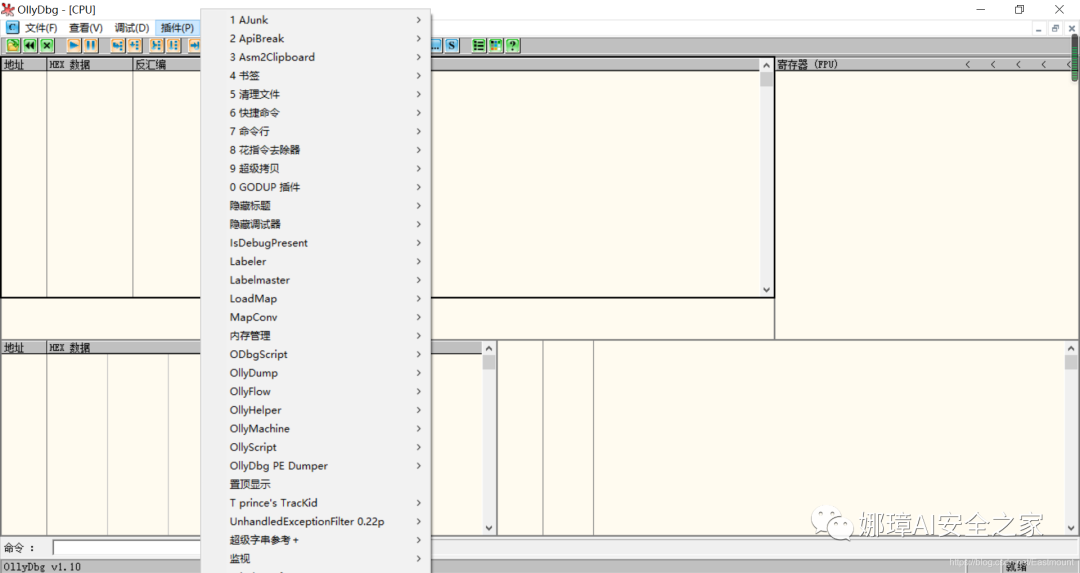
The plugin path contains various plugins and can be used directly.
If you want to select an EXE file that can be opened directly with OllyDbg by right-clicking, how do you set it?
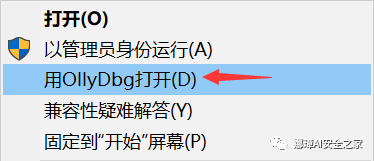
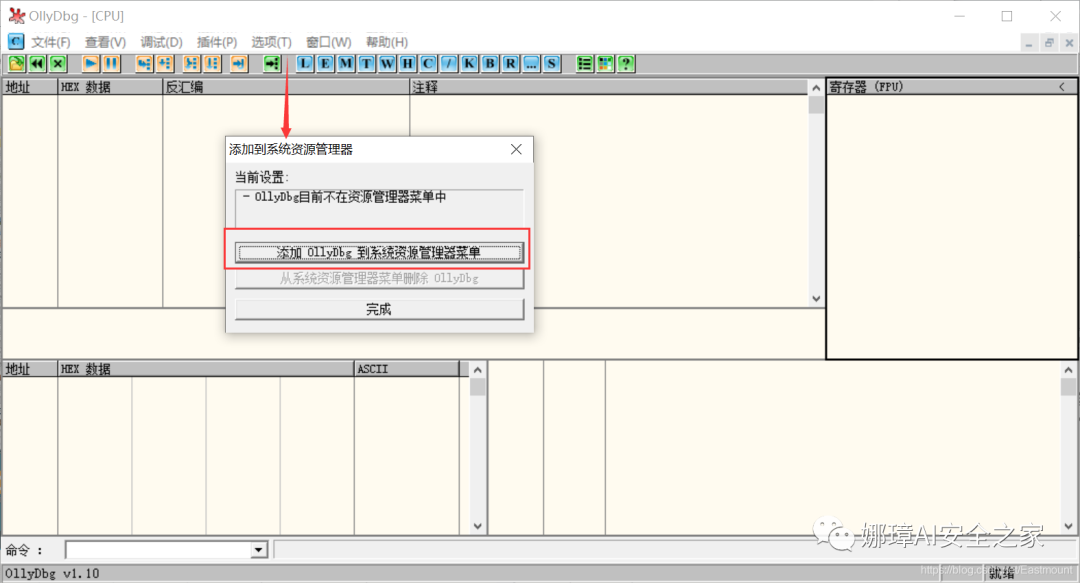
Click “Options” -> “Add to Browser” to add OllyDbg to the system resource manager menu.
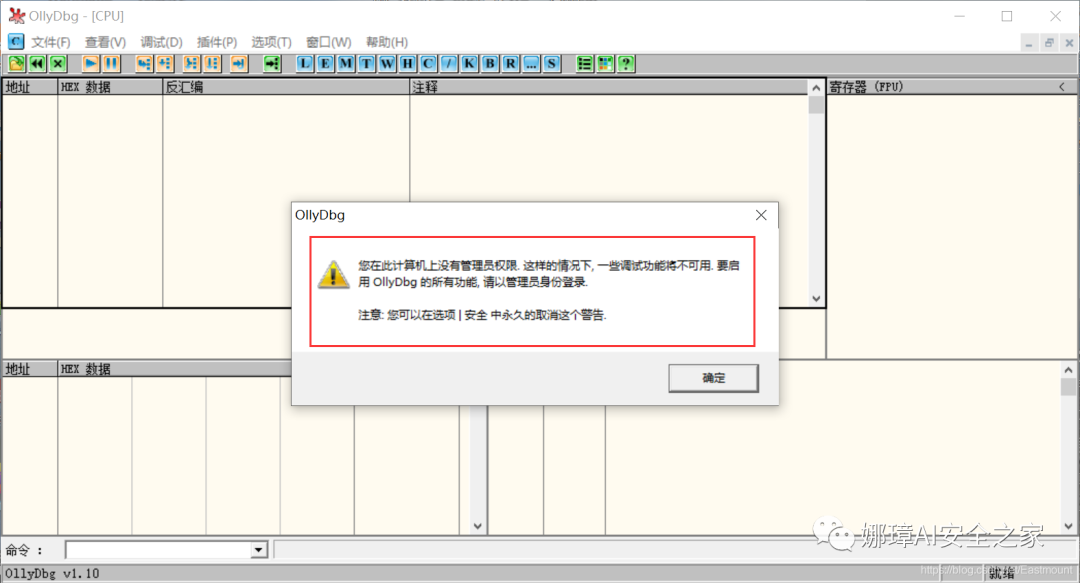
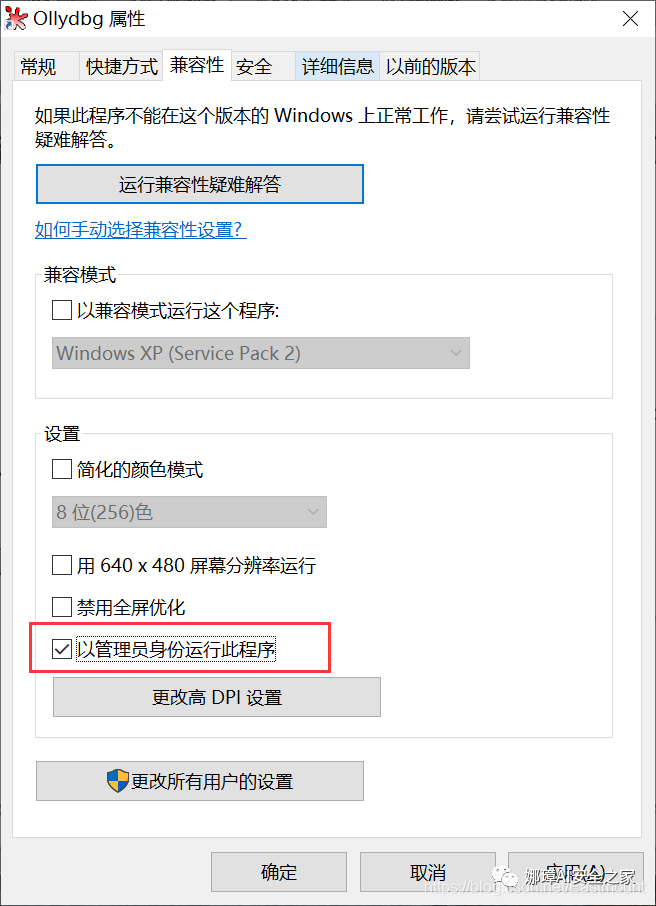
If we get prompted for administrator privileges every time we run OD, we can set a simple shortcut key.
The setting method is as follows: select “Run this program as an administrator” in compatibility.
2. Common Shortcuts
Next, let’s briefly explain the common shortcut debugging methods.
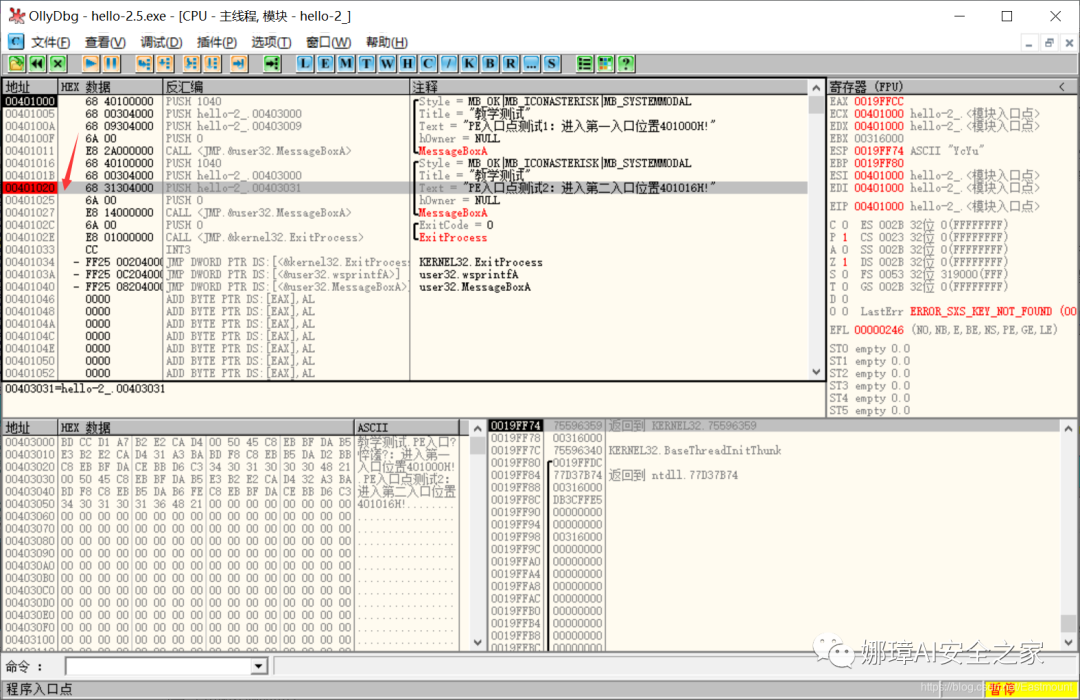
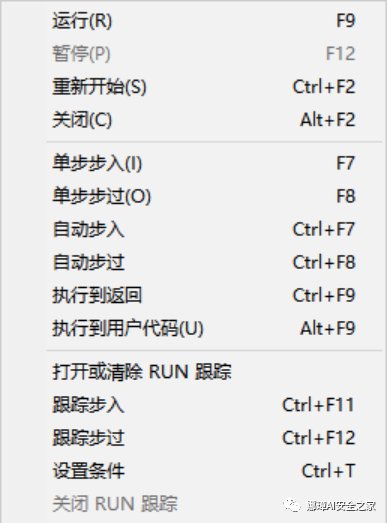
F2: Set Breakpoint Set a breakpoint by pressing the F2 key at the position where the cursor is located. Pressing F2 again will remove the breakpoint. As shown in the red position in the figure below, the program will pause when it reaches this point.
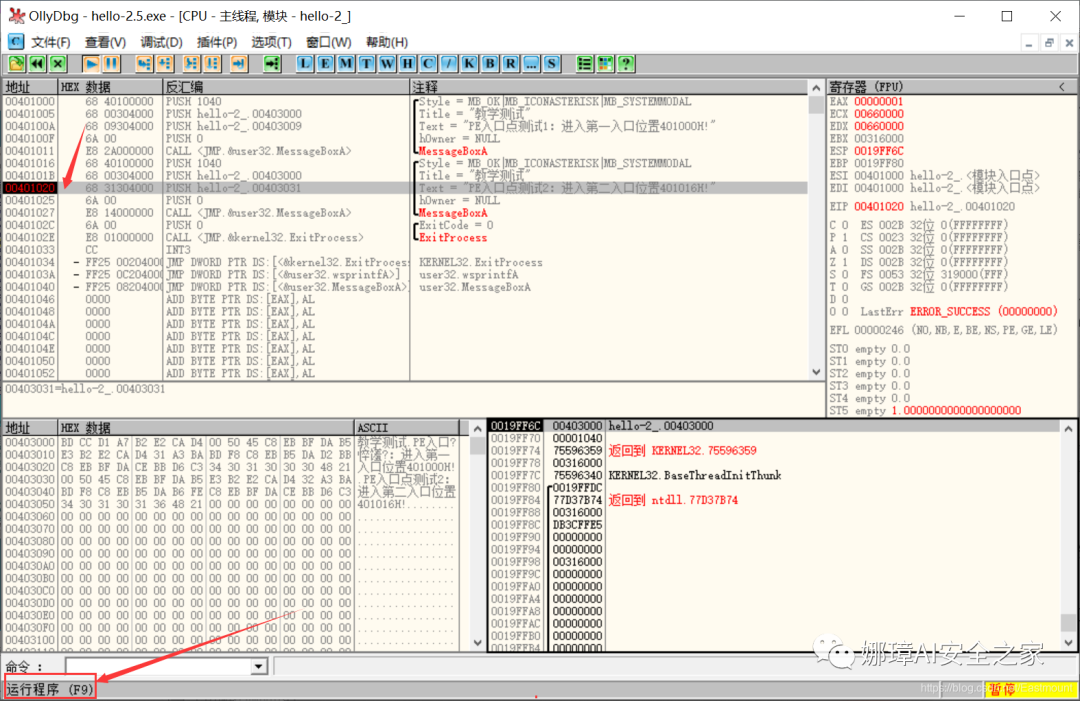
F9: Run Pressing the F9 key will run the program. If no corresponding breakpoints are set, the debugged program will start running directly.
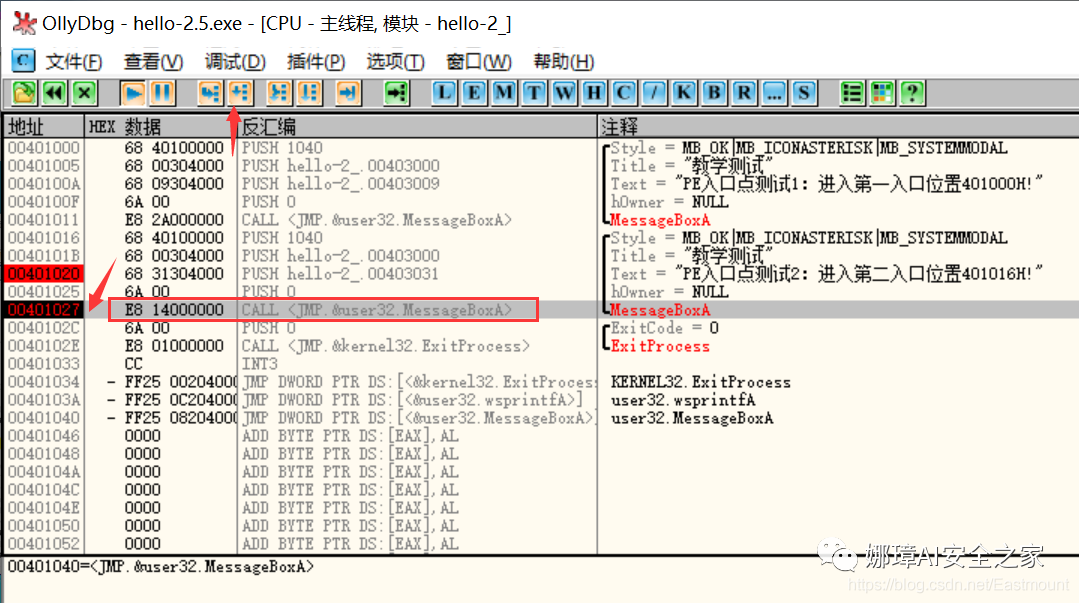
F8: Step Over Each time this key is pressed, it will execute one instruction in the disassembly window, but will not enter the code of subroutines like CALL.
F7: Step Into The function is similar to Step Over (F8), but the difference is that it will enter the code of subroutines when encountering CALL, stopping first at the first instruction of the subroutine. As shown in the figure, it enters the CALL subroutine.
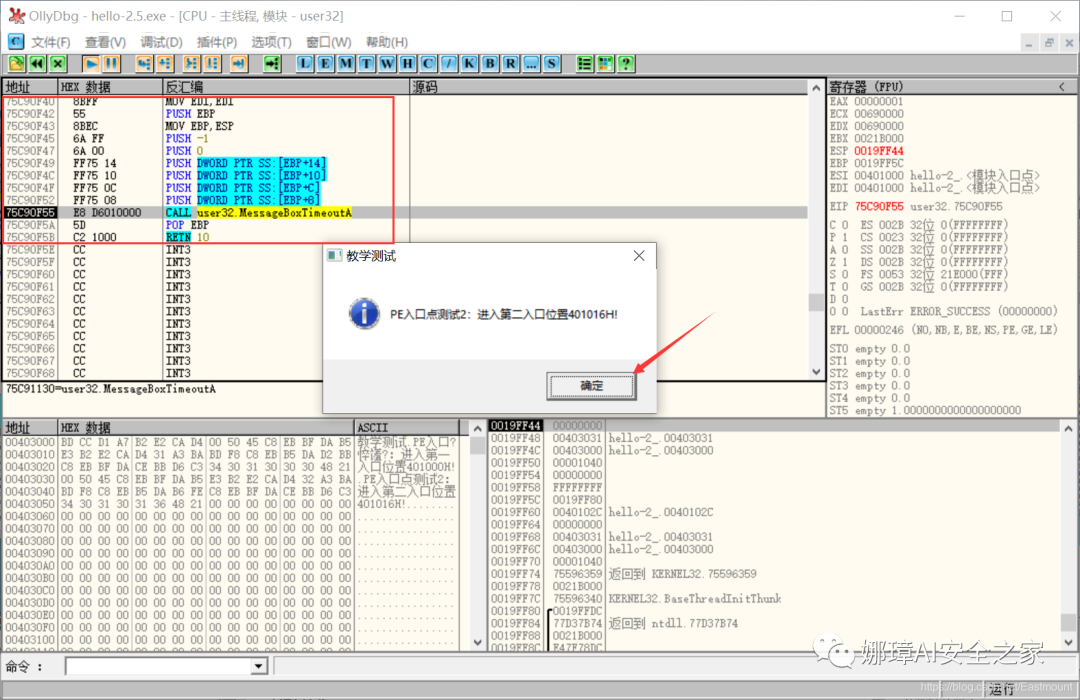
CALL means entering a function, and RETN means returning.
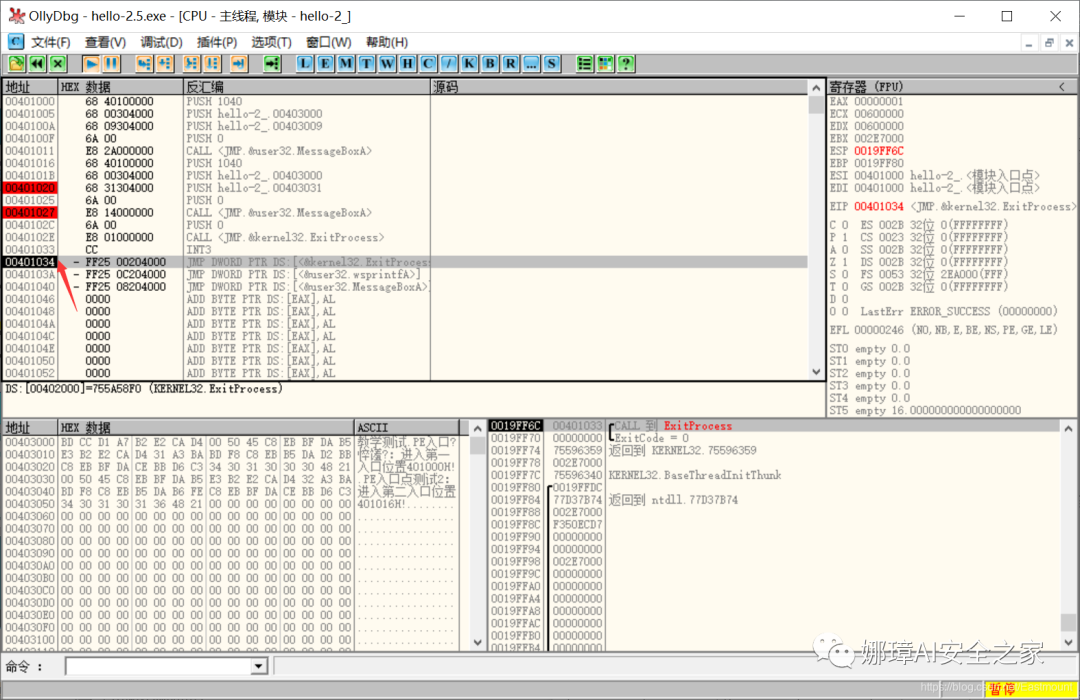
F4: Run to Selected Location This function allows you to run directly to the position where the cursor is located and pause. For example, if the cursor is at 0x00401034, we can continue running from 0x00401027, which will directly jump to the cursor position. When encountering loops during debugging, we can adjust the cursor to skip the loop.
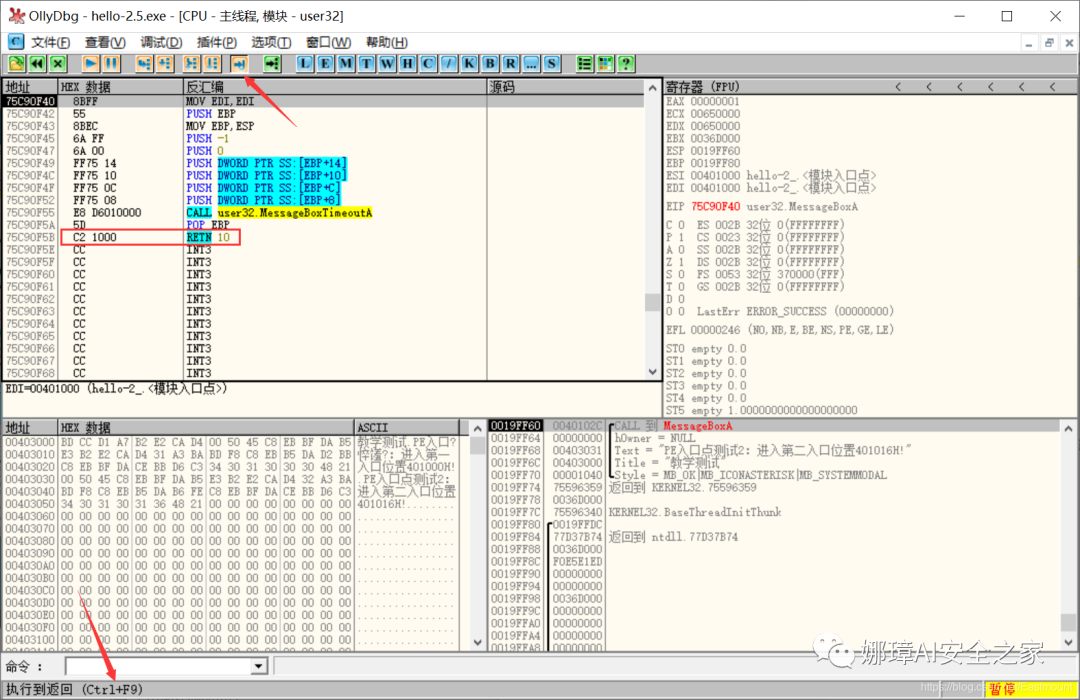
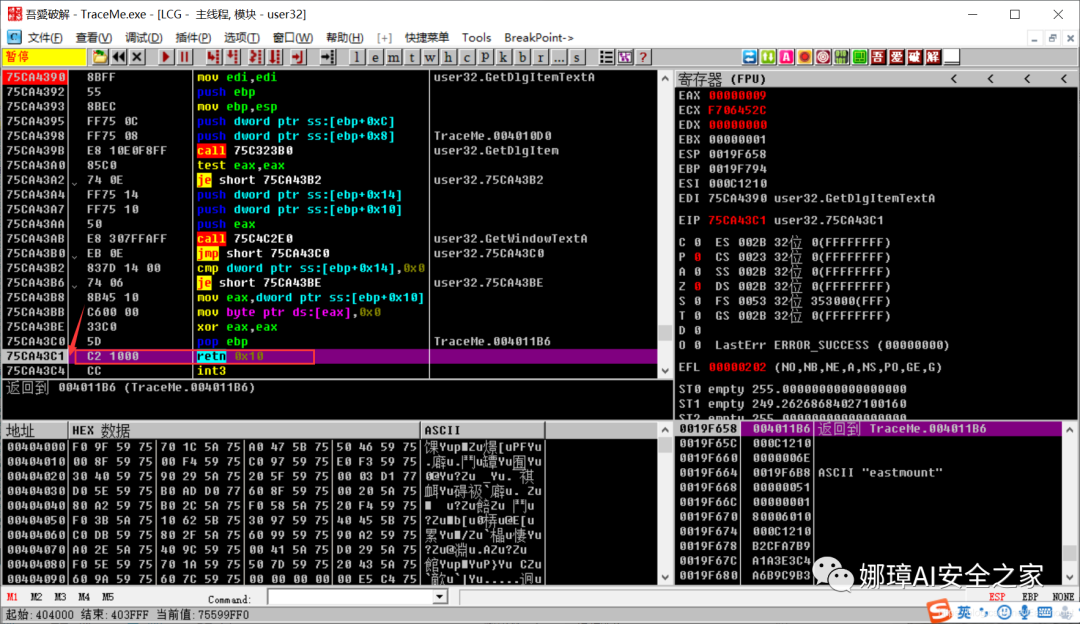
CTRL+F9: Execute to Return Pressing this key will execute until a return instruction is reached and then pause. This is commonly used to return from the system space to our debugged program space. During debugging, pressing CTRL+F9 will run the program until a RETURN is encountered. For example, if we enter the subroutine shown in the figure below, it will run until RETN 10.
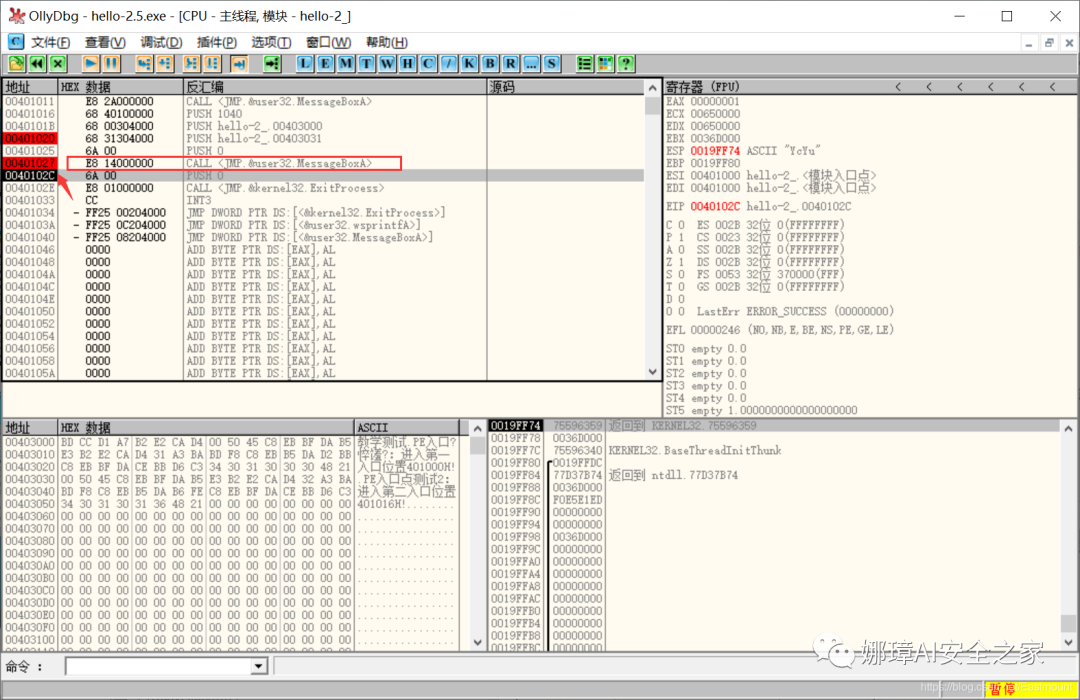
Then at the RETN 10 position, pressing F8 will return to the following position, completing the execution of the CALL function and moving to the next line.
CTRL+F2: Restart When you want to restart debugging the program, press CTRL+F2.
ALT+F9: Execute to User Code Quickly return from system space to the space of the program we are debugging.
3. OllyDbg Dynamic Cracking Software Demonstration
Next, we take the “TraceMe.exe” program from “Encryption and Decryption” as an example. Program download address:
-
https://github.com/eastmountyxz/Reverse-Analysis-Case
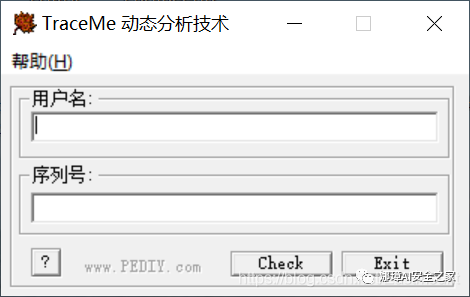
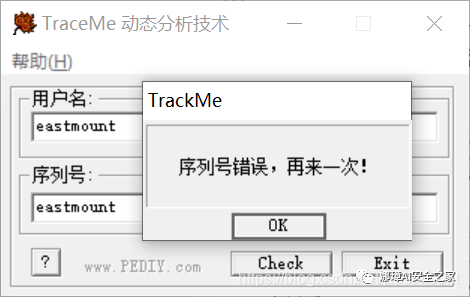
When we enter an incorrect username and serial number and click the “Check” button, it will display an input error.
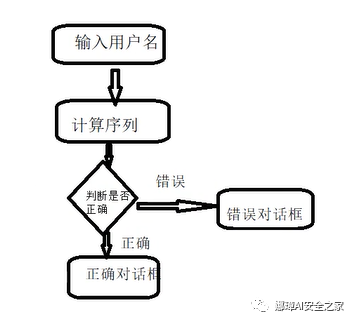
Next, we need to use OD to crack it. The basic process of this program is shown in the figure below, where only by entering the correct username and serial number can the correct dialog box be displayed.
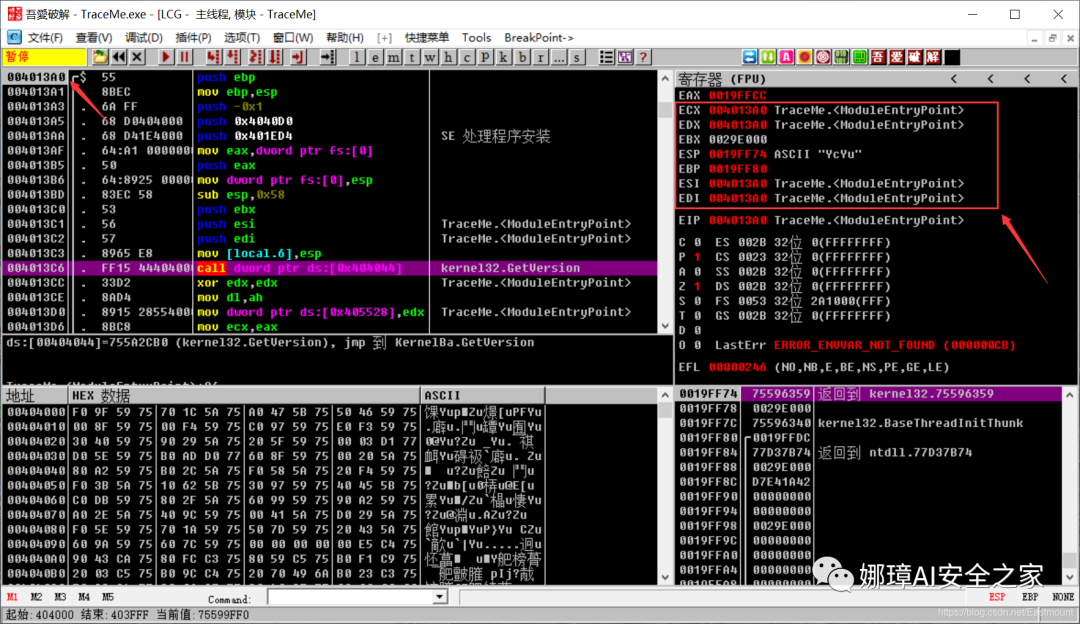
Then open the program through OD, and it will automatically locate to the module entry point at 0x004013A0. The author’s GitHub resources provide various versions of OD for readers to use.
Step 1: First, press F9 to run the program, and a dialog box will pop up.
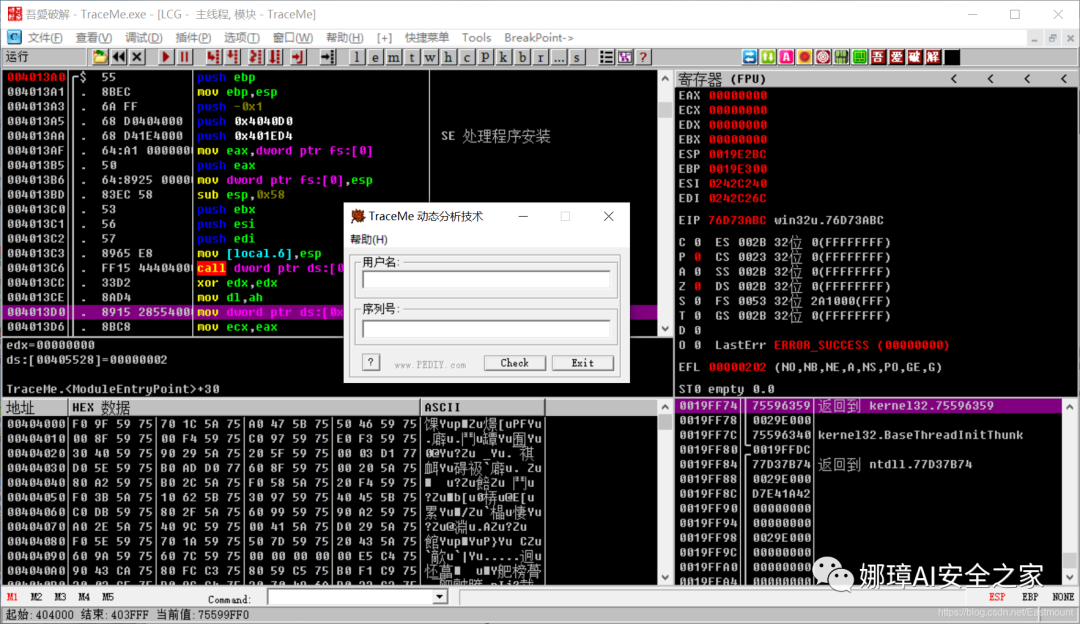
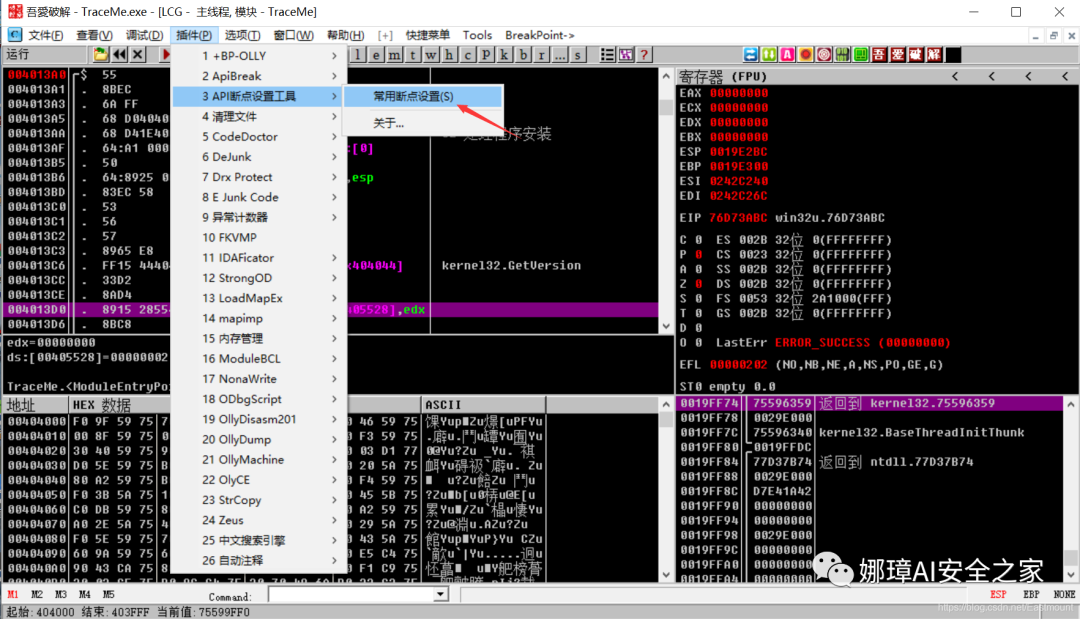
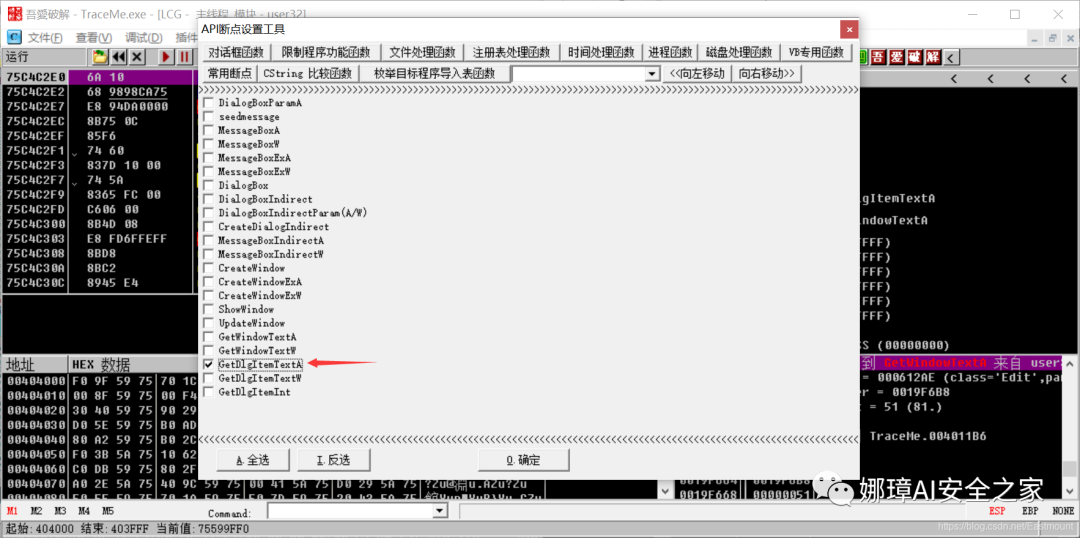
Step 2: We need to know which functions are involved in inputting values into the dialog box. Click “API Breakpoint Setting Tool” -> “Common Breakpoint Settings”.
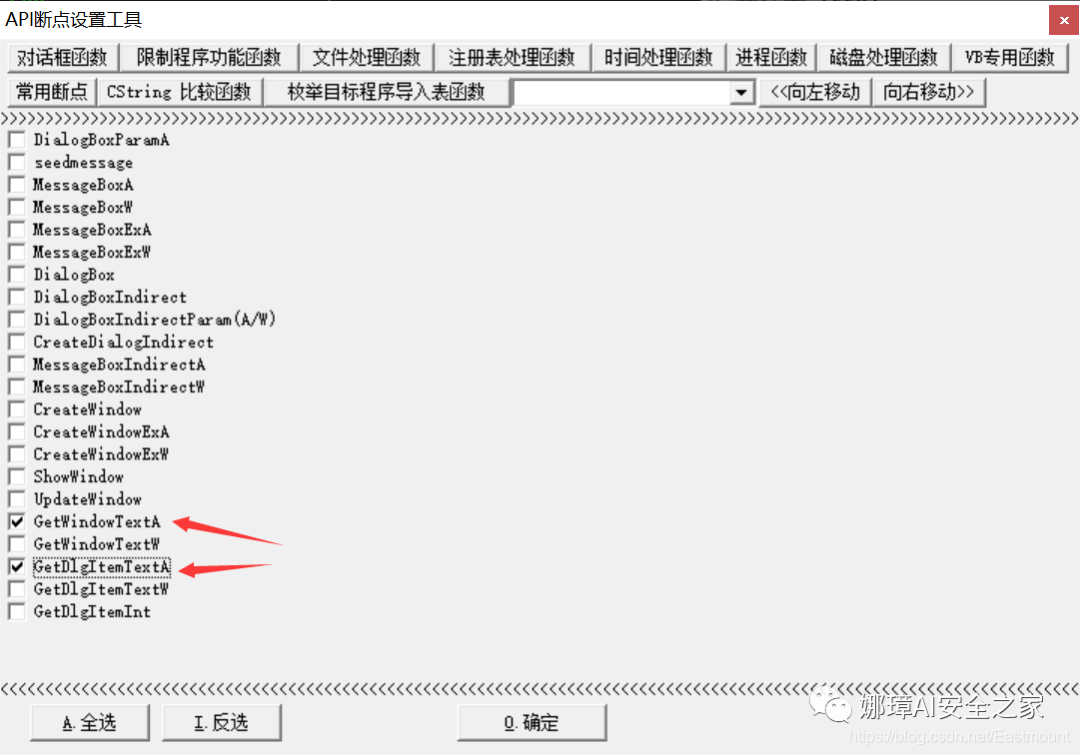
Select the two functions that retrieve the input values from the dialog box: “GetWindowTextA” and “GetDlgItemTextA”, which means setting breakpoints for these two functions. When the program runs to a certain function, it will stop. If the reader is unsure of the corresponding functions, they can select all functions.
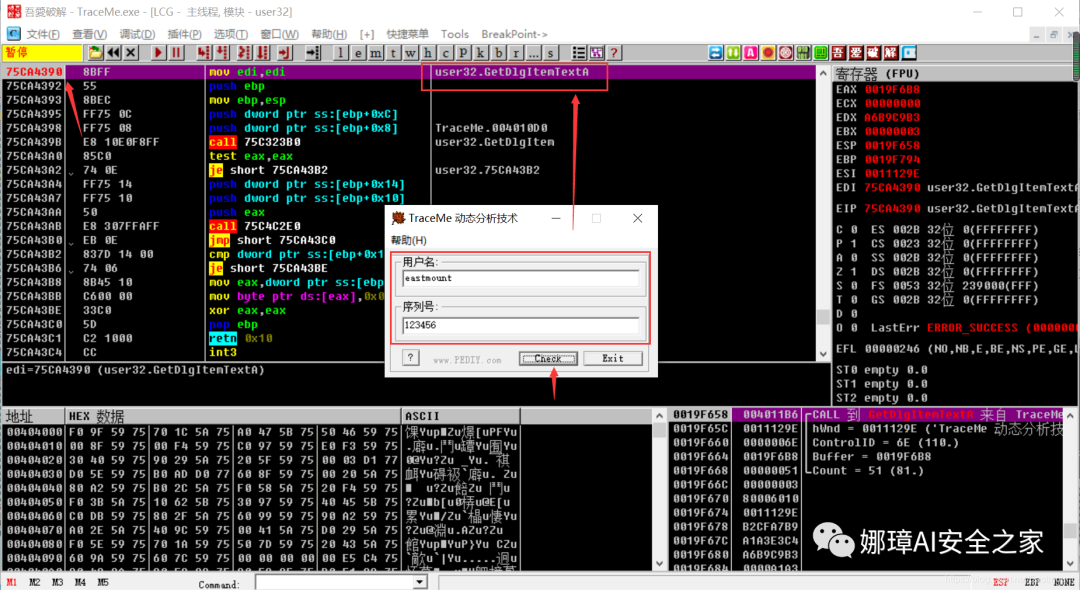
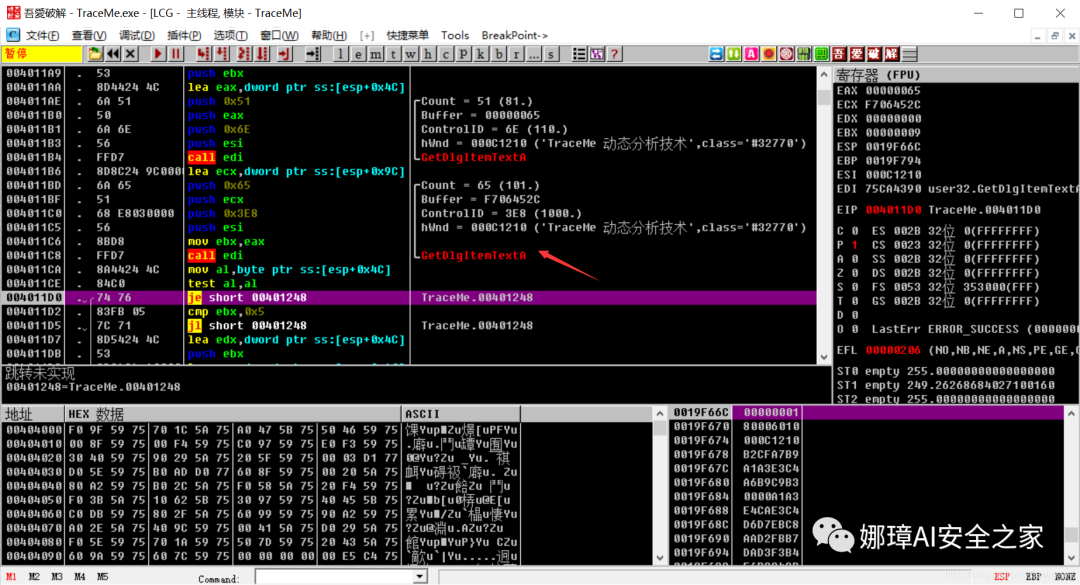
Step 3: Enter the username and serial number, then click the “Check” button. At this point, the program enters the position 0x75CA4390 and displays the call to the GetDlgItemTextA function.
We first press F2 to remove the breakpoint, then press F9 to execute the code, and we can see the pop-up box saying “Serial number error, try again!” This proves that our previous breakpoint was effective.
The four parameters of GetDlgItemTextA: dialog box handle, control identifier (ID number), buffer pointer, maximum character count in buffer, reference Win32.API manual.
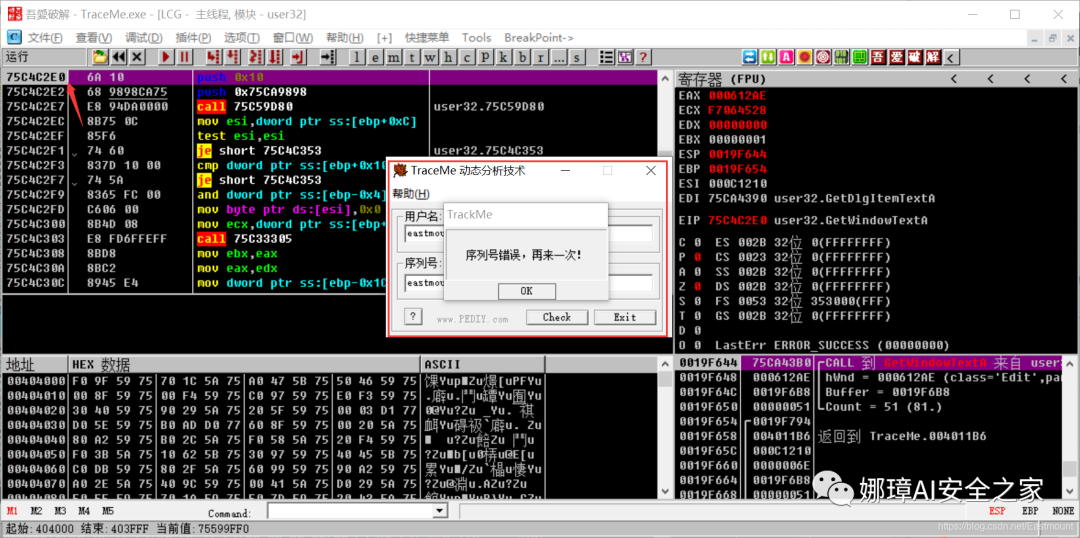
Next, we check the “GetDlgItemTextA” function again and click the “Check” button. It will continue to locate to the position 0x75CA4390 as shown in the figure below.
Step 4: Now press Ctrl+F9 to execute to the return position. At this point, the address 0x75CA43C1 is displayed.
Step 5: Then press the F8 key to execute the return. At this point, we see the position where the GetDlgItemTexeA function is executed. It will return to the next line of the calling function, noting that it is the next line. Our program has two dialog box values, so there will be two calls to the GetDlgItemTexeA function.
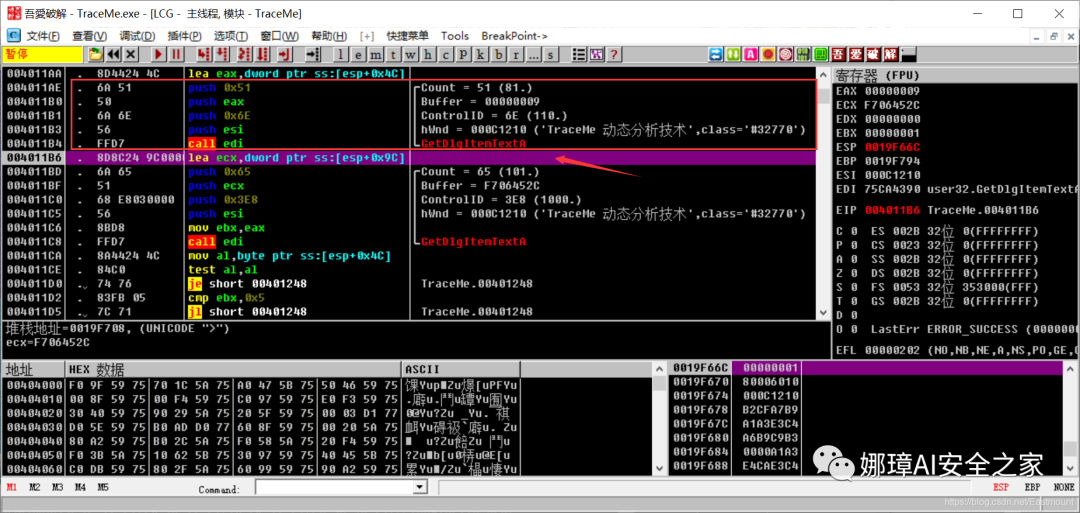
We continue to press F8 to proceed, and after obtaining these two values, the next step should be the process of calculating the serial number and then judging whether it is correct.
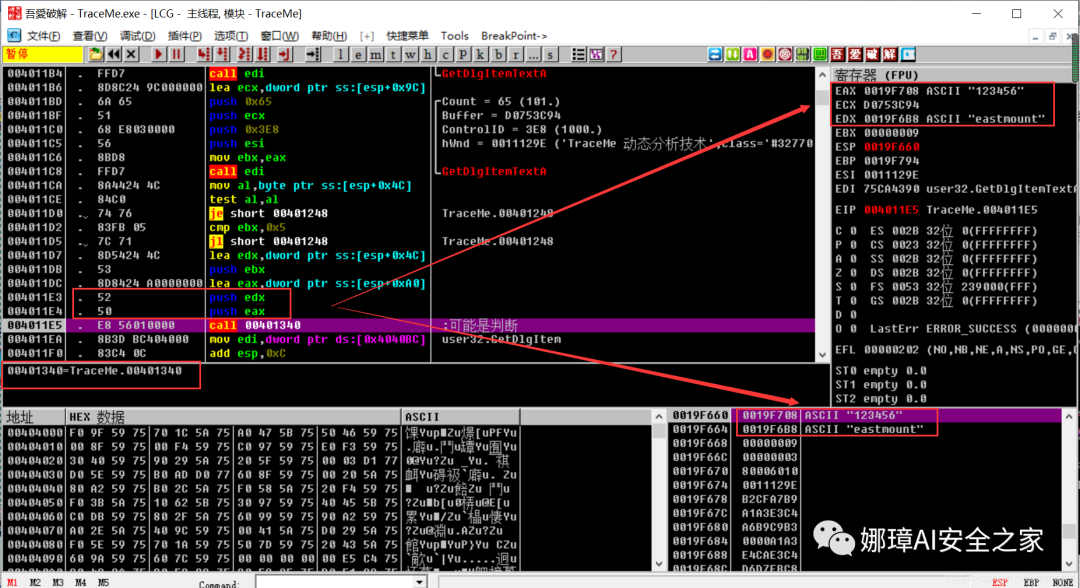
Continuing downward, we arrive at position 0x004011E4, where we can see the values of EDX and EAX in the upper right corner, which are the inputs “eastmount” and “123456”. At the same time, the lower right corner shows that both values have been pushed onto the stack.
-
EAX: 123456
-
EDX: eastmount
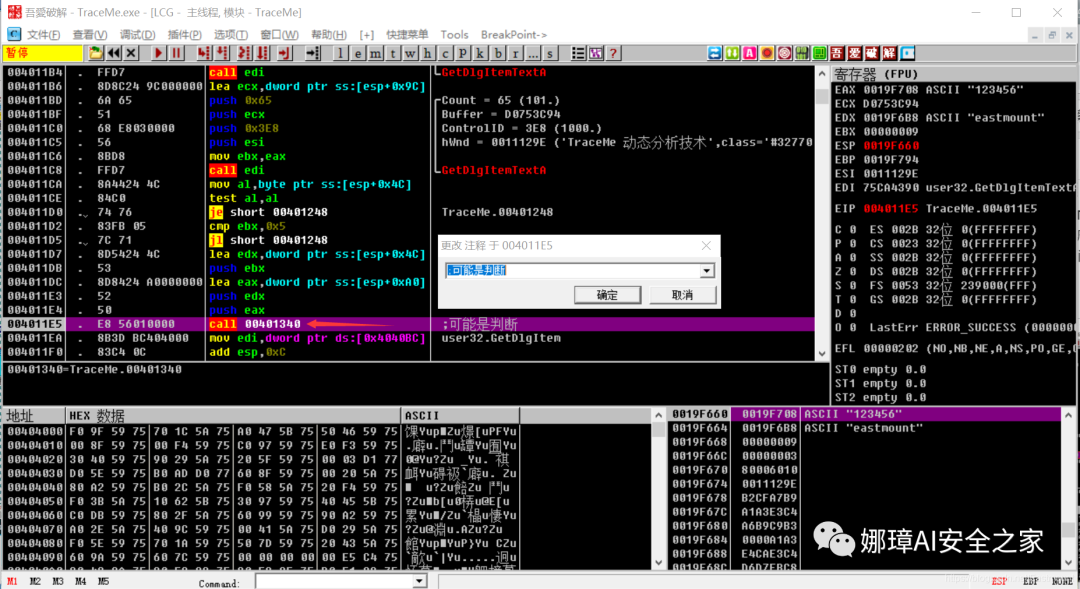
Step 6: Access the TraceMe.00401340 function We can speculate that the called function “call TraceMe.00401340” is for judgment and add the following comments. However, it may not be; during reverse analysis or cracking of software, we usually need to rely on logical and programming skills to make inferences.
Press F7 to enter this program at position 0x00401340.
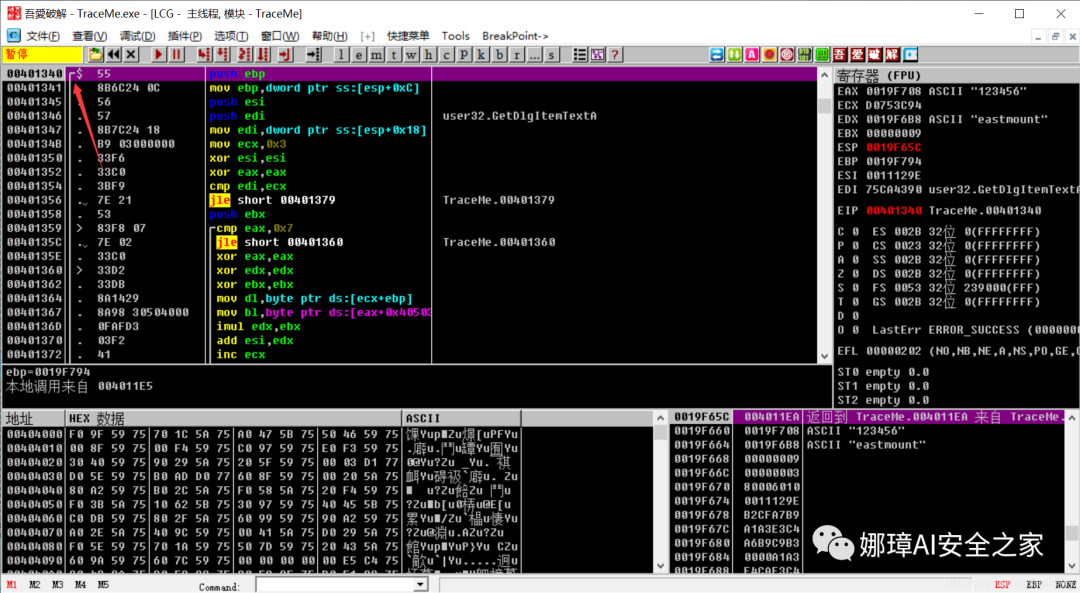
Then press F8 to execute, and we can find that there is a loop here, checking whether the input values match their original values.
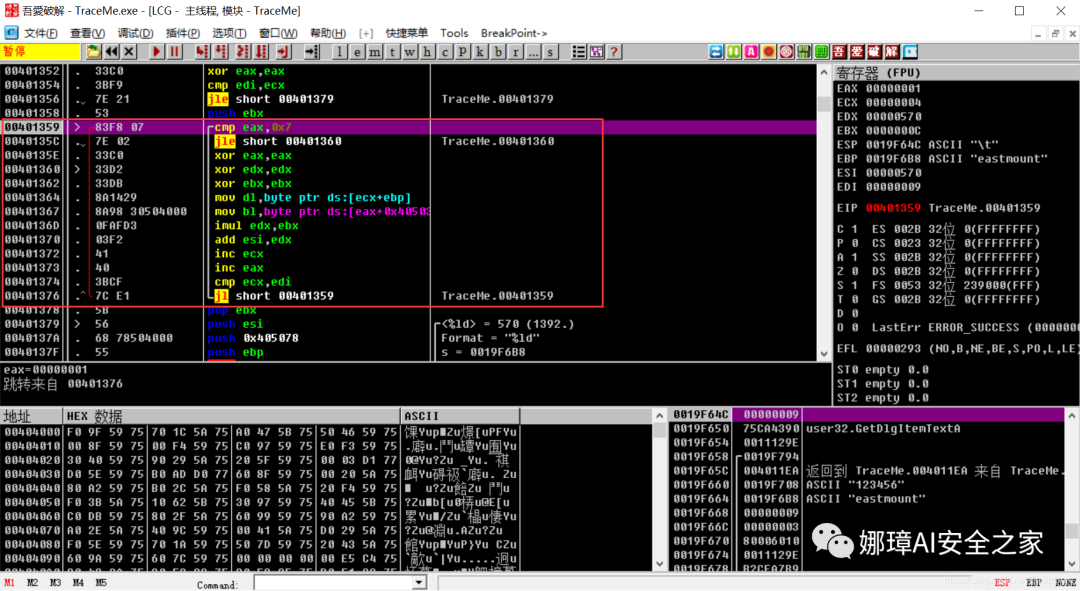
After the loop, continuing the execution shows some judgment information about the serial number “123456”.
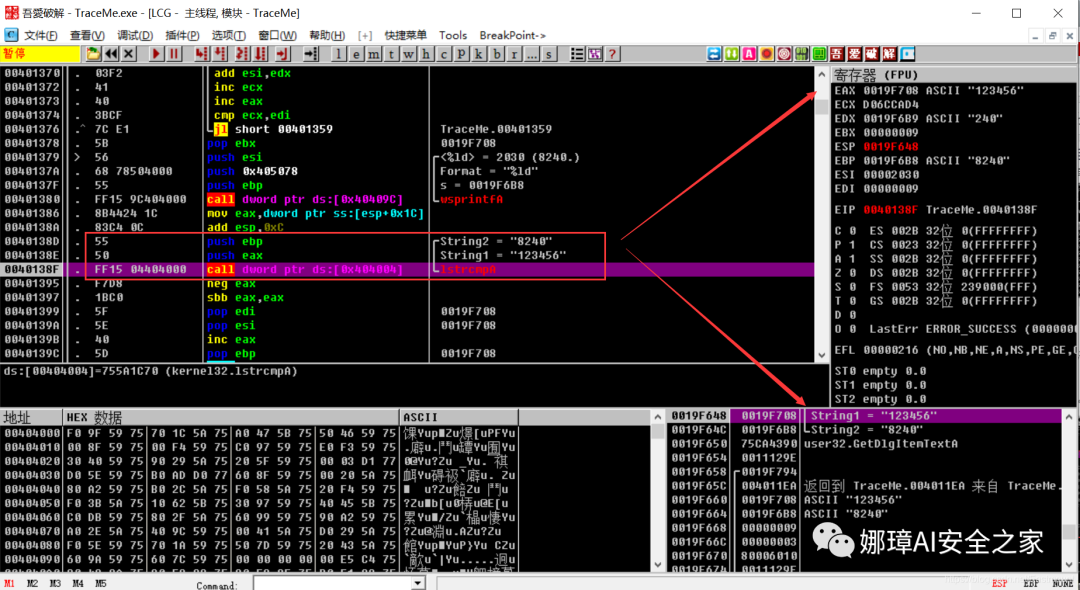
Ultimately, it will return a value to EAX that equals 0, and then continue to return that value.
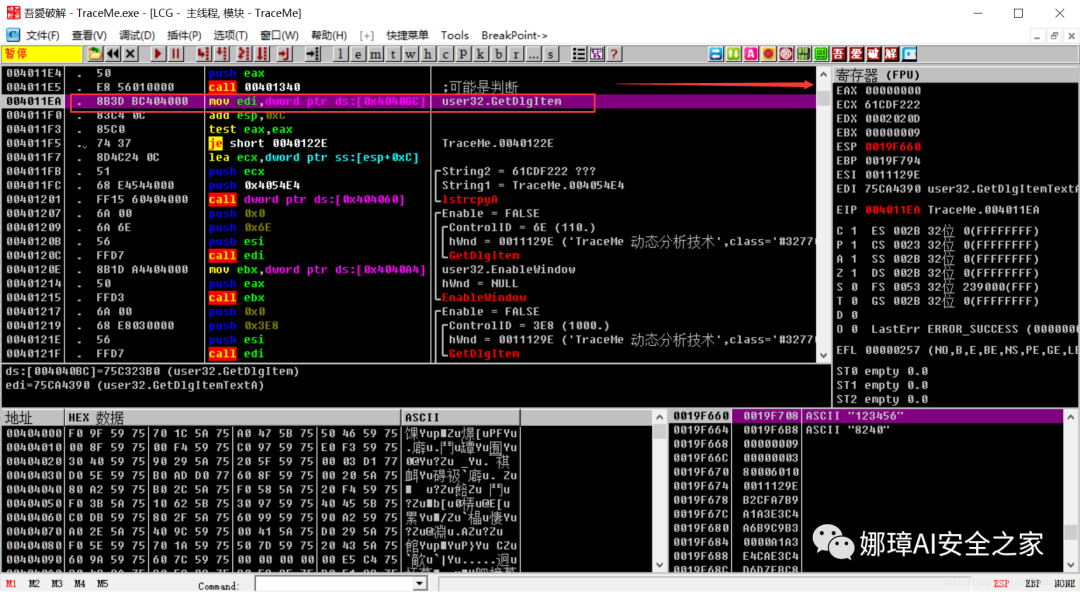
Step 7: Jump Function Analysis If this function is indeed a judgment function, then the following jump is likely to be the key jump that we need to modify for cracking. Position: 0x004011F5
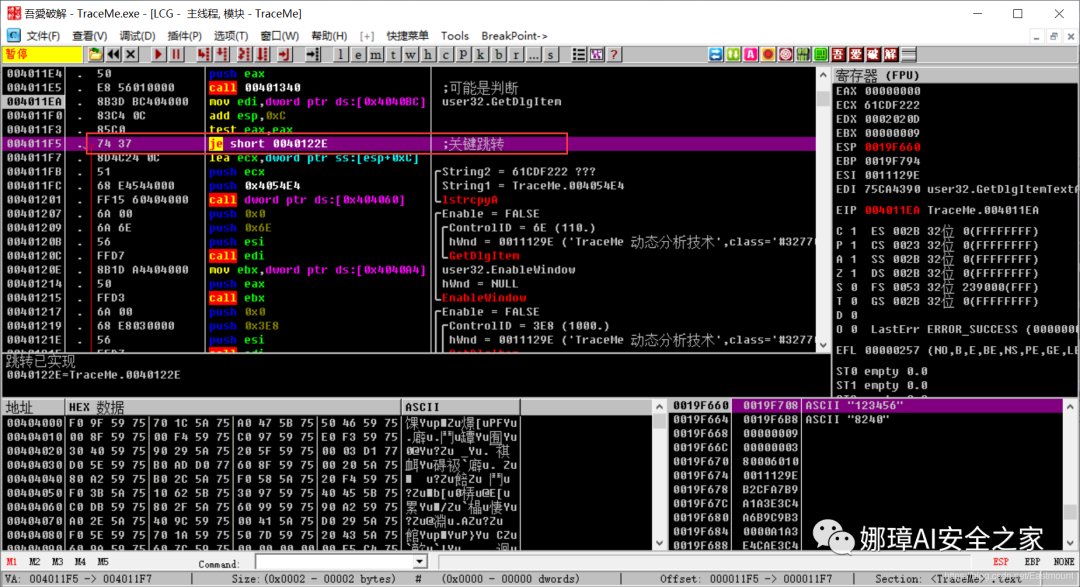
Add a breakpoint, then press F8 to continue running.
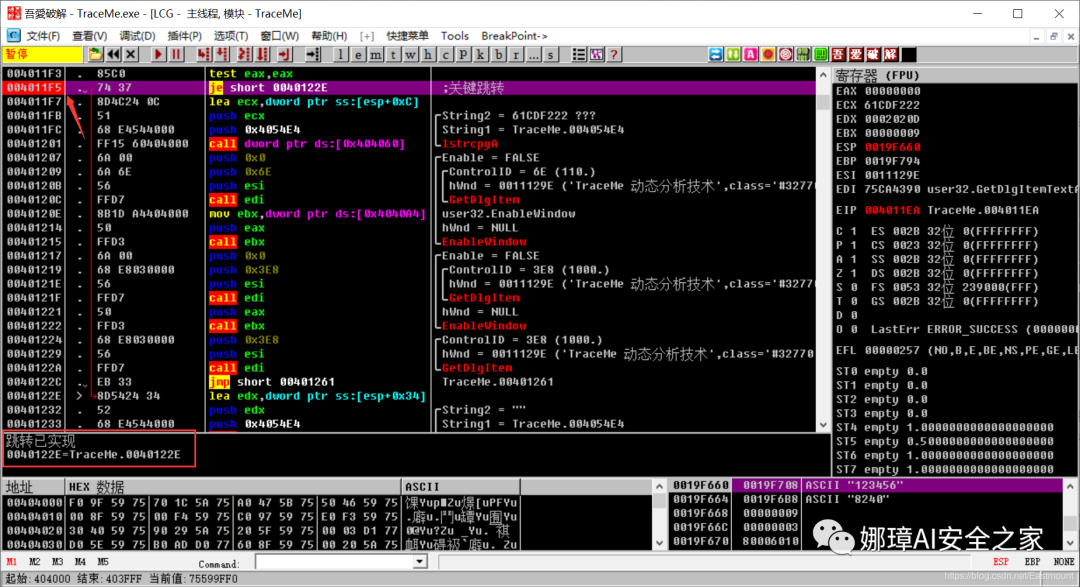
It was found that it directly jumps to 0x0040122E, and then prompts “Serial number error, try again!”
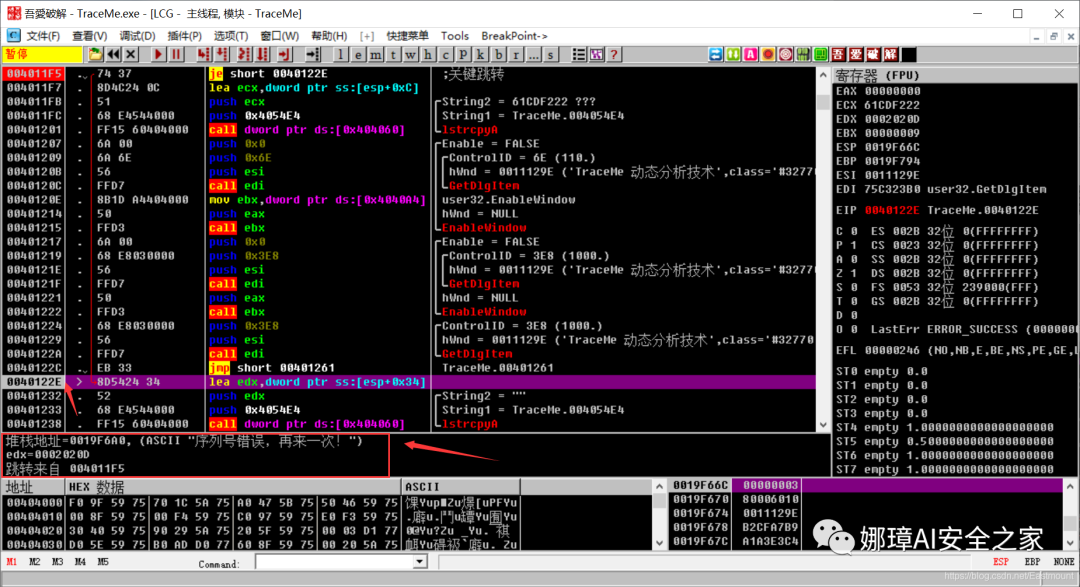
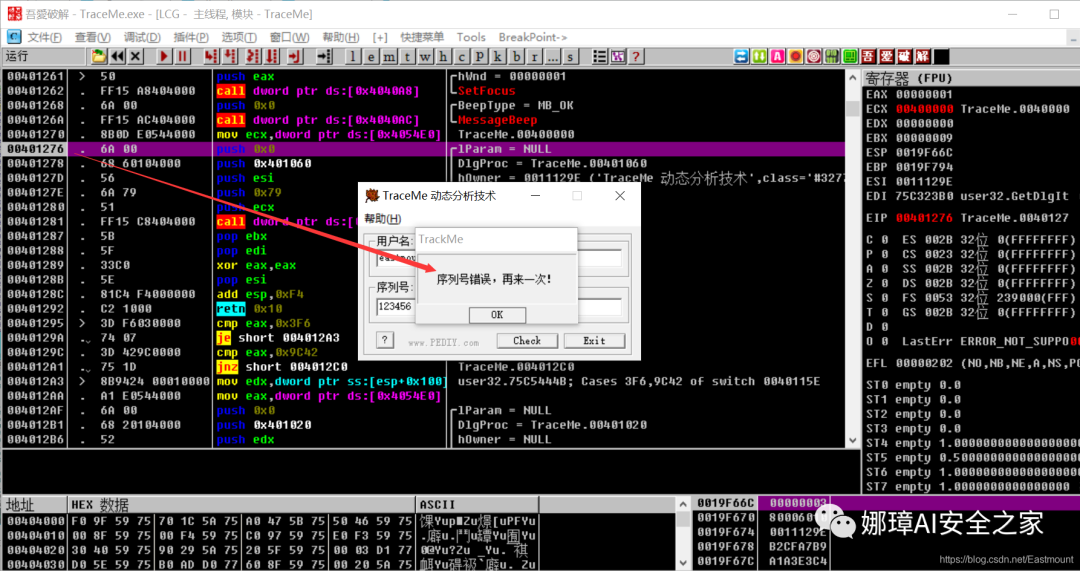
Press F9 to run again, and sure enough, an error dialog box pops up, confirming that the above is the key jump.
Step 8: Press Ctrl+F2 to restart the program Then press F9 to execute the program, input content in the pop-up dialog box, and click “check”.
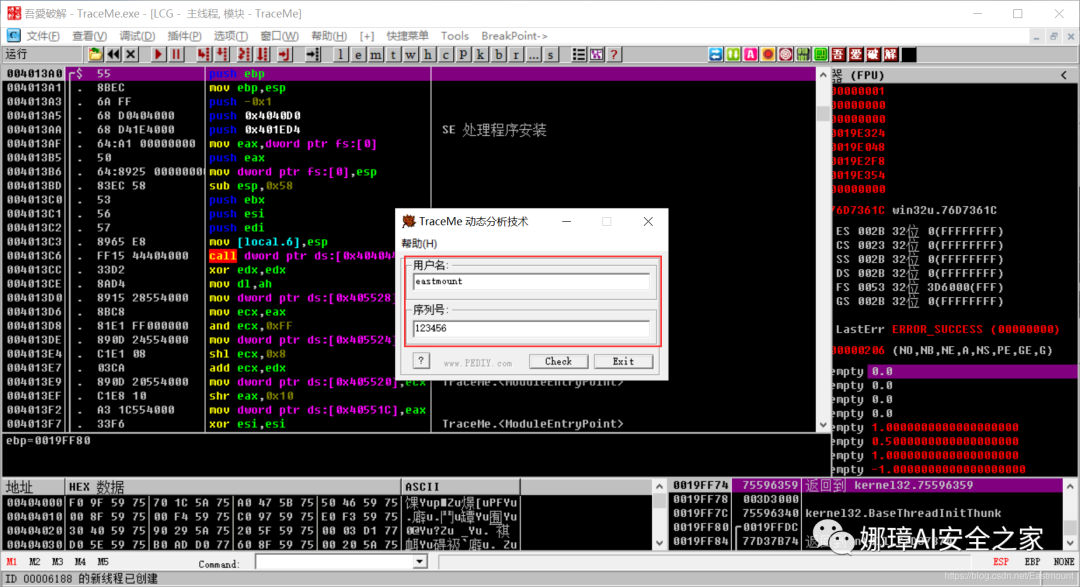
Continue by pressing F9 to run the program, which jumps to the “key jump” position we just set a breakpoint on.
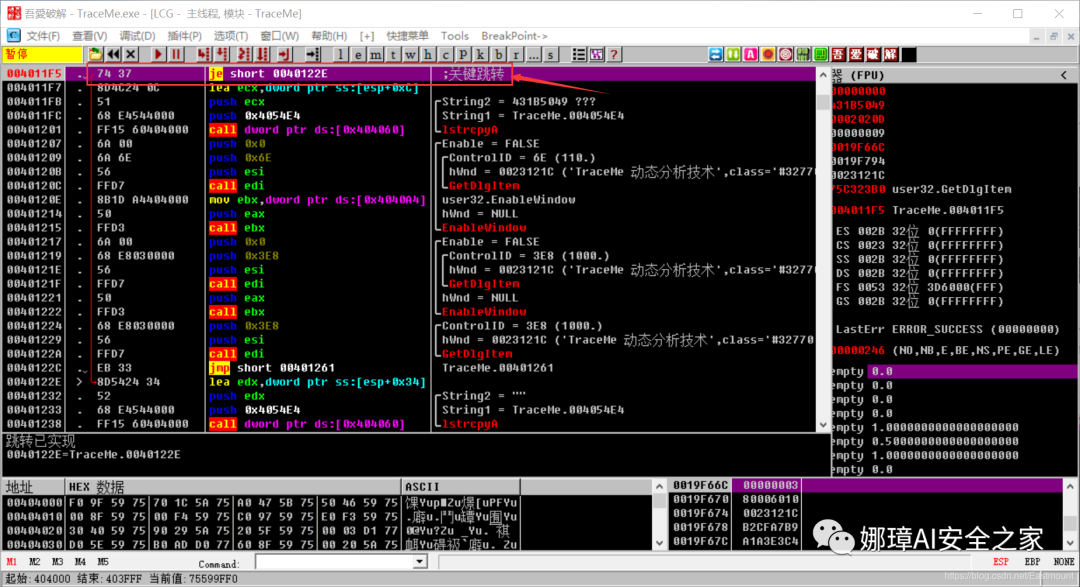
Key Step: Modify the assembly code, change JE to JNZ to prevent jumping.
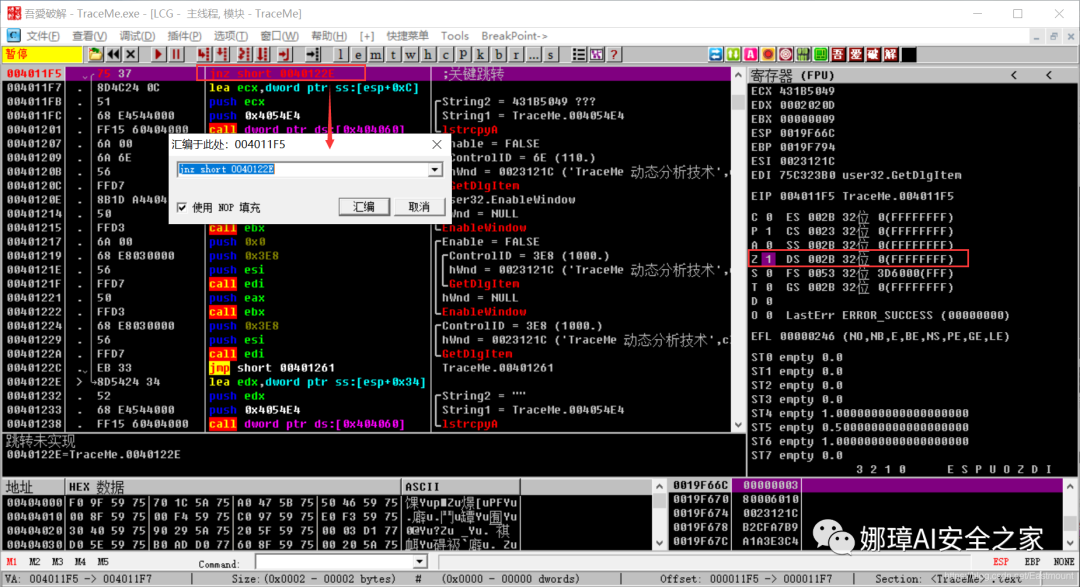
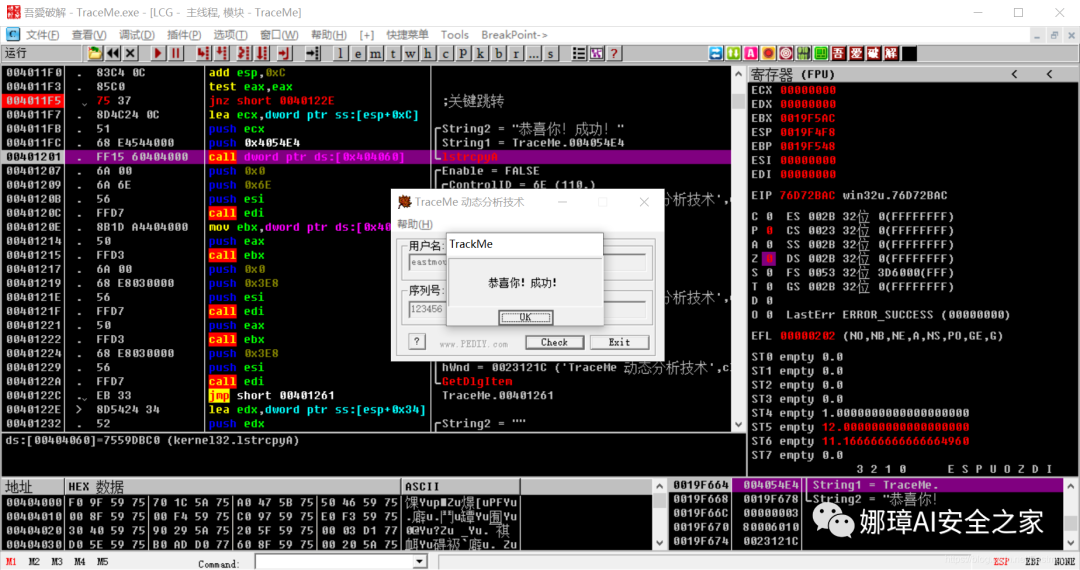
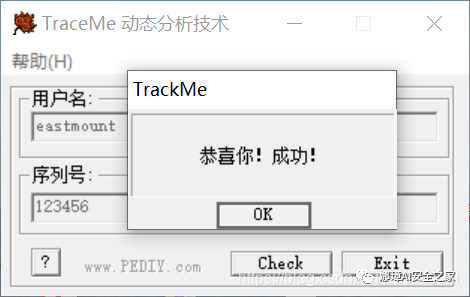
Continue pressing F8 to execute, or directly press F9, and a dialog box saying “Congratulations, success” will appear. This is the basic process of cracking.
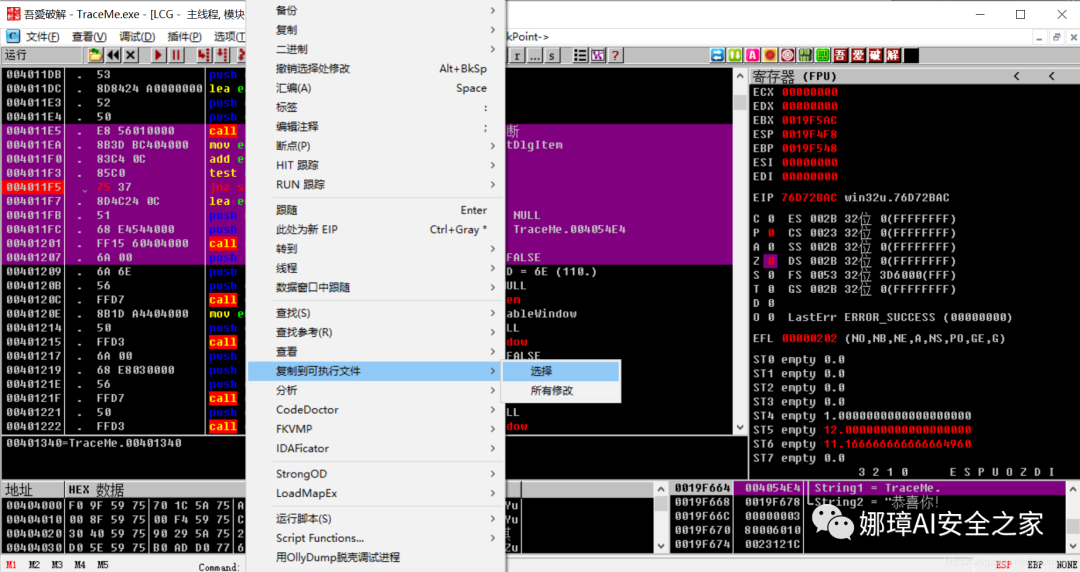
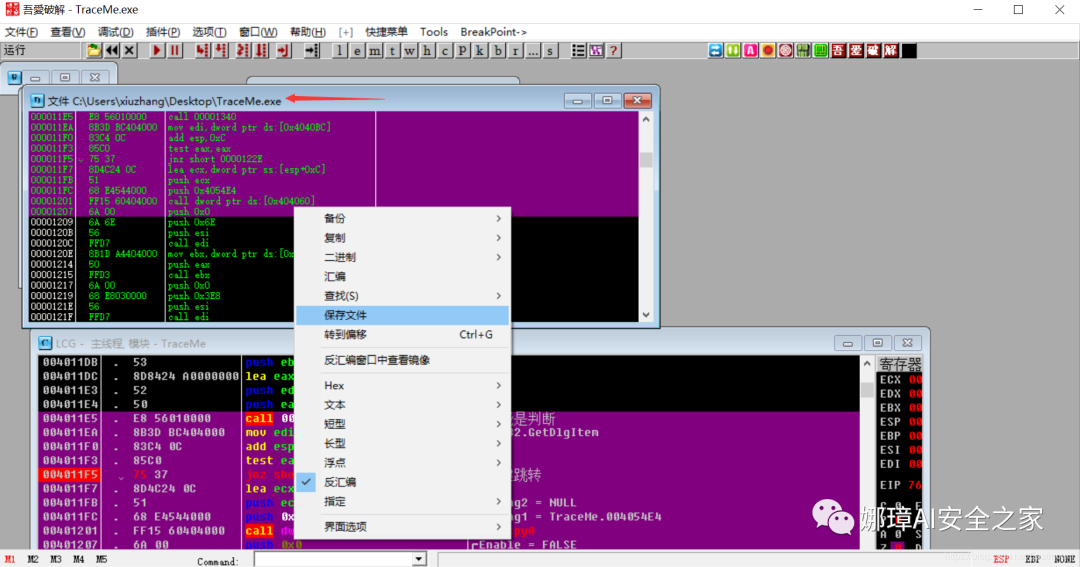
Step 9: Save the cracked software Select the modified lines and right-click to click “Copy to Executable File”.
Select the “TraceMe.exe” file, right-click to save the file as “TraceMe_PO2.exe”.
After saving successfully, any username and serial number input will prompt success!
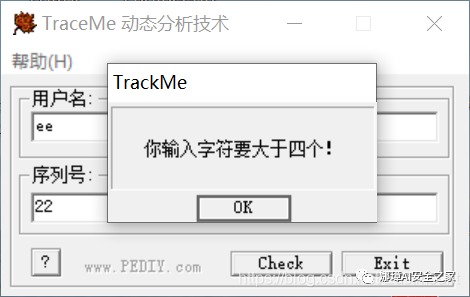
At the same time, this program also has a length check, and we can also try to crack it.
But what is its principle? We will continue to introduce it in subsequent articles.
4. Summary
With that said, this article is concluded. I hope you enjoyed it~
-
OllyDbg Interface Introduction and Configuration
-
Common Shortcuts
-
OllyDbg Dynamic Cracking Software Demonstration
If there are any shortcomings in this article, please bear with me. The author is slowly growing as a beginner in cybersecurity! I hope to write related articles more thoroughly in the future. I would also like to thank the security experts for sharing their articles in the references, and thank my mentors, seniors, and juniors for their guidance. I know I have a long way to go and must work hard.
Previous article review (the hyperlinks below can be clicked):
-
[System Security] 1. What is Reverse Analysis, Applications of Reverse Analysis, and Classic Minesweeper Game Reverse
-
[System Security] 2. How to Learn Reverse Analysis Well and the Lu Bu Zhuang Game Reverse Case
-
[System Security] 3. Introduction to IDA Pro Disassembly Tool and Reverse Engineering Decryption Practice
-
[System Security] 4. Basic Usage of OllyDbg Dynamic Analysis Tool and Crakeme Reverse Cracking
-
[System Security] 5. Reverse Analysis of Plants vs. Zombies Game with OllyDbg and Cheat Engine
-
[System Security] 6. Reverse Analysis of Conditional Statements and Loops Source Code Restoration and Process Control
-
[System Security] 7. PE Virus Principles, C++ Implementation of File Encryption and Decryption, and OllyDbg Reverse
-
[System Security] 8. Windows Vulnerability Exploitation of CVE-2019-0708 Reproduction and Blue Screen Attack
-
[System Security] 9. Windows Vulnerability Exploitation of MS08-067 Remote Code Execution Vulnerability Reproduction and Deep Privilege Escalation
-
[System Security] 10. Windows Vulnerability Exploitation of SMBv3 Service Remote Code Execution Vulnerability (CVE-2020-0796) Reproduction
-
[System Security] 11. Analysis of the Panda Burning Incense Virus and PE Virus Behavioral Mechanism
-
[System Security] 12. IDA and OD Reverse Analysis of the Panda Burning Incense Virus (Part 1) Virus Initialization
-
[System Security] 13. IDA and OD Reverse Analysis of the Panda Burning Incense Virus (Part 2) Virus Release Mechanism
-
[System Security] 14. IDA and OD Reverse Analysis of the Panda Burning Incense Virus (Part 3) Virus Infection Configuration
-
[System Security] 15. Chrome Password Saving Function Penetration Analysis, Chrome Blue Screen Vulnerability, and Music Software Vulnerability Reproduction
-
[System Security] 16. Basic Knowledge of PE File Reverse Analysis (PE Parsing, PE Editing Tools, and PE Modification)
-
[System Security] 17. Concepts, Classifications, and Infection Methods of Windows PE Viruses
-
[System Security] 18. Virus Attack and Defense Mechanisms and WinRAR Malicious Hijacking Vulnerability (BAT Virus, Auto-start, Blue Screen Attack)
-
[System Security] 19. Introduction to Macro Viruses, Defense Measures, Self-sending Emails, and APT28 Macro Sample Analysis
-
[System Security] 20. PE Digital Signatures (Part 1) What is Digital Signature and Detailed Explanation of Signtool Signing Tool
-
[System Security] 21. PE Digital Signatures (Part 2) Signcode, PEView, 010Editor, Asn1View Tool Usage
-
[System Security] 22. PE Digital Signatures (Part 3) Reproduction of Microsoft Certificate Vulnerability CVE-2020-0601 and Analysis of Windows Verification Mechanism
-
[System Security] 23. Reverse Analysis of OllyDbg Dynamic Debugging Review and TraceMe Case Analysis
On August 18, 2020, the new “Nazhange AI Security Home” was opened, mainly focusing on Python big data analysis, cyberspace security, artificial intelligence, web penetration, and offensive and defensive techniques. It also shares algorithm implementations of CCF, SCI, and Southern and Northern Nuclear papers. Nazhange Home will be more systematic, and will restructure all the author’s articles, explaining Python and security from scratch. After nearly ten years of writing articles, I sincerely want to share what I have learned, felt, and done. I invite your guidance and sincerely invite your attention! Thank you. Let’s continue to work hard in 2021!

(By: Eastmount 2021-03-02 Tuesday night in Wuhan)
References:
-
[1] OllyDbg (OD) Tutorial – Bilibili yxfzedu
-
[2] [Reverse Notes] OD Tool Usage – Reverse TraceMe.exe – 17bdw Notes
-
[3] “Encryption and Decryption” by Duan Gang et al.
-
[4] “Introduction to OllyDBG” – CCDebuger
-
[5] 160 Crackme006 – Master Gui Shou 56