Adv. Sci. IF : 14.1 Comprehensive Zone 1
Improving the sensitivity and gas identification capability of gas sensors is crucial for their widespread application. In addition to material-level improvements, considering the operational aspects of gas sensors, developing efficient sensor conversion methods is also highly practical, but such methods for resistive sensors remain challenging.
Prof. Jong-Ho Lee from Seoul National University and his team proposed an operational method that can simultaneously enhance the sensitivity and gas identification capability of resistive gas sensors by dividing the sensor operation into a reaction phase and a signal detection phase, and optimizing operational schemes for each phase. In the reaction phase, suitable operational methods are applied for oxidative and reductive gases to maximize their chemical adsorption efficiency. The signal detection phase introduces read bias technology, significantly improving the sensitivity for all gas detections: the sensitivity for detecting 500 ppb NO₂ increased by 23 times, and the sensitivity for detecting 50 ppm H₂S increased by 6 times. Additionally, the limit of detection (LOD) was significantly improved: the LOD for NO₂ decreased from 11.8 ppb to 1.4 ppb. The study also proposed a method for obtaining gas-specific signal patterns, which can reflect the unique diffusion characteristics of each gas by simply adjusting the signal reading conditions. This method demonstrated that accurate identification of four different gases can be achieved using a single sensor.。 Visual Overview
Visual Overview
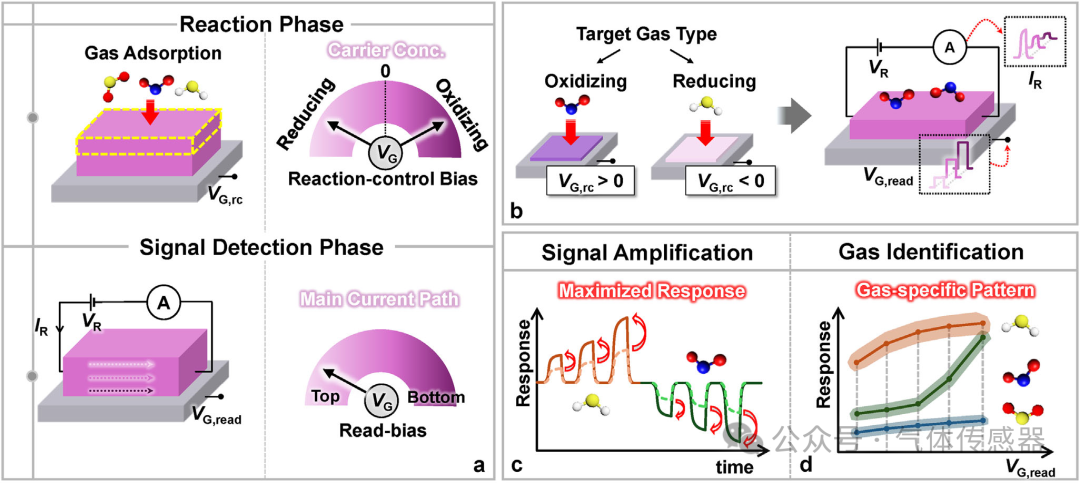
Figure 1 a) The two operational phases for optimizing the performance of resistive gas sensors. b) The reaction control bias (VG,rc) and read bias (VG,read) applied in each operational phase. c) Enhancing sensor response using read bias method. d) Gas identification based on read bias response spectrum.
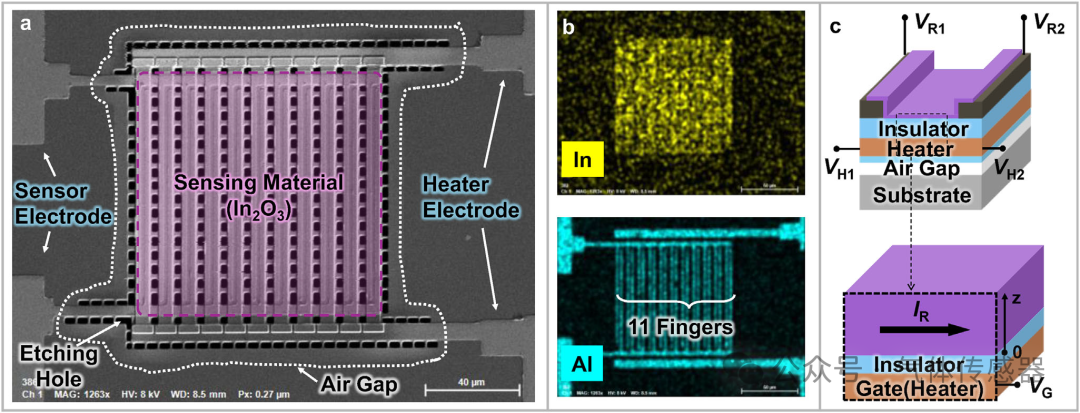
Figure 2 Sensor structure characterization
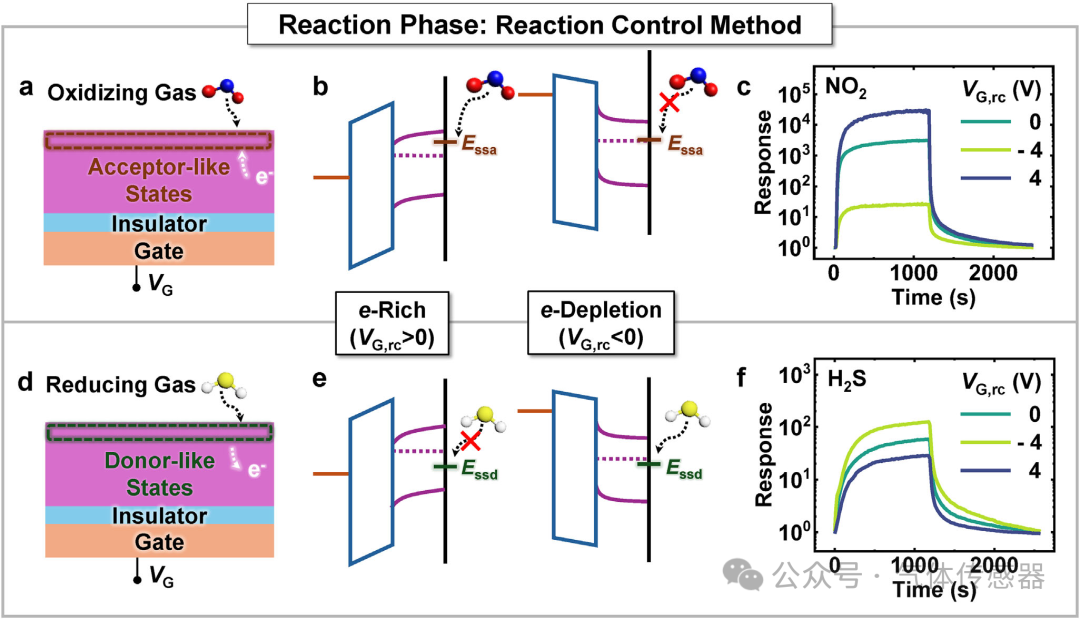
Figure 3 Control methods in gas-sensitive reactions.a) The receptor and donor states generated by adsorbed NO₂ and H₂S gases, respectively. b) e) Energy band diagrams and chemical adsorption states of the sensor under two different reaction control bias conditions. c) f) Response curves of NO₂ and H₂S gases under three different reaction control biases.
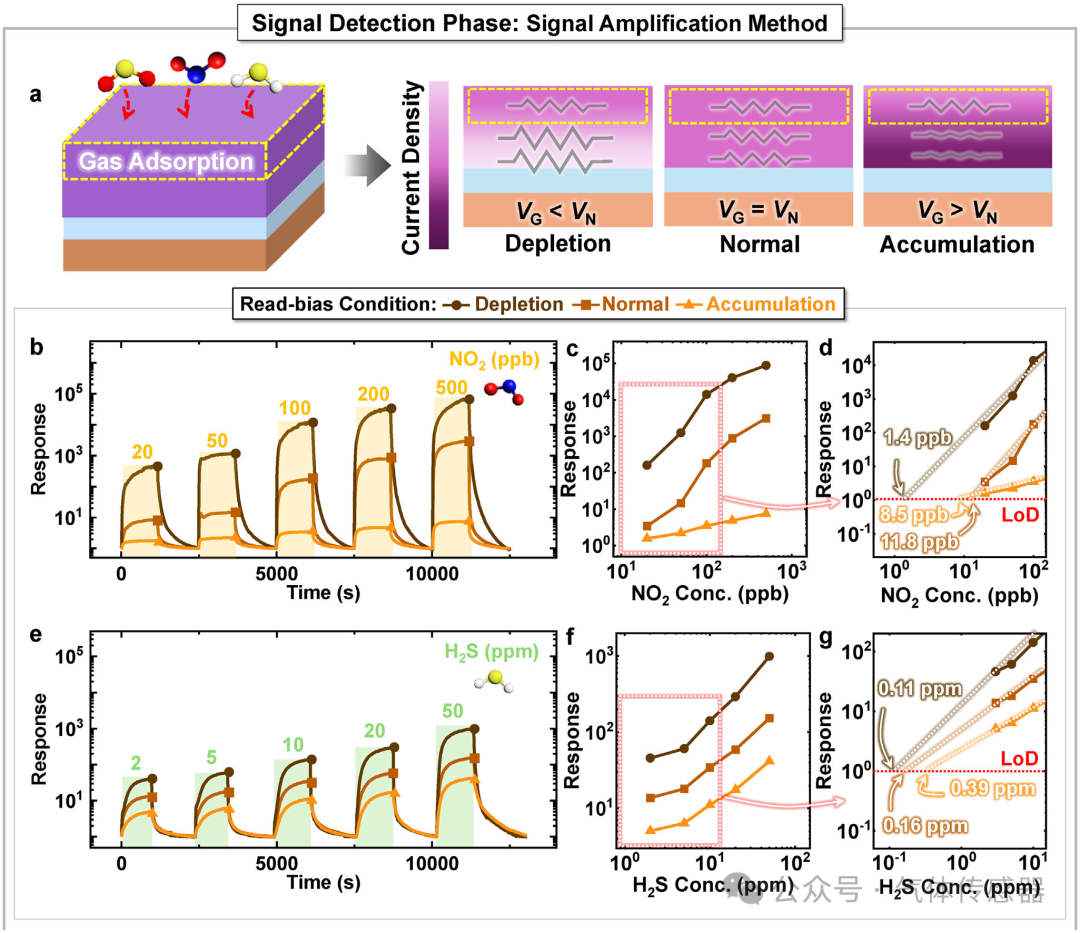 Figure 4 Signal detection amplification method.a) Schematic diagram showing the change in the main current path under different read bias conditions. b) e) The transient response of the sensor to different concentrations of NO₂ and H₂S gases under three read bias conditions. c) f) The relationship curves between response values and concentrations of NO₂ and H₂S gases, as well as d) g) the power law fitting lines under three different read bias conditions.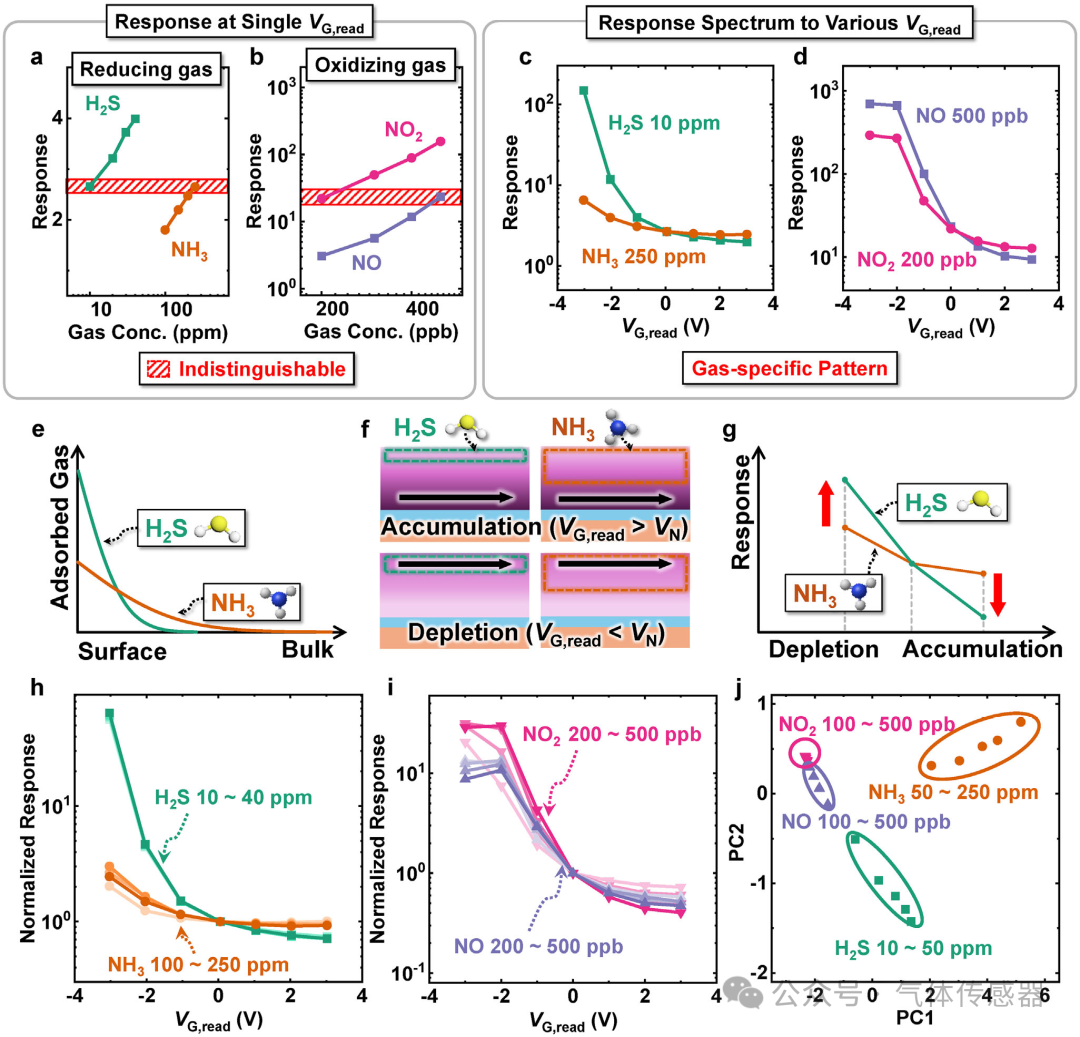
Figure 5 a) The response and gas concentration relationship of reductive gases (H₂S, NH₃) and b) oxidative gases (NO₂, NO) under a single read bias condition. c) The response spectra of reductive gases (10 ppm H₂S, 250 ppm NH₃) and d) oxidative gases (200 ppb NO₂, 500 ppb NO) under different read bias conditions. e) Schematic diagram of the vertical distribution of H₂S and NH₃ gas concentrations adsorbed in the sensing material. f) Schematic diagram and g) chart showing the effect of read bias on the response differences of two gases with different vertical distributions. h) The normalized curves of response for reductive gases (H₂S, NH₃) and i) oxidative gases (NO₂, NO) at various concentrations under different read biases. j) Principal component analysis (PCA) results based on the response spectra of four gases (H₂S, NH₃, NO₂, NO) under different read biases.

Statement
The copyright of this article belongs to the original author. Sharing and reprinting are welcome (please indicate the source);
With limited knowledge, there may be errors, and constructive criticism is welcome!