


Tumor stemness refers to a subpopulation of tumor cells that possess stem cell-like characteristics, including self-renewal, differentiation into various cell types, and the ability to survive in harsh environments. This characteristic makes tumor cells more prone to recurrence and metastasis after treatment and leads to resistance to conventional therapeutic methods. Therefore, identifying and targeting stemness-related genes in tumors is crucial for improving treatment outcomes. The RNA stemness score (RNAss) is an indicator used to quantitatively assess the stemness level of RNA molecules, reflecting the potential to maintain or influence stem cell characteristics, such as cell proliferation, pluripotency, or anti-differentiation. Today, I would like to recommend an article published in February 2025 in the Journal of Translation Medicine, which has an impact factor of 6.1. The article titled “A novel stemness-related lncRNA signature predicts prognosis, immune infiltration and drug sensitivity of clear cell renal cell carcinoma” combines bioinformatics with cellular and mouse experiments to discover and validate the functions of lncRNAs related to tumor stemness in regulating tumor proliferation and metastasis.
1
Innovations

This study focuses on long non-coding RNAs (lncRNAs) and messenger RNAs (mRNAs) related to tumor stemness in clear cell renal cell carcinoma (ccRCC). The research obtained human stem cell data from the Progenitor Cell Biology Consortium (PCBC) and downloaded gene expression data and clinical information from the TCGA and GEO databases, while utilizing the syn3156503 dataset for analysis. Using the one-class Logistic regression (OCRIS) machine learning algorithm from the “gelnet” package, gene weights were determined, and a predictive model was constructed. Based on this model, the RNA stemness scores (RNAss) of TCGA-KIRC samples were calculated, with higher RNAss indicating stronger stemness. Further, weighted correlation network analysis (WGCNA) identified stemness-related lncRNAs (SRlncRNAs) and stemness-related mRNAs (SRmRNAs) in ccRCC, determining the interrelated modules of relevant genes. Enrichment analysis explored the potential functions of SRmRNAs, and 101 machine learning algorithms were used to construct prognostic features. The TCGA-KIRC and GSE29609 cohorts were designated as training and validation sets, respectively, and samples were divided into low-risk and high-risk groups based on risk scores. Prognostic analysis, immune infiltration assessment, drug sensitivity prediction, mutation landscape analysis, and gene set enrichment analysis (GSEA) revealed significant differences between the two groups. The results showed that in the high-risk group, the infiltration levels of regulatory T cells, activated NK cells, CD8+ T cells, follicular helper T cells, M0 macrophages, memory B cells, and activated CD4+ memory T cells were significantly increased; whereas in the low-risk group, the infiltration levels of monocytes, resting CD4+ memory T cells, resting NK cells, activated mast cells, M2 macrophages, and naive B cells were significantly increased. Additionally, single-cell RNA-seq analysis further confirmed the expression and role of SRlncRNAs in ccRCC. In vitro cell experiments (CCK-8, Transwell, etc.) indicated that downregulation of EMX2OS promoted proliferation, migration, and invasion of ccRCC cells, while downregulation of LINC00944 inhibited these processes. Mouse experiments also demonstrated that tumors in the EMX2OS-silenced group had significantly increased volume and weight, while tumors in the LINC00944-silenced group had significantly decreased volume and weight. In the lung metastasis model, the EMX2OS-silenced group had more lung metastatic lesions, while the LINC00944-silenced group had fewer metastatic lesions.
2
Research Background
Clear cell renal cell carcinoma (ccRCC) is a common malignant tumor of the urogenital system, characterized by heterogeneity. Among various types of RCC, ccRCC has the highest risk of metastasis compared to papillary and chromophobe renal tumors. Stem cells are key factors in tumor progression, recurrence, and metastasis. Long non-coding RNAs (lncRNAs), which are transcripts longer than 200 nucleotides, can regulate gene expression through cis or trans regulatory mechanisms. Studies have shown that lncRNAs are involved in proliferation, apoptosis, epithelial-mesenchymal transition, and metastasis. However, the impact of stemness-related long non-coding RNAs on tumors, particularly the influence of SRlncRNAs on ccRCC prognosis, remains unknown. Our goal is to investigate the role of SRlncRNAs in tumor progression in ccRCC.
3
Research Results
1. Screening of SRlncRNAs and SRmRNAs
syn3156503 includes 78 stem cell lines and 151 non-stem cell lines. The Ostrom algorithm was used to establish a predictive model for mRNAsi. Subsequently, the RNAss of all samples in the TCGA-KIRC cohort was calculated. First, we detected outliers based on the lncRNA expression matrix and found no outliers. In WGCNA, the soft threshold β was set to 6 (Figure 1B). An appropriate power value was selected to construct a co-expression network, resulting in the identification of 15 modules, each represented by a different color (Figure 1C). The correlation between modules and RNAss was calculated and displayed in a heatmap (Figure 1D). Among all module-RNAss relationships, the MEgrey module exhibited the highest correlation. Feature genes were extracted from the MEgrey module, including 2773 lncRNAs. Within the MEgrey module, the correlation coefficient between module membership (MM) and gene significance (GS) was 0.49. Specifically, the MEorange, MElightcyan, MEblack, and MEtan modules showed the highest correlation with RNAss (all ≥0.5). These modules contained a total of 1907 mRNAs (Figure 1 E-H).
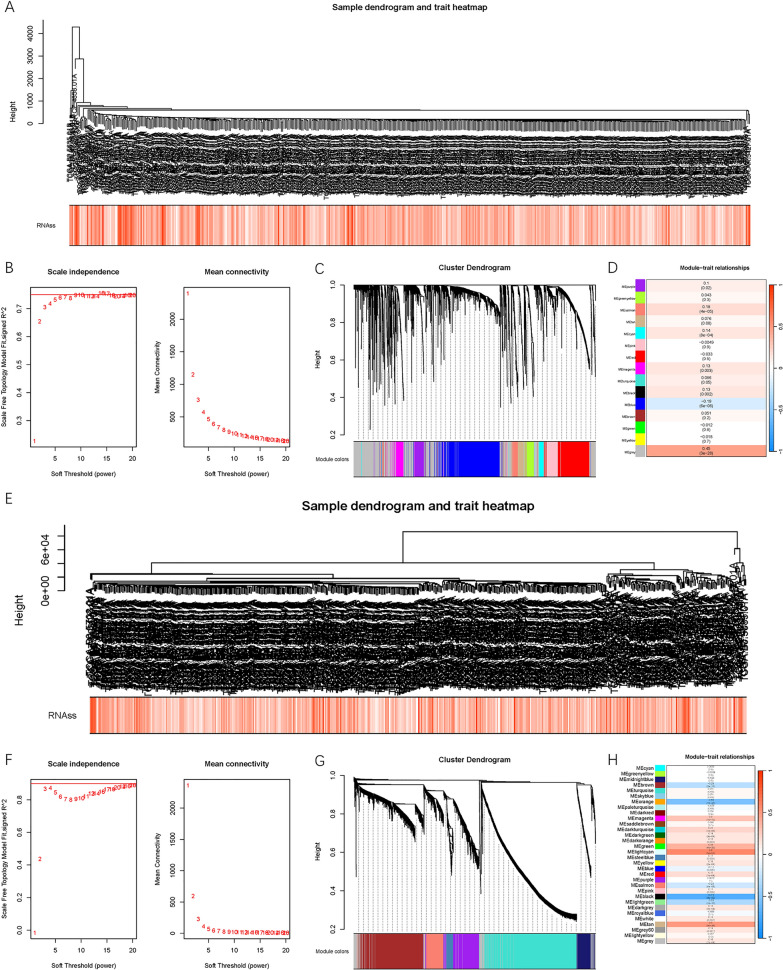
Fig.1 SRlncRNAs and SRmRNAs were identified by WGCNA method.
2. Enrichment analysis of SRmRNAs
We identified 787 DEGs from SRmRNAs, including 413 upregulated and 374 downregulated mRNAs (Figure 2A). Additionally, in 100 normal control groups, 66 upregulated SRlncRNAs and 99 downregulated SRlncRNAs were found (Figure 2B). GO and KEGG analyses were performed. GO analysis showed that DEGs were mainly enriched in BP components such as positive regulation of neurogenesis, gland development, and positive regulation of neuron differentiation. CC class DEGs were mainly enriched in nuclear chromatin, transcription factor complexes, and nuclear transcription factor complexes, while MF class DEGs were mainly enriched in DNA binding transcription factor activity and DNA binding transcription repressor activity. KEGG pathway analysis indicated that DEGs were mainly enriched in pathways related to EB virus infection, transcriptional dysregulation in cancer, cellular senescence, and TGF-β signaling (Figure 2D).

Fig.2 Potential functions of differentially expressed stemness-related genes.
3. Construction of SRlncRNA tags and ceRNA network
In the TCGA-KIRC cohort, SRlncRNA features were established using 101 algorithm combinations through the LOOCV framework (Figure 3A). The C-index of the two cohorts was used to evaluate the predictive ability of the algorithms, with LASSO regression combined with stepwise COX regression showing the best fit, achieving the highest average C-index of 0.716. In this model, LASSO regression was used to select SRlncRNAs associated with survival (Figure 3B, C). Using the LOOCV framework, the optimal λ was reached when the likelihood ratio deviation was minimized, including AC138150.2, AL109741.1, Z95115.1, LINC01711, LINC00944, AC245128.3, USP27 X-AS1, AC002070.1, EMX2OS, and AL162586.1. We further conducted multivariable COX proportional hazards analysis to determine the coefficients of each SRlncRNA. Among the SRlncRNAs included in the signature, LINC 01711, LINC00944, AC245128.3, and AL162586.1 were identified as risk factors (HR>1, P<0.05), while AC002070.1 and EMX2OS were classified as protective factors (HR<1, P<0.05).
After calculating the risk scores using the above formula, patients were divided into low-risk or high-risk groups based on the median. Survival analysis showed that patients in the high-risk group had worse prognosis than those in the low-risk group (P<0.001, Figure 4A). A heatmap was constructed to describe the types and expression levels of SRlncRNAs across all samples (Figure 4B). As the risk score increased, the 1-year, 3-year, and 5-year survival rates of patients had AUCs of 0.762, 0.761, and 0.792, respectively (Figure 4D). The C-index of 142 published ccRCC signatures showed that the SRlncRNA signature ranked highest among all publicly available signatures in the TCGA cohort (Figure 4E).
Using data from the GSE29609 cohort to validate the signature, 30 patients with complete information were extracted, and risk scores were calculated for each patient for risk stratification, with patients scoring above or below the median divided into high-risk and low-risk groups. The OS of patients in the high-risk group was significantly shorter than that of patients in the low-risk group (P < 0.001, Figure 5A). A heatmap of expression for each patient was plotted in ascending order of risk score (Figure 5B). As the risk score increased, the proportion of deceased patients also increased, and the ROC curve indicated that the AUC values for predicting 1-year, 3-year, and 5-year survival were 0.800, 0.868, and 0.851, respectively. The SRlncRNA signature demonstrated good predictive value in the GSE29609 cohort (Figure 5E). This ceRNA network includes EMX2OS, four SRmRNAs, and five miRNAs.

Fig.3 Establishment and validation of the prediction models.
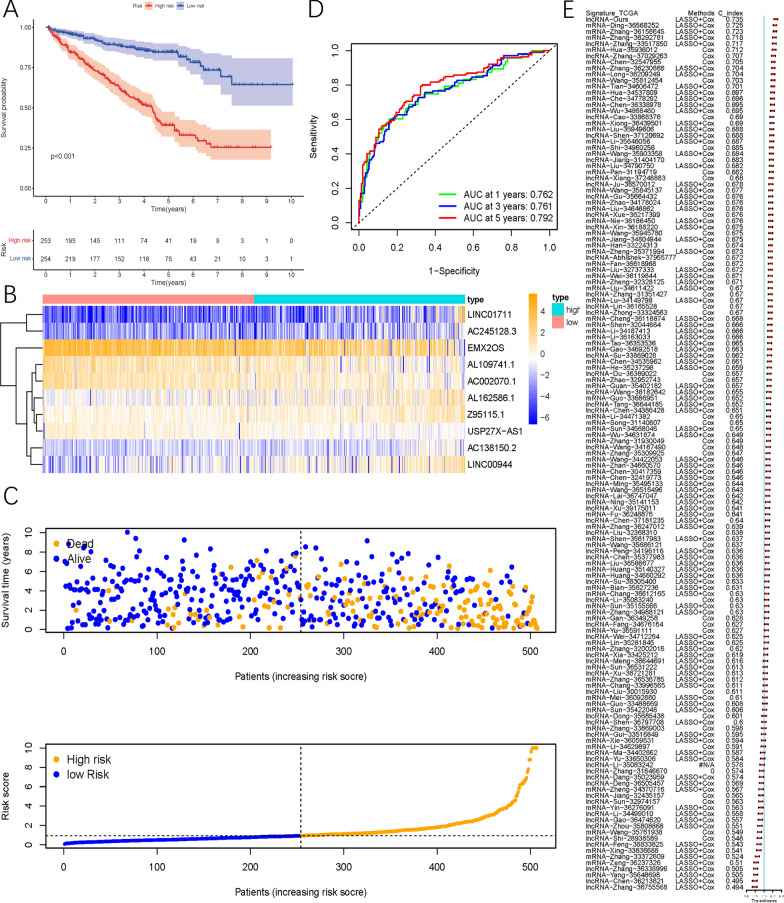
Fig.4 Development and evaluation of SRlncRNA signature related to OS in TCGA cohort.
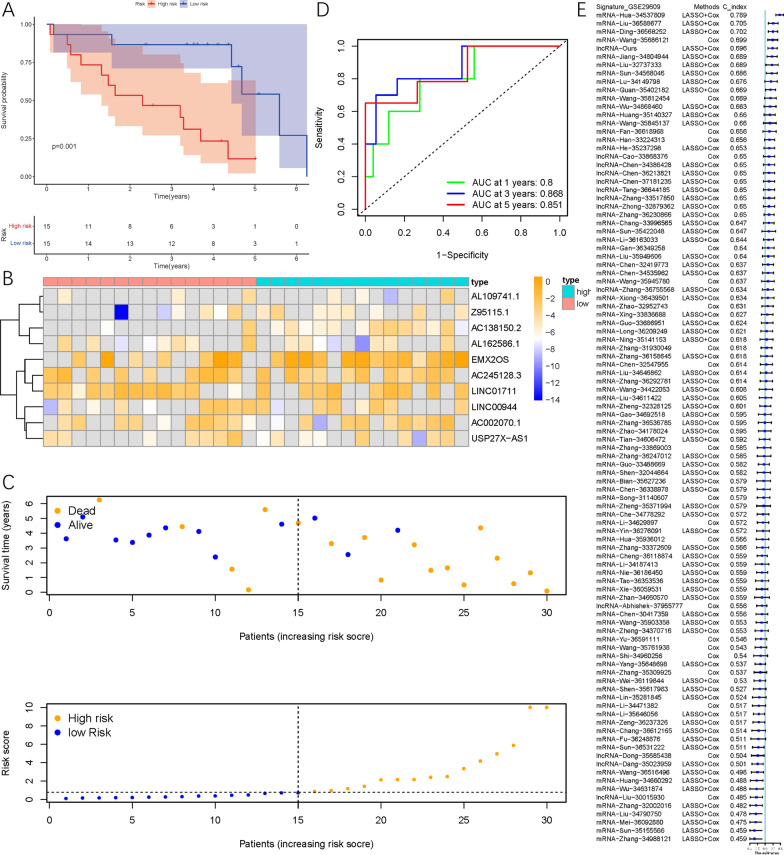
Fig.5 Validation of SRlncRNA signature related to OS in GSE29609 cohort.
4. Functional Analysis
We further analyzed the potential biological mechanisms leading to differences between the low-risk and high-risk groups, identifying significantly enriched KEGG and GO pathways through GSEA. The results indicated that pathways such as alpha-linolenic acid metabolism, cytokine receptor interaction, endometrial cancer, homologous recombination, and the intestinal immune network for IgA production were mostly enriched in the high-risk group, while primary immunodeficiency, prostate cancer, proximal tubule bicarbonate reclamation, tight junctions, and vasopressin-regulated water reabsorption were enriched in the low-risk group (Figure 6A). The enrichment of GO pathways is shown in Figure 6B.
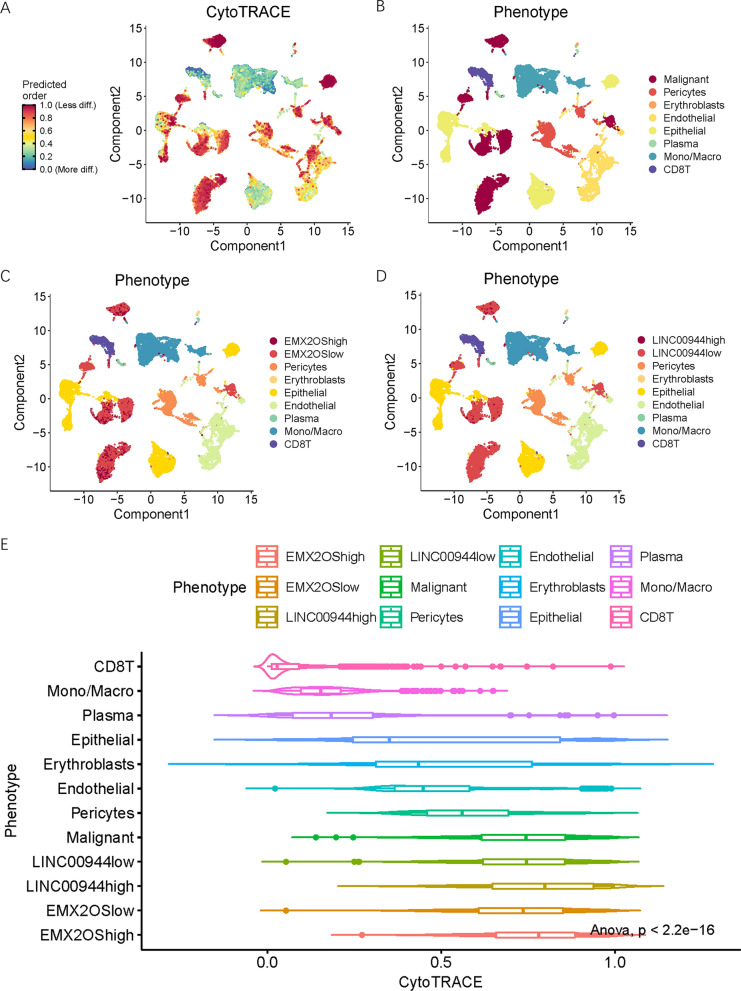
Fig.6 The enriched KEGG A and GO
5. Immune Infiltration
Samples from the low-risk and high-risk groups exhibited different immune infiltration characteristics. The TIMER algorithm showed that neutrophils and myeloid dendritic cells were more abundant in the high-risk group. The CIBERSORT algorithm confirmed that T regulatory cells (TcB), activated NK cells, CD8+ T cells, follicular helper T cells, M0 macrophages, and memory B cells were significantly higher in the high-risk group, while monocytes, resting CD4+ memory T cells, resting NK cells, activated mast cells, M2 macrophages, and naive B cells were significantly higher in the low-risk group. ssGSEA results indicated that samples in the high-risk group had significantly higher immune function and immune cell type scores (Figure 7 C, D). We used the TIDE algorithm to predict the responses of high-risk and low-risk groups to immune checkpoint inhibitors (Figure 7 E). The TIDE score was significantly lower in the high-risk group, and we utilized the SubMap algorithm to compare different risk groups with published immunotherapy cohorts, including 47 melanoma samples. In the CheckMate cohort, higher expression levels of EMX2OS correlated with better prognosis for ccRCC patients undergoing immunotherapy (Figure 7 G, H).
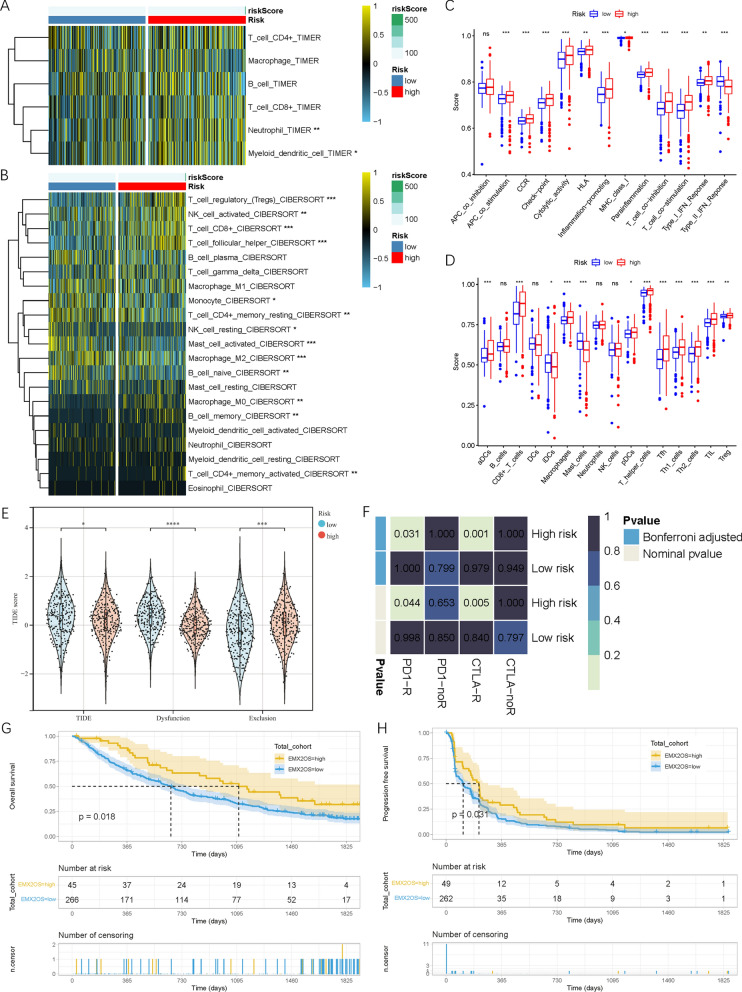
Fig.7 Immune microenvironment and immunotherapy efficacy of samples in low- and high-risk groups.
6. Drug Sensitivity Analysis
Drug sensitivity predictions for all samples revealed that low-risk and high-risk groups exhibited different sensitivity to candidate drugs. Specifically, samples in the low-risk group were more sensitive to cabozantinib, lapatinib, and docetaxel (Figure 8A). In contrast, samples in the high-risk group showed higher sensitivity to JNK inhibitor VIII, RO-3306, and roscovitine. The intersection of these analyses identified seven drugs: thalidomide, doxorubicin, loperamide, paclitaxel, testosterone, benperidol, and nadolol (Figure 8B).
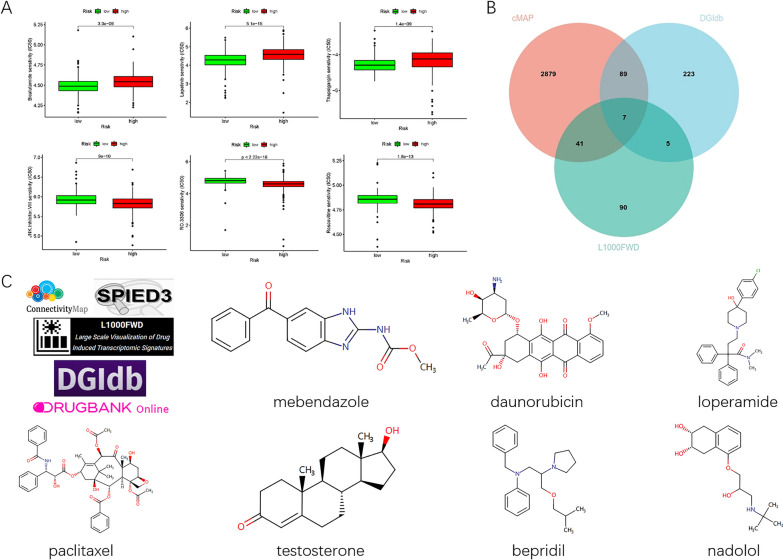
Fig.8 Potential therapeutic drugs for ccRCC based on SRlncRNA signature.
7. Mutation Analysis
Mutation analysis revealed that the top five mutated genes in the TCGA-KIRC cohort were VHL, PBRM1, TTN, SET2, and BAP1, with missense mutations being the most common variant type. Single nucleotide polymorphisms (SNPs) were the most common variant type, with the highest mutation frequency being the “C>T” type. Co-mutation analysis indicated that the frequency of co-occurring mutations among the top 10 mutated genes was significantly higher than expected, notably, the SETD2-PBRM1 pair was the most common co-occurring mutation pair, while BAP1-PBRM1 showed low mutual exclusivity. Both the low-risk and high-risk groups shared the same top four genes with the highest mutation frequency: VHL, PBRM1, TTN, and SET2 (Figure 9A, B). The variant classification, variant type, and SNV categories were similar between the low-risk and high-risk groups (P <0.05, Figure 9C, D). However, compared to the low-risk group, patients in the high-risk group exhibited significantly higher frequencies of BAP1 and SETD2 mutations. Additionally, calculating the TMB for all samples revealed that the TMB was significantly higher in the high-risk group compared to the low-risk group (P <0.01, Figure 9F).
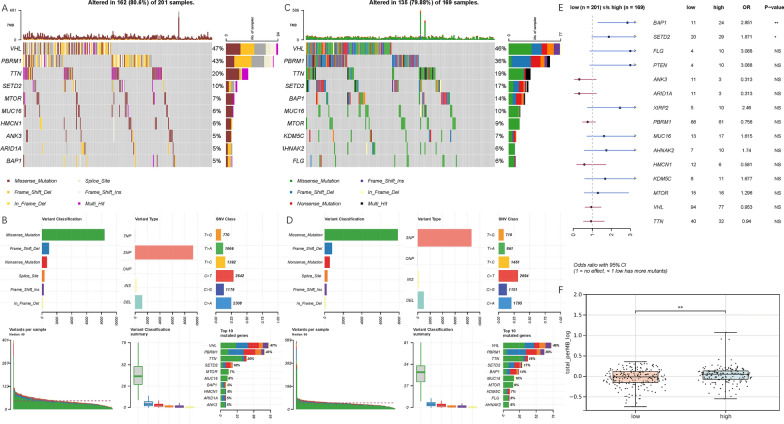
Fig.9 Mutation analysis of the samples of ccRCC.
8. Construction of Prognostic Prediction Model
Samples with complete demographic, clinical, pathological, and prognostic records were selected to plot a nomogram. Univariate analysis identified age, grade, stage, T stage, M stage, and risk score as potential predictors of OS. Multivariable Cox regression analysis showed that (HR 1.032, 95% CI 1.016-1.048, P<0.001), grade (I and II – reference; III – HR 1.491, 95% CI 0.994-2.235, P=0.053; IV – HR 2.152, 95% CI 1.306-3.547, P=0.003), T stage (T1 – ref; T2 – HR 1.084, 95% CI 0.607-1.938, P=0.784; T3 – HR 1.762, 95% CI 1.137-2.732, P=0.011; T4 – HR 2.317, 95% CI 0.970-5.535, P=0.059), M stage (M0 – ref; M1 – HR 2.592, 95% CI 1.734-3.876, P<0.001), risk score (HR 1.010, 95% CI 1.005-1.015, P<0.001), but did not affect normal work. Figure 12 shows the CNV landscape of ccRCC in the GSE159115 cohort. CNV heatmap of all cell types. B CNV scores of all cell types in UMAP plot. C Different CNV scores in eight types of cells. D Different CNV scores in epithelial cells, EMX2OS low expression, EMX2OS high expression, LINC00944 low expression, and LINC00944 high expression malignant cells. Based on these factors, a nomogram was constructed to predict OS, integrating clinical and pathological features with the new SRlncRNA-related prognostic markers, achieving a C-index of 0.770 (95% CI 0.751-0.790).
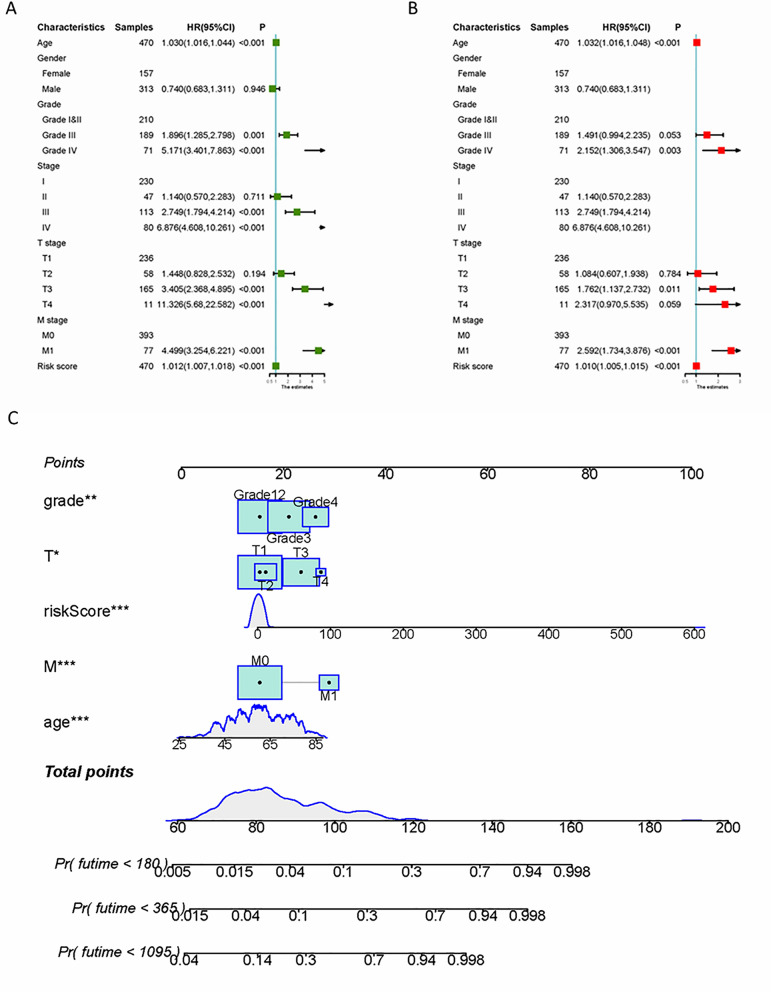
Fig.10 Construction of the prognostic prediction model.
9. Single-Cell and Spatial Transcriptomics of SRlncRNAs
We analyzed the scRNA-seq landscape of ccRCC to elucidate the expression patterns of SRlncRNAs and their potential roles in tumor progression. Using the Uniform Manifold Approximation and Projection (UMAP) method, 33 clusters were identified and visualized (Figure 11 A). Based on previous reports and marker gene expression, cells were classified into eight different types: malignant cells, monocytes/macrophages, epithelial cells, plasma cells, endothelial cells, CD 8 T cells, erythrocytes, and pericytes (Figure 11B). The expression of EMX2OS and LINC00944 was recorded in the GSE159115 cohort. We further divided malignant cells into high and low expression groups of EMX2OS and LINC00944. When comparing the expression of EMX2OS and LINC00944 between epithelial and malignant cells, we observed that EMX2OS expression was significantly lower in malignant cells compared to epithelial cells, while LINC00944 expression was significantly higher (P<0.05, Figure 11 E-G). Pseudotime trajectory analysis elucidated the developmental trajectory of cells from epithelial to malignant states (Figure 11 H, I). Both epithelial and malignant cells exhibited three different states during this transition. Notably, during this development, the expression of EMX2OS and LINC00944 underwent significant changes (Figure 11 J, K). This suggests that they may be involved in mediating the transition from a normal phenotype to a malignant phenotype. In the LINC00944 high expression group and the LINC00944 high and low expression groups, cells maintained their presence in three different states, with only subtle changes observed in their developmental trajectories (Figure 11 L-O).
We calculated the CNV scores for each cell type, revealing different characteristics of malignant cells (Figure 12 A, B). Compared to other cell types, malignant cells exhibited significantly elevated CNV scores (Figure 12 C). Among the malignant cell population, cells with high expression of LINC00944 exhibited higher CNV scores than those with low expression of LINC00944. We also investigated the association between SRlncRNA expression and CytoTRACE scores (Figure 13 A-D). Among all cell types, malignant cells exhibited the highest CytoTRACE scores (Figure 13 E), and the expression of both EMX2OS and LINC00944 was significantly correlated with CytoTRACE scores.
To further understand the spatial expression patterns of EMX2OS and LINC00944 in ccRCC, we conducted a comprehensive analysis of spatial transcriptome sequencing data obtained from representative tumor-normal interfaces (Figure 14 A, D). Cell type annotations are displayed in Figure 14 C, F. The expression of EMX20S and LINC00944 was unevenly distributed between tumor and normal tissues in ccRCC (Figure 14 B, E).

Fig.11 Single cell landscape of ccRCC in GSE159115 cohort.
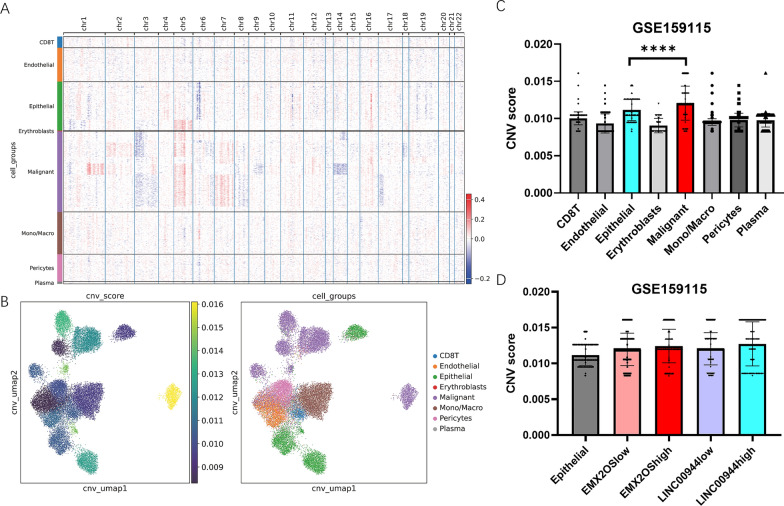
Fig.12 CNV landscape of ccRCC in GSE159115 cohort.
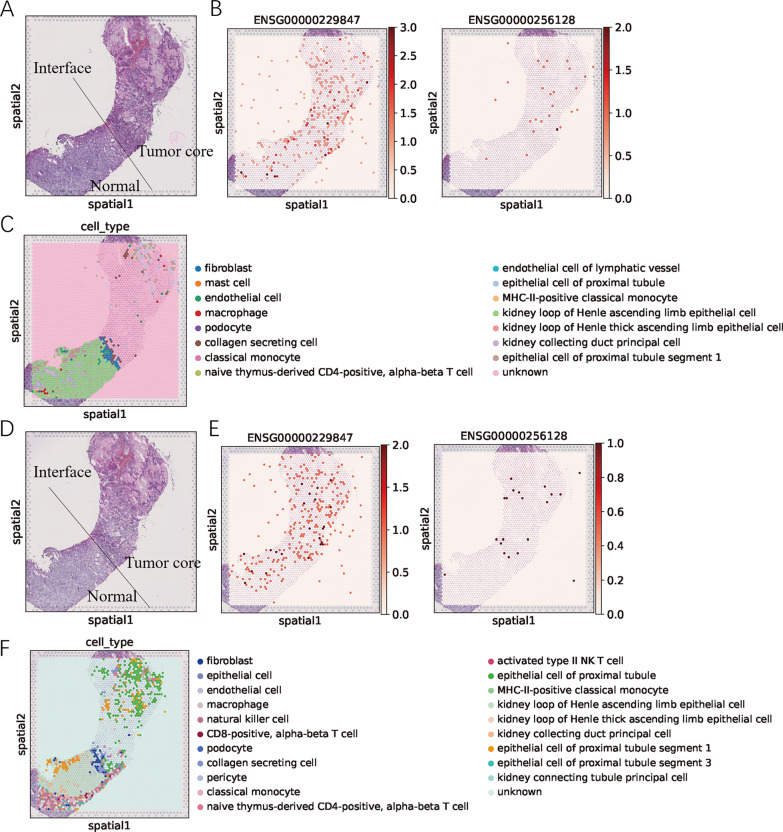
Fig.13 CytoTRACE landscape of ccRCC in GSE159115 cohort.
Fig.14 Spatial transcriptome sequencing data of 2 slices from a ccRCC patient.
10. Downregulation of EMX2OS and LINC00944 Affects Proliferation, Migration, and Invasion of ccRCC Cells In Vitro
We utilized targeted shRNA to specifically knock down the expression of EMX2OS and LINC00944 in ccRCC cell lines, achieving effective knockdown efficiency for both targets (Figure 15A). To assess the proliferative capacity of these cells, CCK-8 and colony formation assays were conducted. Our results indicated that knockdown of EMX2OS significantly promoted proliferation of ccRCC cells, while knockdown of LINC00944 significantly inhibited their proliferation (Figure 15B, C). Additionally, we performed Transwell assays to study the effects of EMX2OS and LINC00944 on cell migration and invasion, revealing that knockdown of EMX2OS enhanced cell migration and invasion, while knockdown of LINC00944 suppressed these processes (Figure 15D, E). Furthermore, wound healing assays were conducted to evaluate the migratory capacity of ccRCC cells, revealing increased migratory ability after EMX2OS knockdown and decreased migratory ability after LINC00944 knockdown (Figure 16 A; for all comparisons, P < 0.001).
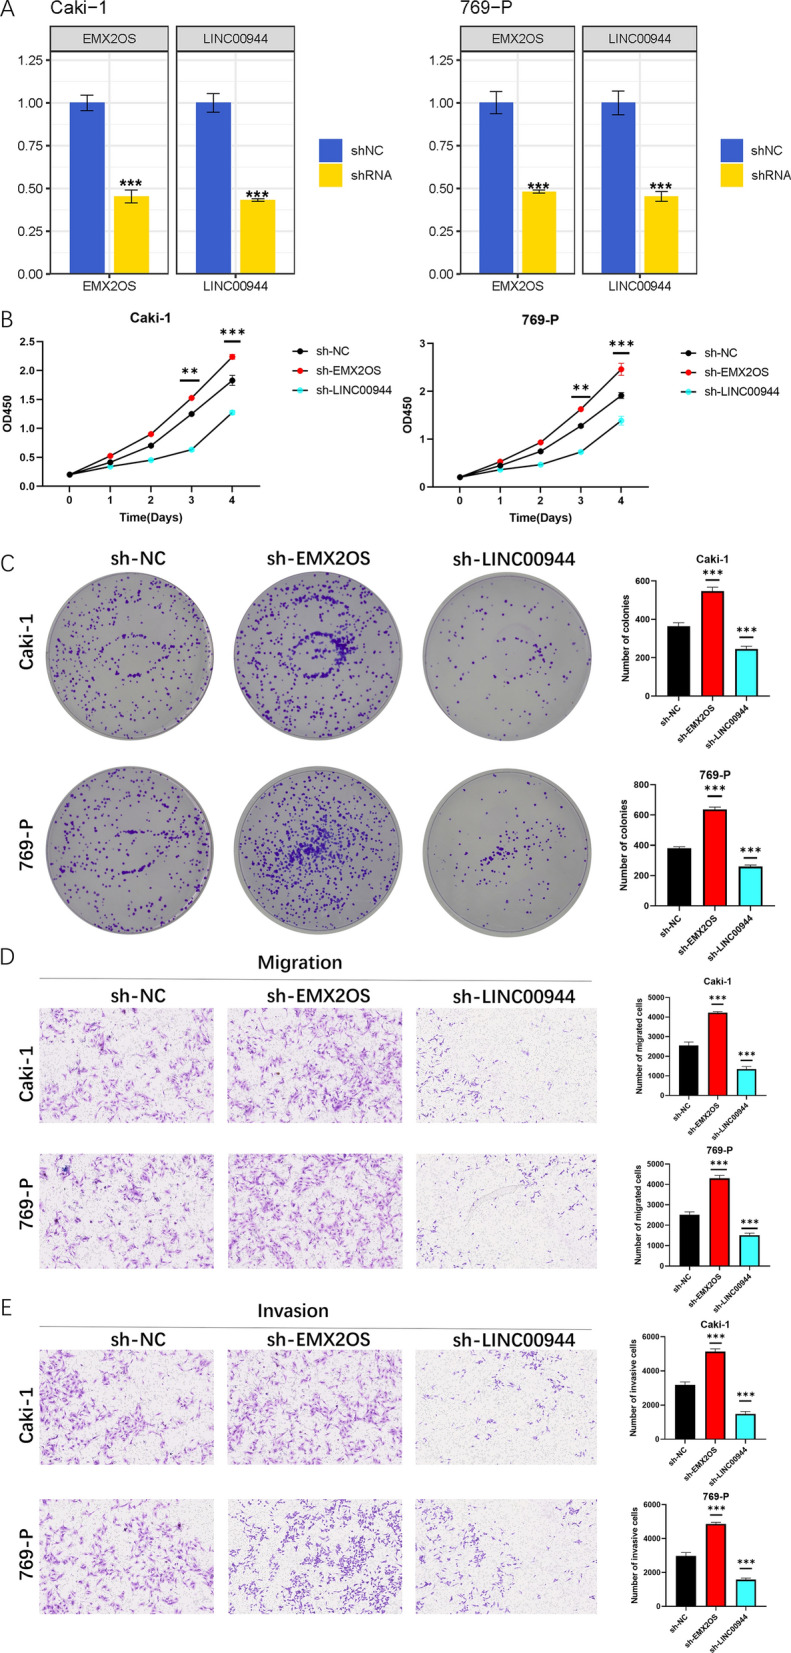
Fig.15 Downregulation of EMX2OS promoted ccRCC cell proliferation, migration and invasion, while downregulation of LINC00944 suppressed them.
11. Effects of Downregulation of EMX2OS and LINC00944 on Apoptosis and Cell Cycle of ccRCC Cells
We analyzed apoptosis and cell cycle processes using flow cytometry, finding that knockdown of EMX2OS inhibited apoptosis in ccRCC cell lines, while knockdown of LINC00944 promoted apoptosis in ccRCC cell lines (Figure 16 B). Specifically, after knockdown of EMX2OS, the number of ccRCC cells in the G0/G1 phase decreased, while the number of cells in the S phase correspondingly increased. Knockdown of LINC00944 led to an increase in ccRCC cells in the G0/G1 phase and a decrease in cells in the S phase (Figure 16 C).
12. Downregulation of EMX2OS and LINC00944 Enhances Stemness of ccRCC
The changes in stemness and related genes after silencing EMX2OS and LINC00944 were studied. Downregulation of EMX2OS upregulated the mRNA and protein levels of CD133, EPCAM, and EMXSOX2, promoting cell sphere formation (Figure 17 A, B). In contrast, downregulation of LINC00944 downregulated the expression of stemness-related genes and inhibited sphere formation (Figure 17 A, B). Organoid models derived from ccRCC patients were successfully established, and shRNA targeting EMX2OS and LINC00944 was transfected into ccRCC organoids (Figure 17 C). Knockout of EMX2OS promoted the growth of ccRCC organoids, while silencing LINC00944 inhibited the growth of ccRCC organoids (Figure 17 D). Immunofluorescence showed that the expression of KI 67 changed after silencing SRlncRNAs, consistent with the observed changes in organoid growth (Figure 17 E). To further evaluate the roles of EMX2OS and LINC00944 in ccRCC growth and metastasis in vivo, we established xenograft mouse and lung metastasis models. The xenograft tumor model showed that tumors in the sh-EMX2OS group had significantly increased size and weight, while tumors in the sh-LINC00944 group had significantly decreased size and weight (Figure 17 F). We observed a similar trend in the lung metastasis model, with the sh-EMX2OS group having more lung metastatic lesions and the sh-LINC00944 group having fewer lesions (Figure 17 G).
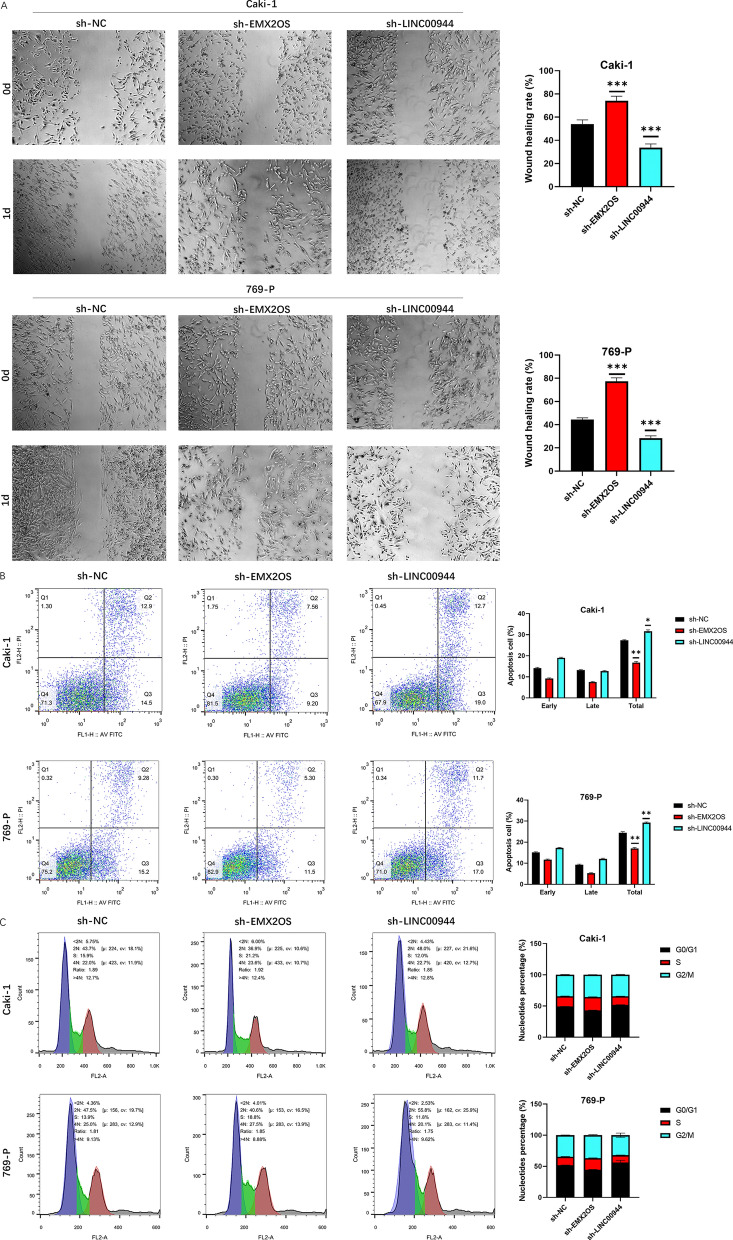
Fig.16 Downregulation of EMX2OS promoted ccRCC cell migration, suppressed apoptosis, and increased S phase entry, while downregulation of LINC00944 appeared the opposite effects.
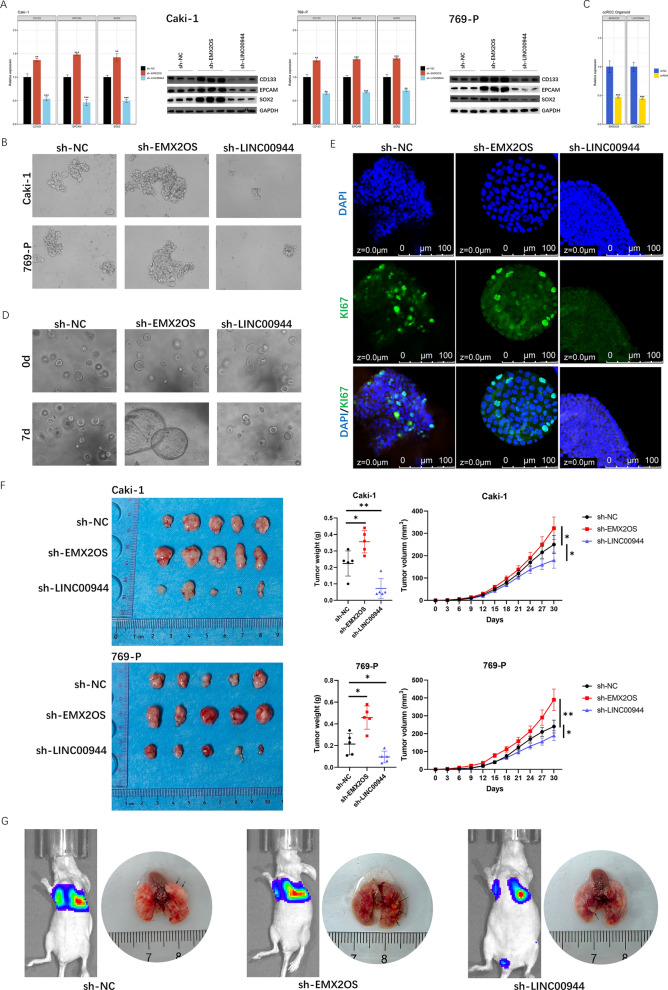
Fig.17 Downregulation of EMX2OS enhanced the stemness of ccRCC, whereas Downregulation of LINC00944 reduced the stemness of ccRCC.
4
Research Summary
Based on RNAss and WGCNA, SRlncRNAs and SRmRNAs were identified, and LASSO combined with multivariate COX regression screened prognostic-related SRlncRNAs. Six SRlncRNAs constructed prognostic features. Samples in the low-risk and high-risk groups confirmed the differential expression of SRlncRNAs in ccRCC tumors and normal tissues through prognostic analysis, GSEA enrichment, immune infiltration, drug sensitivity, scRNA-seq, and RT-qPCR. In vitro and in vivo experiments confirmed that downregulation of EMX2OS and LINC00944 affected the proliferation, migration, invasion, apoptosis, and metastasis of ccRCC cells.