 This article contains a total of 6783 wordsEstimated reading time is about 15minutesLast night at 10 PM, I was called into the office by the director.“Max, Max, the equipment procurement plan for the new production line shows a loading of only 68%, but I just spoke with the process team, and they said the equipment is simply insufficient. Please recalculate and get it to me by 9 AM tomorrow.”As I walked out of the office, I felt a chill down my back. Each core piece of equipment for this line costs over ten million; if my calculations are wrong and we face a capacity shortfall, this could cost me my job…This is not a joke, but a life-and-death moment that every semiconductor IE might encounter.
In traditional manufacturing, calculating capacity is straightforward: UPH × hours × OEE. However, in practice, especially in semiconductors, this approach can lead you to question your very existence. Why? Because:
-
The process can be long enough to circle the “earth half a time”(starting with hundreds of processes)
-
The same equipment can perform over 15 processes(with different UPH for each step)
-
Equipment costs as much as a house in Shenzhen(average price over 10 million)
-
Product combinations are as complex as “girl group debut positions”(mixing over 10 products is common)
Today, we will delve into:How semiconductor IEs assess capacity to minimize decision-making risks in the millions?
Capacity assessment is a fundamental skill for IEs. In this article, we will analyze how IEs evaluate capacity, focusing on the following points:(1) Definition of capacity(2) Goals of capacity assessment(3) Data preparation before calculation
-
Tool ID/EQ Group(Assigning “ID cards” to equipment)
-
Flow Data(Without it, everything is moot)
-
Capacity for Process Data(managed categorically)
-
Prod Mix (Product mix, the soul variable)
-
Conversion within EQ Group (2 old machines + 1 new machine = ? new machines?
-
Does using harmonic mean underestimate capacity?(The misunderstood “conservative algorithm”)
-
Applicability of harmonic mean supplement(A brain-teaser case)
(4) Calculation logic of EQ capacity model (static)(5) Calculation logic of EQ capacity model (dynamic)(6) Calculation logic of DL manpower model
■ Standard definition of capacity:
First, let’s clarify: what exactly is capacity?
Production capacity refers to the maximum output rate of a work unit. This unit can be a process, a piece of equipment, or an entire organizational entity. This definition aligns remarkably with the career development model for IEs mentioned in the first article. The career development of an IE spans from the field to operations, while the scope of production capacity encompasses people, equipment, and organizational management. Therefore, broadly speaking, production capacity is the sum of personnel capability, equipment capability, and management capability.Personnel capability refers to the combination of factors such as the number of personnel, actual working hours, attendance rates, and technical levels; equipment capability refers to the combination of factors such as the quantity, level, operating rate, and availability of equipment and production area; management capability includes the maturity of management personnel’s experience and the level of application of management theories, methods, and work attitudes. In a narrower sense, production capacity mainly refers to personnel and equipment capabilities, especially in capital-intensive manufacturing enterprises, where it primarily refers to equipment capability.Production capacity assessment and decision-making are complementary. There are three dimensions to measure production capacity: design production capacity, effective production capacity, and actual output.Design production capacity: is the maximum possible output under ideal conditions (with no time losses), referring to the output capability when equipment operates continuously. It represents the maximum output capacity in a technical sense.Effective production capacity: refers to the maximum output capability of equipment under given product combinations, reasonable personnel usage, appropriate time, equipment maintenance, production planning, and quality assurance arrangements. It is an economically meaningful output capacity, which is less than design production capacity.Actual output: is the actual system output, which is usually less than effective production capacity. It excludes unforeseen capacity losses due to machine failures, labor shortages, material shortages, quality issues, etc.Production efficiency: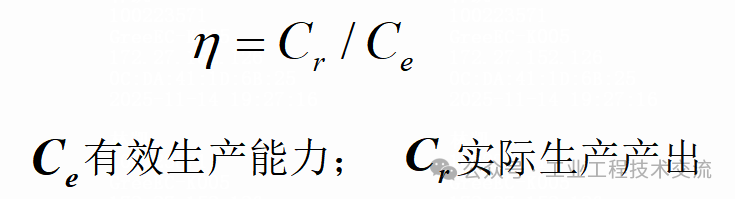
Production utilization rate:
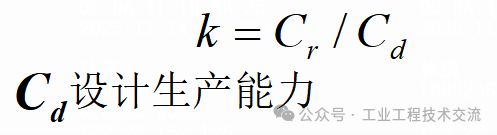
 The utilization rate of capacity is often not 100% and should leave a certain buffer, known as capacity cushion (Capacity Cushion): Capacity Cushion = 1 – utilization rate. In capital-intensive enterprises, equipment costs are high, so the capacity cushion is usually small (10%).Key question:Why distinguish these three? Because when the boss asks “What is the capacity?” you need to first ask back: “Which one are you asking about?” Answering incorrectly could be fatal.
■ Goals of capacity assessment
Ultimate KPI: Calculate Loading
Loading (load rate) = Actual working time of equipment/personnel ÷ Available time × 100%The primary indicator for IEs conducting capacity assessments is calculating “Loading”.In the field of industrial engineering (IE), loading typically refers to the proportion of work assigned to equipment or personnel relative to their workload, used to measure resource utilization.Equipment loading: refers to the percentage of time that equipment actually spends on production tasks compared to its available time, reflecting the busyness of the equipment. For example, if a piece of equipment is available for 8 hours a day and actually spends 6 hours on production tasks, then the loading for that equipment is 6÷8×100%=75%. High loading may indicate that the equipment is running close to full capacity, necessitating attention to whether it may lead to fatigue, failure, or affect product quality; low loading may indicate that the equipment is underutilized, requiring optimization of task allocation or consideration of equipment adjustments.Personnel loading: refers to the percentage of actual working time of operators compared to their available working time, reflecting the intensity of personnel work. For example, if a worker can work 8 hours a day and actually spends 6.5 hours on production tasks, then their loading is 6.5÷8×100%=81.25%. Reasonable personnel loading must balance work efficiency and employee fatigue; excessively high loading may lead to employee fatigue, decreased efficiency, or increased errors; excessively low loading may waste human resources, necessitating task optimization or personnel reallocation to improve efficiency.In IE capacity assessments, loading is a key indicator used to balance resource utilization and production efficiency, ensuring that equipment and personnel operate under reasonable loads, using an appropriate number of equipment and manpower to maximize capacity and optimize costs.
■ Data preparation before calculation
(1)Tool ID/EQ Group coding
Due to the long flow in semiconductors and the confidentiality of equipment information, and since IEs also manage equipment (superficially), the coding and standardization of equipment is very important. The rules for coding will not be elaborated here; we just need to know that before establishing a capacity model, effective coding of Prod ID, EQ Group, Tool ID, Golden Tool, Match Tool, and Single Tool is required.
After confirming the Golden Tool of the EQ Group, it is necessary to calculate the number of equipment in the EQ Group after conversion, which serves as the supply tool count, and compare it with the calculated demand tool count to determine the required equipment loading. Through loading, the capacity of the equipment can be measured to determine whether additional equipment investment is needed. The detailed data preparation is as follows:
(2)Flow Data
First, the first data table is Flow; without Flow, it is impossible to accurately assess capacity. The core elements of the Flow data table include: Prod ID, Work Area, Stage, Step, Recipe ID, EQ Group, Golden Tool, Match Tool, Future Peak WPH, Current Peak WPH, 1/Peak WPH;(3) Capacity for Process DataBecause the loading thresholds for process equipment and measurement or offline equipment differ, they are generally distinguished in the table. However, the logic remains the same. The key parameters are: EQ Group, Category, Process, Vendor, Golden Tool, OEE, Freq, WPH, Set/1k, Capacity;(4) Prod MixProduction lines cannot produce only one product; therefore, when assessing capacity, there must be a constraint condition, which is the product mix. This can be expressed as a ratio or as precise capacity. IEs need to use loading as a sensitive factor when evaluating equipment, as the factor usually incorporates time dimensions to measure capacity, resulting in a set of capacity combinations that fluctuate over time.(5)Logic for converting the number of devices within EQ Group
When assessing equipment capacity, the evaluation object is EQ Group. When there are different equipment capabilities within the EQ Group, the WPH/OEE of the EQ Group takes the Golden Tool WPH. However, how do we convert the number of devices when different equipment has different OEE and produces different products with different WPH?
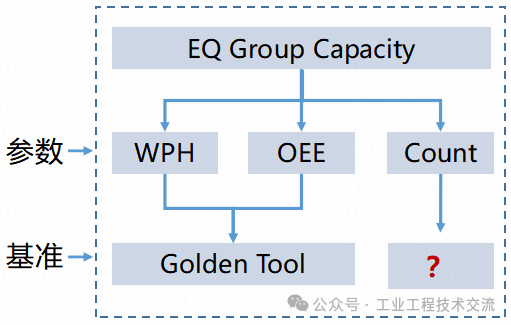
Specific questions include: In the EQ Group, there are two types of equipment A and B, with 2 and 1 units respectively, with OEE of 70% and 80%. A is the Golden Tool, representing products Prod.1:Prod.2=1:3. The WPH for equipment A for the two products is 26 and 20, while for equipment B it is 60 and 45. What is the number of devices and monthly capacity for this equipment group?
First, we convert the problem into a data table for clarity:
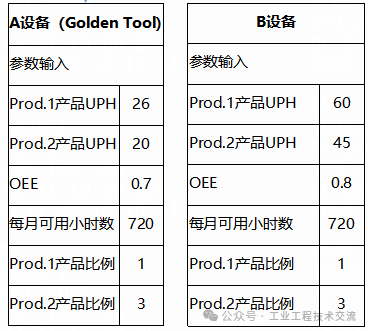
Solving this problem requires a data-driven approach:
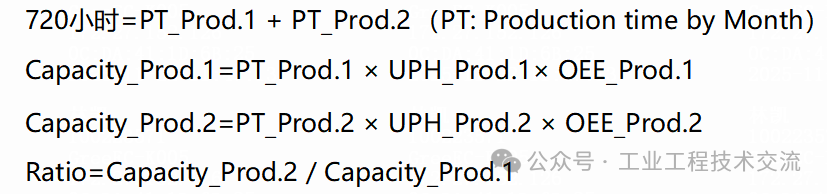 From the following, a two-variable linear equation can be used to determine the capacity of Prod.1 and Prod.2,
 Why calculate the “converted number of devices”?Because equipment capabilities differ, 2 old machines ≠ 1 new machine. The converted Supply Tool (supply) can then be compared with the Need Tool (demand) to calculate the actual loading.(6) Does using harmonic mean underestimate capacity?
Capacity calculation methods: There are two methods for calculating capacity: ① Using harmonic mean WPH for calculation, ② Using actual working hours accumulation method, with equal results: 1/WPH indicates: TT cycle time, how many hours are needed per wafer; cumulative summation refers to the total cycle TT of the EQ Group; 1/Total TT: UPH of the EQ Group; thus, recalculating capacity using harmonic mean does not underestimate capacity but is an accurate calculation method.
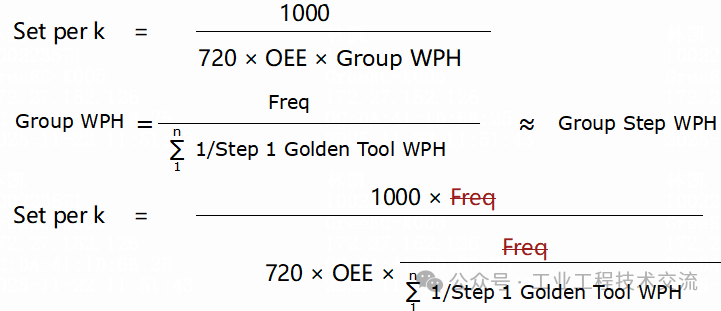
Set per k: the number of devices per thousand wafers, used to calculate the Need Tool under multiple product combinations, and then calculate the EQ Group loading; Need Tool has two calculation methods: ① Calculated through Set per k; ② Calculate each Step Need Tool separately and then sum. Essentially, there is no difference:
 (7) Applicability of harmonic mean supplement
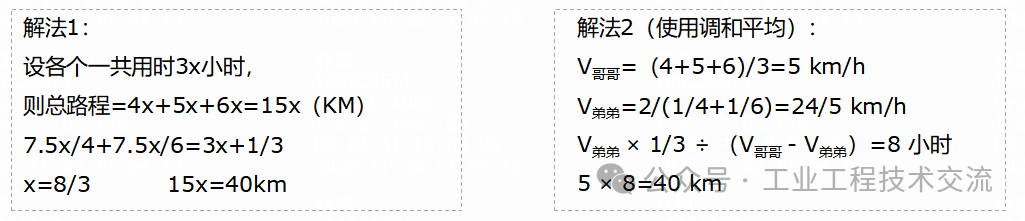
Two brothers set off from point A to point B on bicycles.
The younger brother’s cycling method: – divides the entire distance into two halves: the speed for the first half is 4 km/h, and for the second half, it is 6 km/h.
The older brother’s cycling method: – divides the total time into three equal parts: the speed for the first 1/3 of the time is 4 km/h, the middle 1/3 of the time is 5 km/h, and the last 1/3 of the time is 6 km/h. It is known that the older brother arrives 20 minutes earlier than the younger brother.
Question: How far apart are points A and B?
Arithmetic mean: treats each observation as having “equal weight” and directly adds them up, then divides by the number of observations; applicable in situations where “total = unit × frequency” where frequency (or weight) is known and constant.
Harmonic mean: takes the “unit workload” (speed, unit price, efficiency), first inverts it to become “unit cost”, sums it up, and then inverts it again to get the “average unit cost”; applicable in situations where “total = unit × time” where time (or distance, workload) is the same, but rates differ, or where the total is fixed, and average rate/unit price needs to be calculated.
■ Calculation logic of EQ capacity model (static)
The static capacity model refers to the capacity and equipment loading of the production line under selected representative products and determined product ratios;After completing the above data preparation, we can proceed to calculate the static equipment capacity.
In the previous chapter, we mentioned the concept of Move count; Wafer Move and Wafer Out are two different dimensional parameters. The capacity we define usually refers to Wafer Out. These two parameters are linearly related and can be converted using Freq. Additionally, our loading assessment object is not Tool ID but EQ Group. As we argued in the previous article, the WPH in semiconductors is not calculated using arithmetic mean but rather using harmonic mean, as shown in the formula below:
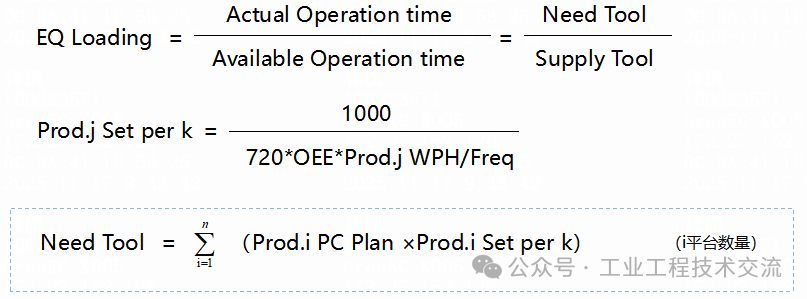
In fact, the harmonic mean is readily available in Excel (HARMEAN), but the semiconductor flow is too long, requiring retrieval of WPH for the same EQ Group from a large amount of data, and then calculating the harmonic mean for the array. Therefore, the model employs a clever algorithm to calculate the harmonic mean. This is one of the parameters in data preparation, “1/Peak WPH“; we can use COUNTIFS and SUMIFS to calculate the harmonic mean.
After calculating WPH, we also need to determine how many devices are required for a thousand wafers, which reflects equipment capability. Why is 1000 wafers used as a conversion factor? There is no special regulation (it varies by IE), as long as decimal places are not omitted to avoid data distortion.
Currently, the capacity of one device has been calculated, and the number of devices required for 1000 wafers has been determined. Next, we can use Prod Mix to convert capacity planning into Need Tool. Here, the SUMPRODUCT function can be used.
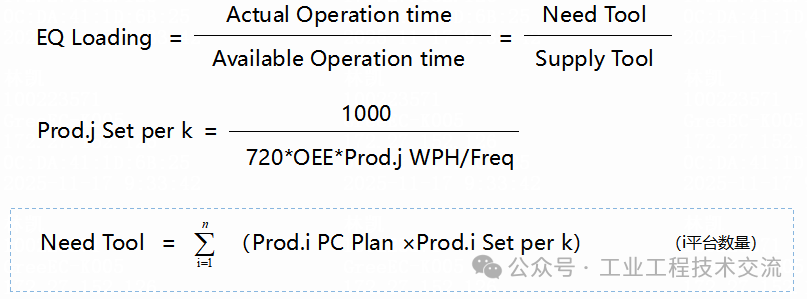
This way, the known product combinations can be calculated based on equipment capability to determine the loading for each equipment group. IEs will assess whether to purchase additional equipment based on different equipment attributes and loading thresholds.
■ Calculation logic of EQ capacity model (dynamic)
Dynamic capacity models refer to the evaluation of equipment loading by IEs using Target OEE and Current Peak WPH dimensions under PC Plan.While static models can effectively address fixed product combinations, if the product mix exceeds 10 types, the logic of static models will require a significant amount of effort in data processing. Therefore, a more efficient method is needed to automatically calculate equipment loading based on different products.
Dynamic capacity is not based on fixed product combinations. If a month has more than 10 products, data processing can become cumbersome. Therefore, the model is broken down, utilizing Excel formulas to fill in and gradually calculate, ultimately automating the loading calculation.
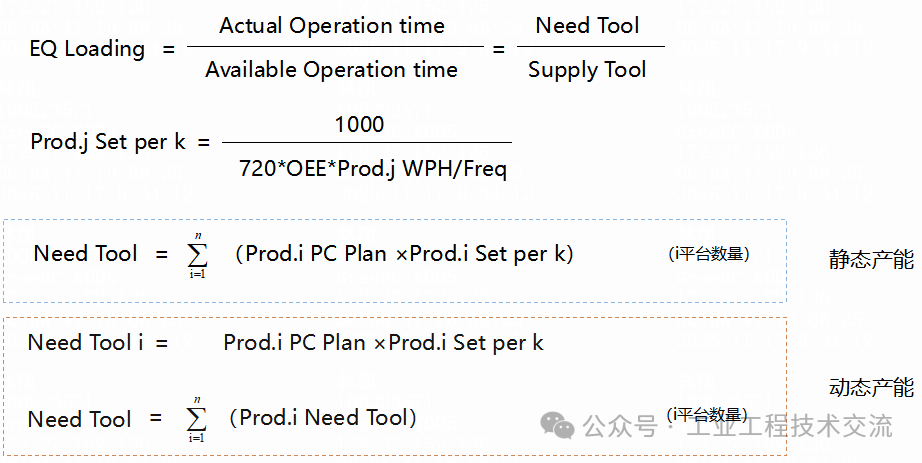
Dynamic capacity assessments generally require IEs to prepare two reports: Capacity Analysis Report (2 pages):No.1 Capacity by month by platform wafer input and utilization rateNo.2 Top 5 Loading of equipment for this month and next month and corresponding product Pareto;
■ DL manpower model calculation logic
Manpower models are essential for every IE to master, focusing on DL manpower. First, data preparation is required: line type, operation method, process, group, personnel, machines, cavity count, C/T, allocation quantity (single), correction factors, allocation quantity, yield, required equipment, man-machine ratio, personnel utilization rate, standard working hours, allocation working time, manpower/shift, manpower per thousand wafers. After data preparation, the calculation case is as follows:
-
Manpower per thousand wafers: the number of people required to produce 1000 pcs/shift;
-
Manpower hours per thousand wafers: the working time required by personnel to produce 1000 pcs/shift;
Solving algorithm:Manpower per thousand wafers = Number of people / Capacity * 1000. For example, if 500,000 units are produced in a single shift with 5 people, the manpower per thousand wafers is 5/250000*1000=0.02Manpower hours per thousand wafers = Manpower per thousand wafers * Shift time = 0.02*10=0.2 hours;
Example:Given a manpower per thousand wafers of 0.02, calculate the manpower required for monthly capacities of 500,000 (N1) and 700,000 (N2).N1=0.02*500000/1000=10 people/shiftN2=0.02*700000/1000=14 people/shift
This algorithm, after accurately calculating manpower hours, needs to evaluate whether to increase manpower based on loading. The assessment of manpower is closely related to capacity planning. In dynamic assessments, a future capacity and standard working hours will be used to calculate manpower, obtaining the manpower per thousand wafers coefficient, which will then be used as the manpower assessment for dynamic capacity. Of course, if the IE does not have a strong on-site sense, it is not recommended to use the manpower per thousand wafers coefficient.
The conclusion: The value of IE is calculated
Is industrial engineering “omnipotent”?
This statement is not just a slogan, but rather the confidence built from countless formulas and a wealth of on-site data, from every percentage in the loading report.
-
When the number of devices you calculate helps the company avoid over ten million in idle investments;
-
When your optimized manpower model ensures that the production line is not short-staffed during peak seasons and does not retain idle personnel during off-seasons;
-
When your dynamic capacity planning allows the boss to confidently guarantee delivery times in front of clients —
At that moment, you will understand:The value of IE is that solid..
Industrial engineering is “omnipotent”. I hope this is not just a slogan, but a tangible proof of value for individuals and enterprises.*Note: A semiconductor industry IE enthusiast and practitioner, welcome to connect!