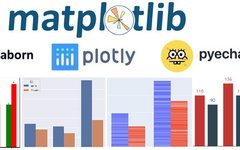
Top 10 User-Friendly Python Visualization Tools

Top 10 User-Friendly Python Visualization Tools

Source: Deep Learning Enthusiasts This article is about 1800 words long and takes about 8 minutes to read. It introduces 10 Python data visualization libraries suitable for multiple disciplines. Today, we will introduce 10 Python data visualization libraries suitable for multiple disciplines, some of which are well-known while others are less recognized. 1. Matplotlib Two … Read more

Core Steps for Python Visualization

Core Steps for Python Visualization

In regular scientific research, the three steps to implement visualization in Python are: Identify the problem and choose the graph Transform data and apply functions Set parameters for clarity 1. First, what libraries do we use for plotting? matplotlib The most basic plotting library in Python is matplotlib, which is the foundational library for Python … Read more

Introduction to Python Data Visualization

Introduction to Python Data Visualization

What is Data Visualization? Data visualization is aimed at making data more efficiently reflect the situation of the data, facilitating readers to read more efficiently, and highlighting the patterns behind the data to emphasize important factors within the data. If you are using Python for data visualization, it is recommended to master the following four … Read more