Sometimes, writing code doesn’t always have to be about complex data analysis or websites.You can also use Python to draw! Isn’t that a bit cool?
Today, let’s use Python to draw a few simple and beautiful graphics. Although they look like works of art, they actually only require a few lines of code.
We’ll talk about how to use Python’s graphic libraries turtle and matplotlib to accomplish this.
turtle: Let Code Draw
First, let’s talk about turtle, which is a graphic library in Python. You can think of it as a virtual little turtle running around the screen with a paintbrush. We give it instructions, and it will draw all kinds of shapes.
Draw a Simple Square
import turtle
# Create canvas and turtle
t = turtle.Turtle()
# Draw a square
for _ in range(4):    t.forward(100)  # Move forward 100 steps    t.left(90)      # Turn left 90 degrees
turtle.done()  # End
In this code, we make the turtle move 100 steps and then turn left 90 degrees each time, ultimately drawing a square. Isn’t it simple? Not hard, right!
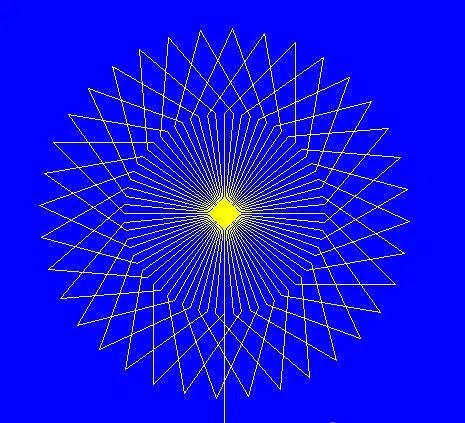
Draw a Star
Let’s try something a bit more complex and draw a star. Although a star looks a bit difficult, it’s actually just a small exercise.
import turtle
t = turtle.Turtle()
# Draw a star
for _ in range(5):    t.forward(100)  # Move forward 100 steps    t.right(144)    # Turn right 144 degrees
turtle.done()
The method to draw a star is very simple, the key is that its angle is 144 degrees (this is a mathematical theorem). Each step forward, turn 144 degrees, and you’ll draw a perfect star.
Tip: The turtle library will pop up a window, don’t forget to write <span>done()</span> to end the drawing and avoid the window suddenly disappearing after the program ends.
matplotlib: Draw More Complex Shapes
Next, let’s use matplotlib to draw. This is a library used for plotting data charts, but we can also use it to draw some pretty cool geometric shapes.
Draw a Circle
Starting from the basics, let’s draw a simple circle. The most used in matplotlib is <span>plt.Circle()</span>.
import matplotlib.pyplot as plt
# Create a figure
fig, ax = plt.subplots()
# Create a circle
circle = plt.Circle((0.5, 0.5), 0.3, color='blue', fill=True)
# Add the circle to the figure
ax.add_artist(circle)
# Set axis limits
ax.set_xlim(0, 1)
ax.set_ylim(0, 1)
plt.show()
This code creates a blue circle with a radius of 0.3, located at <span>(0.5, 0.5)</span>, which is the center of the figure. Using <span>plt.Circle</span> allows us to easily draw circles on the canvas, <span>ax.add_artist(circle)</span> puts the circle into the figure, and finally using <span>plt.show()</span> displays it.
Draw a Gradient Circle
Now that we can draw a circle, let’s make a small improvement and draw a gradient-colored circle to make it look cooler.
import matplotlib.pyplot as plt
import numpy as np
# Create canvas
fig, ax = plt.subplots()
# Set center and radius
center = (0.5, 0.5)
radius = 0.4
# Generate gradient colors
theta = np.linspace(0, 2 * np.pi, 100)
x = center[0] + radius * np.cos(theta)
y = center[1] + radius * np.sin(theta)
# Create gradient colors
colors = np.linspace(0, 1, len(theta))
# Plot each point
for i in range(len(x) - 1):    ax.plot([x[i], x[i+1]], [y[i], y[i+1]], color=plt.cm.viridis(colors[i]))
# Set axis limits
ax.set_xlim(0, 1)
ax.set_ylim(0, 1)
plt.show()
In this code, we use <span>numpy</span> to generate boundary points of a circle, and then use different colors to plot these points, ultimately getting a colorful gradient circle.
Tip: <span>plt.cm.viridis</span> is a color mapping in matplotlib, and we can choose different color themes to add more visual effects to the figure.
Draw a Spiral
A spiral shape sounds a bit difficult, but actually, you just need to gradually increase the length of the line segments and control the angle.
import matplotlib.pyplot as plt
import numpy as np
# Create figure
fig, ax = plt.subplots()
# Initialize parameters
theta = np.linspace(0, 4 * np.pi, 100)  # From 0 to 4π in radians
r = theta  # Radius equals angle
# Draw spiral
ax.plot(r * np.cos(theta), r * np.sin(theta))
# Set axis limits
ax.set_xlim(-10, 10)
ax.set_ylim(-10, 10)
plt.show()
In this example, we let the radius increase with the angle, forming a gradually expanding spiral. The key to spiral shapes is to control the relationship between radius and angle, and the mathematical formula is quite simple.
Tip: The expansion speed of the spiral can be changed by adjusting <span>r = theta</span>. If you want the spiral to be tighter, you can appropriately reduce the ratio of <span>r</span> and <span>theta</span>.
Draw a Rainbow
For the last shape, let’s draw a rainbow! This looks like a big project, but it’s actually just several arcs with different colors.
import matplotlib.pyplot as plt
import numpy as np
# Create canvas
fig, ax = plt.subplots()
# Set rainbow colors
colors = ['red', 'orange', 'yellow', 'green', 'blue', 'indigo', 'violet']
# Draw seven arcs
for i in range(7):    circle = plt.Circle((0.5, 0.5), 0.4 - i*0.05, color=colors[i], fill=False, linewidth=4)    ax.add_artist(circle)
# Set axis limits
ax.set_xlim(0, 1)
ax.set_ylim(0, 1)
plt.show()
This code simulates a simple rainbow effect by adjusting the radius and color of the circles. Each circle’s radius is slightly reduced, and then filled with different colors to create a layered effect.
Conclusion
Through these small exercises, you have learned how to use Python to draw various shapes. turtle allows us to easily draw simple geometric shapes, while matplotlib can draw more complex shapes and cooler effects.
With these libraries, you can not only enjoy the fun of creation while learning programming.