Following the previous article introducing the “Using Telink Microelectronics JTAG Tools (Part 1)”, this article will continue to introduce the usage of JTAG related tool command lines and common problems along with their solutions.
1
Common GDB Commands
During normal debugging, you can set breakpoints in Telink IOT Studio for debugging. When the breakpoint is hit, you can read the PC and status registers. However, during actual debugging, it is common to encounter crashes. In such cases, you can use command line operations in GDB to read the PC, status registers, or memory.
By entering the corresponding commands in the Debugger Console window, you can perform read and write operations on registers/memory.
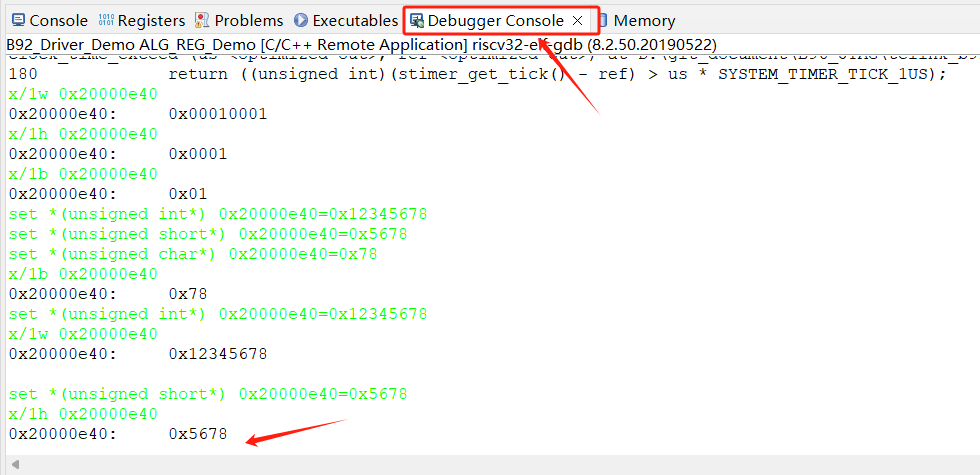
Command Examples:
Read Command:
1
x/1w 0x20000e40 (Read one word of data from 0x20000e40)
2
x/1h 0x20000e40 (Read half word data from 0x20000e40)
3
x/1b 0x20000e40 (Read one byte of data from 0x20000e40)
Where
x/: indicates read
1: number of items to read
W: unit (word)
Write Command:
1
set *(unsigned int*) 0x20000e40=0x12345678
Write a word at address 0x20000e40, value is 0x12345678;
2
set *(unsigned short*) 0x20000e40=0x5678
Write a half word at address 0x20000e40, value is 0x5678;
3
set *(unsigned char*) 0x20000e40=0x78
Write one byte at address 0x20000e40, value is 0x78;
Where
Set: indicates write
unsigned char: write unit
0x20000e40: write address
0x12345678: write value
2
Using Common Telnet Commands
Using Telnet connection tools (like Putty or MobaXterm) and ICEman, you can read and write registers and memory without stalling the MCU.
-
Environment Setup: MobaXterm download address: https://mobaxterm.mobatek.net/.
-
Open ICEman (ensure JTAG connection in the IDE is disconnected before opening, otherwise it may cause a blue screen). If using a four-wire connection mode, execute “./ICEman -Z v5”; if using a two-wire connection mode, execute “./ICEman -Z v5 -I aice_sdp.cfg”. The output information will indicate that the software has opened Telnet port 4444.
-
Use MobaXterm software to connect to Telnet port 4444.
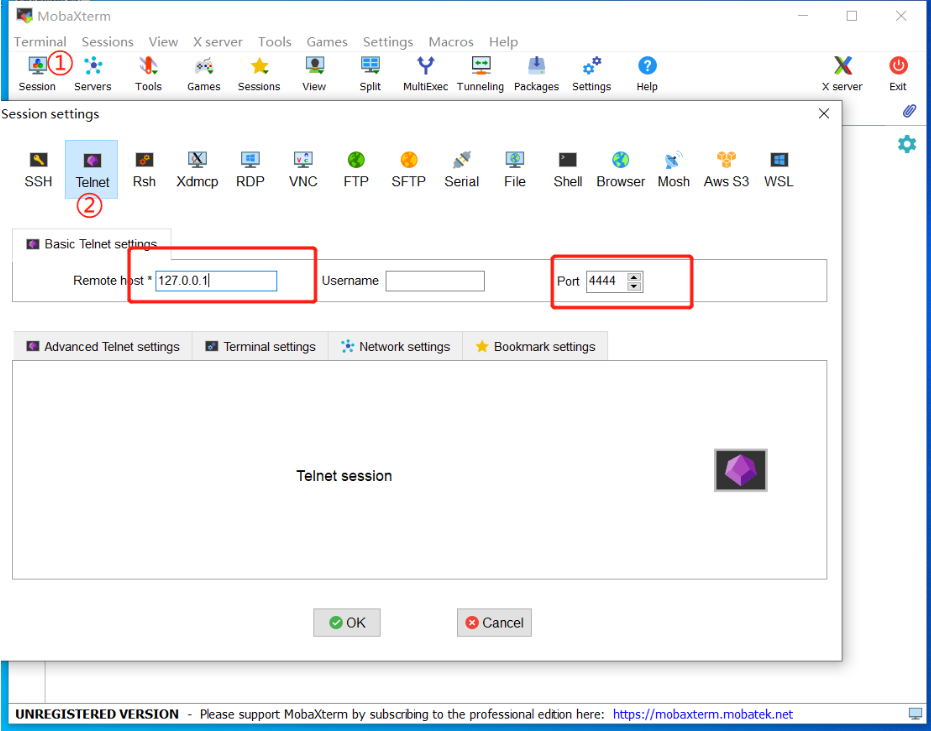
Common Setting Commands:
nds configure dmi_quick_access 1
nds mem_access bus This command sets memory access via the bus (using DMA to access memory)
nds mem_access cpu This command sets memory access via the CPU
The above two memory access path commands should be set according to actual needs. If you want to read/write memory/registers, you need to first execute the commands nds configure dmi_quick_access 1 and nds mem_access bus
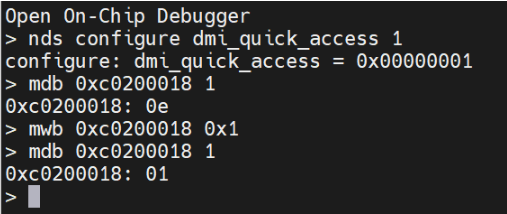
Viewing Debug Information
1. The command for reading registers/memory is md[x] [addr] [count]. It consists of three parts, where mdx is the read command, [x] can be b (byte), h (half), w (word), d (double word), [addr] is the starting address of the register/memory to be read, and [count] is the quantity. If not entered, it defaults to 1.
eg:
mdb 0xc0200018 1
mdh 0xc0200018 1
mdw 0xc0200018 1
mdd 0xc0200018 1
2. The command for writing to registers/memory is mw[x] [addr] [count]. It consists of three parts, where mdx is the read command, [x] can be b (byte), h (half), w (word), d (double word), [addr] is the starting address of the register/memory to be read, and [count] is the quantity.
eg:
mwb 0xc0200018 0x12
mwh 0xc0200018 0x1234
mww 0xc0200018 0x12345678
mwd 0xc0200018 0x1234567812345678
3
Common JTAG Problems and Solutions
1. Abnormal Breakpoint Setting
Currently, the TLSR9 series SOC supports a maximum of two hardware breakpoints. When the program’s starting address is 0x20000000, it indicates that it is running in flash, and hardware breakpoints must be used. The commands like step in or step over will use one breakpoint, so the user can only customize one breakpoint during debugging, otherwise an exception will occur. This is also why it is not recommended to check Stop on startup at, as this option effectively sets a breakpoint. When encountering a “cannot access memory at address xx” exception during debugging, the info br command can be used to check the number of breakpoints.
2. Abnormal Breakpoint Stopping
When using the breakpoint feature, it is necessary to pay attention to: (1) There must be a checkmark before the breakpoint, otherwise the breakpoint will not stop. (2) The program may stop one or two lines after the set breakpoint position, which is normal.
3. Abnormal Linking of Source Files
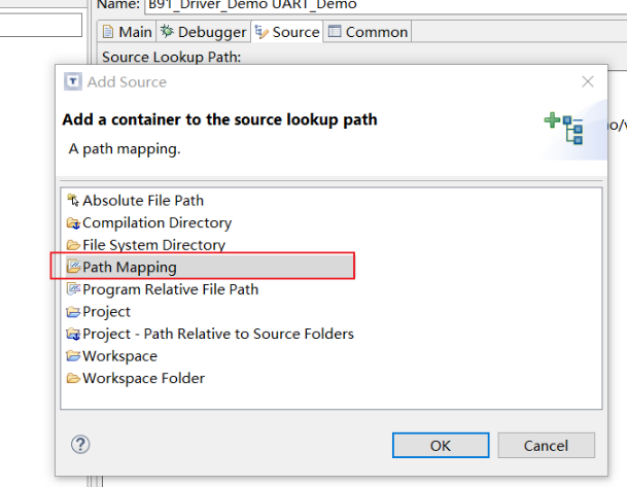
During breakpoint debugging, it may occur that the source file cannot be found. In this case, click Edit Source Path…, as shown below:
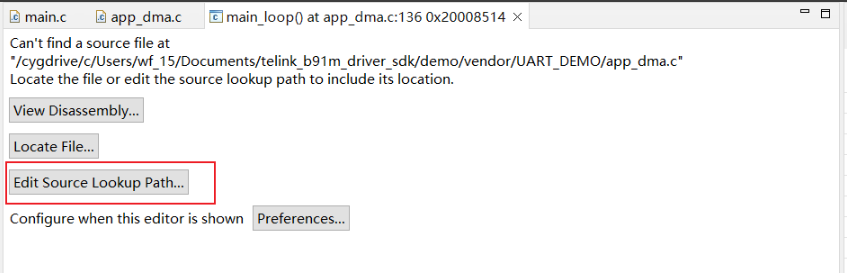
Click Add, select Path Mapping, and edit as follows:
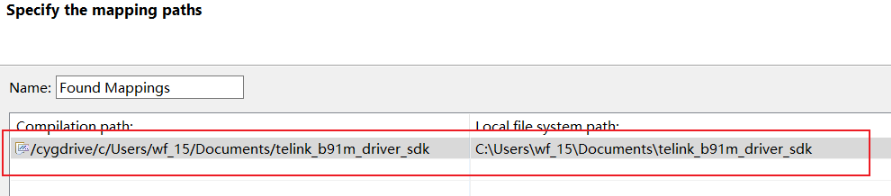
The left side needs to be manually entered, and the right side can select the path. The principle of this problem is to correctly map the path in IoT Studio to the local path, so the simplest mapping can also be to directly map /cygdrive/c/ to C:\ (the SDK in the example is placed in the C drive). After the above configuration is completed, normal debugging can be performed.
4
Summary
The powerful functions of JTAG provide great convenience for chip R&D work. The above is a detailed introduction to using JTAG in Telink IoT Studio, offering various debugging methods and rich debugging functions for users, providing greater flexibility for debugging in various complex environments.

About Telink
Telink Microelectronics is committed to providing customers with one-stop low-power, high-performance wireless connectivity SoC chip solutions, including classic Bluetooth, Bluetooth Low Energy, Bluetooth Mesh, Zigbee, Thread, Matter, Apple HomeKit, Apple “Find My”, and private protocol low-power 2.4GHz multi-protocol wireless connectivity system-level chips and rich firmware protocol stacks. The company’s products are widely used in smart lighting, smart home/building, smart remote control, wireless peripherals, smart retail, wearable devices, wireless audio, smart toys, logistics tracking, smart cities, and various consumer and commercial application scenarios.
Official Website: www.telink-semi.com
WeChat Official Account: telink-semi
Telink Developer Forum:
https://developers.telink-semi.cn/
Sales Contact:
China Mainland (East China, North China):
+86-21-20281118-8213
China Mainland (South China, Hong Kong, Audio):
+86-0755-26614003