Many friends are transitioning from microcontrollers and are quite familiar with JTAG. They want to use JTAG to debug bare-metal code, but often encounter issues where the virtual machine cannot connect to the TF card.
The I.MX6ULL itself supports JTAG, but there is really very little information available on this, and most of it is in English, making it difficult for beginners. Therefore, we have specifically debugged and organized this information for everyone’s reference and learning.
Next, I will briefly introduce how to use JTAG for debugging, and later I will add detailed steps to the user manual.
1.1 Required Hardware Environment for Debugging
1. One I.MX6ULL Terminator Development Board
2. One JLNK V9 downloader
3. One JLINK V9 conversion board (2.54mm to 2.0mm)
1.2 Setting Up the Development Environment
1.2.1 Installing JLINK V9 Driver
First, we need to install the JLINK V9 driver. The driver program can be downloaded online, but for convenience, we have already downloaded it and saved it in the CD directory under “i.MX6UL Terminator CD Data\02_Development Required Software\JLINK V9 Driver” (the version we are using is V6.34). Now let’s start installing the driver.
First, double-click the “JLink V6.34.exe” installer, as shown below:

Then the installation wizard will pop up, as shown below:
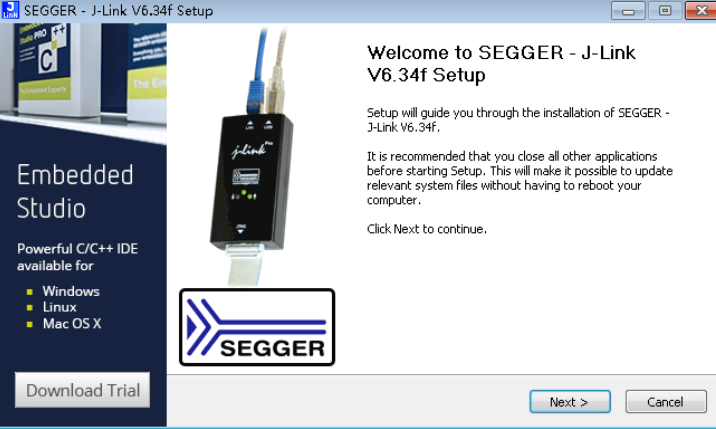
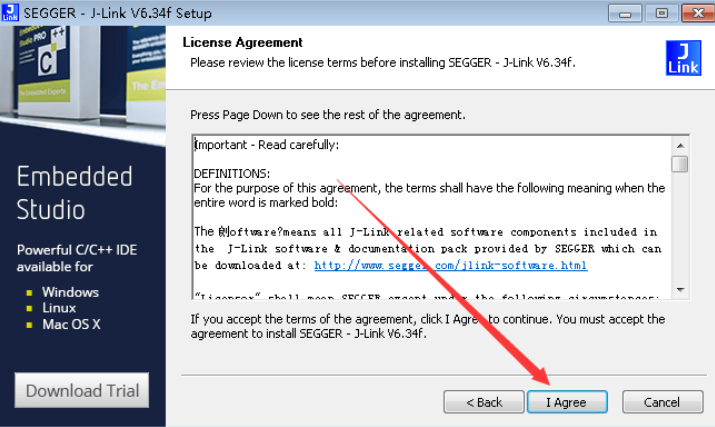
Next, click the “Next” button to continue the installation. A license agreement dialog will pop up, and we click the “I Agree” button, as shown below:
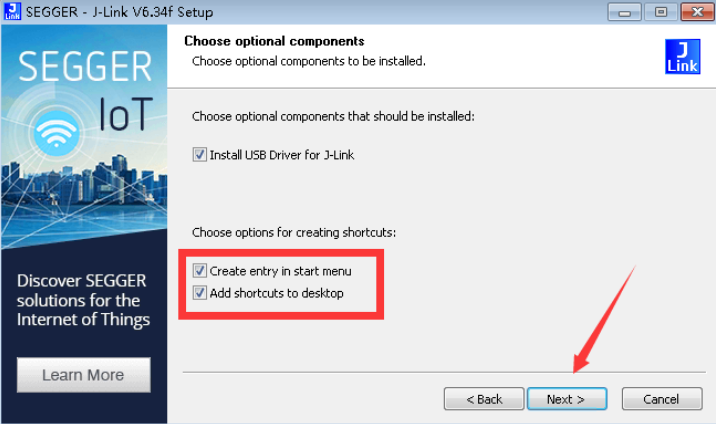
Then a dialog asking whether to create a desktop shortcut will pop up. We choose to create it and click the “Next” button to continue to the next step, as shown below:
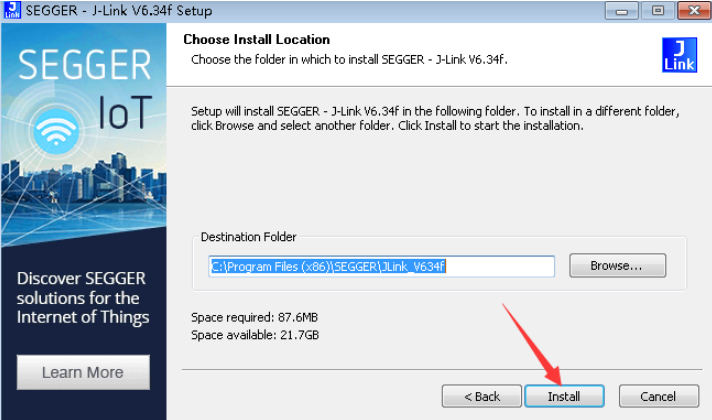
Then a dialog for selecting the installation location will pop up. We use the default installation directory (if you need to install to another directory, you can choose). Then click the “Install” button, as shown below:
Then the installation will begin, as shown below:
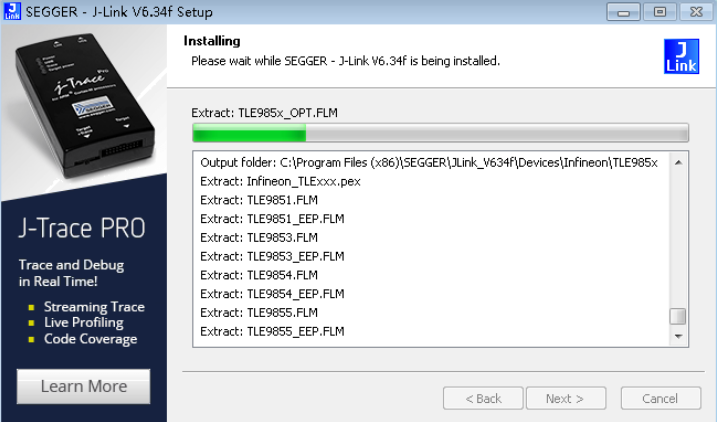
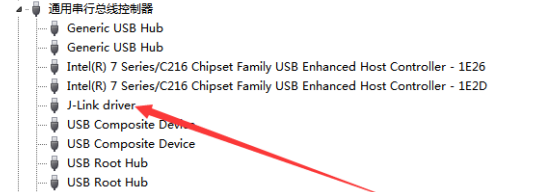
Finally, a dialog indicating the installation is complete will pop up, and we click the “Finish” button. At this point, the JLINK V9 driver installation is complete. Then we connect the JLINK V9 downloader to the PC via a USB data cable, and we can see in the device manager that the Windows system has recognized the JLNK downloader, as shown below:
1.1.1 Installing i.MX6ULL SDK Package
The official NXP website provides the i.MX6ULL SDK development package, which offers both Windows and Linux versions, targeting the respective operating systems. In this chapter, we will use the Windows version of the SDK. The Windows version of the SDK includes examples that provide IAR project files, which are compiled based on the IAR development environment. We can download the i.MX6ULL SDK development package from the NXP official website; for convenience, we have already downloaded it and saved it in the CD data under “i.MX6UL Terminator CD Data\01_Development and Burning Tools\4.i.MX6ULL SDK Package” directory. Now let’s install the SDK development package.
First, double-click the “SDK_2.2_MCIM6ULL_RFP_Win.exe” installer. The installation interface will pop up, and we click the “Next” button, as shown below:
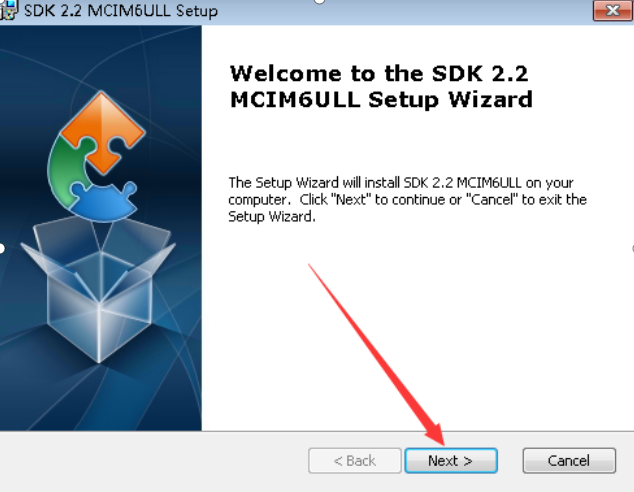
Then we click next continuously, and the SDK installation will be completed.
1.2.3 Installing IAR Development Tools
In the chapter where we installed the SDK, we mentioned that the SDK provides IAR projects, so we need to install the IAR development tools on the Windows system. Please note that the IAR projects provided by the SDK require IAR 8 or earlier versions (the author initially installed IAR 8.2, which resulted in errors during compilation. Later, switching to IAR 7.8 allowed for successful compilation). You can download the IAR installation program online; for convenience, we have already downloaded it and saved it in the CD data under “i.MX6UL Terminator CD Data\02_Development Required Software\IAR7.8 Installation Program” directory. We will not demonstrate the installation of IAR here; detailed steps will be added to the user manual later, or else the article would be too long.
1.3 IAR JLNK Debugging SDK Program
In section 1.2.2, we installed the SDK program (installation location: G:\nxp), and in section 1.2.3, we installed the IAR development tools. Next, we open the IAR development tools, as shown below:
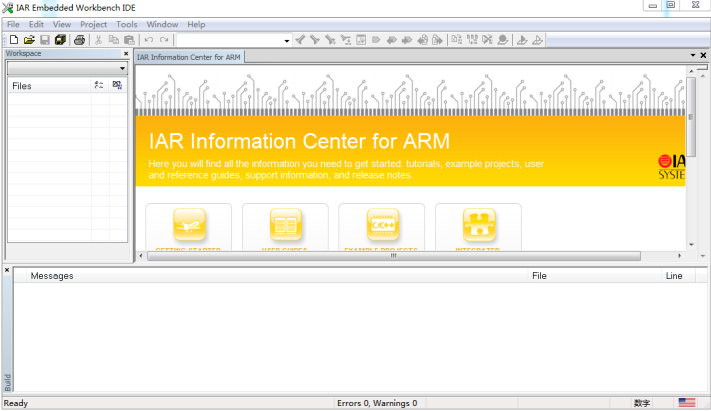
In this chapter, we will mainly explain how to debug the I.MX6ULL IAR project using IAR + JLINK. For specific usage of the IAR tool, you can search for relevant documents online.
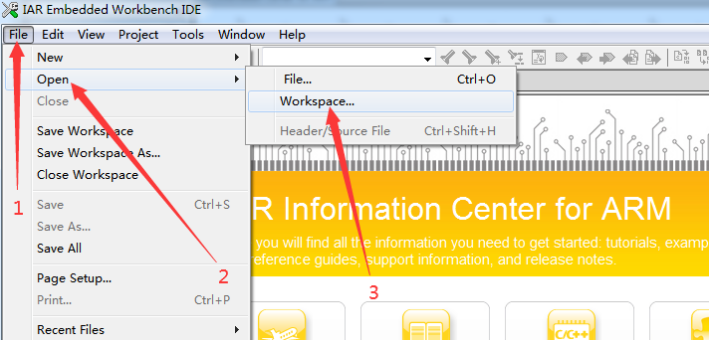
Then we click “file->open->workspace”, as shown below:
Then the “Open Workspace” dialog will open. We will take the hello_world project in the SDK as an example to learn how to debug the i.MX6ULL program using JLINK. The project directory is located under “sdk installation location\boards\evkmcimx6ull\demo_apps\hello_world\iar”. Since our sdk is installed in the G drive under the nxp folder, the absolute path of the hello_world project is “G:\nxp\boards\evkmcimx6ull\demo_apps\hello_world\iar” (you can select the corresponding directory based on your sdk installation location). In the “Open Workspace” dialog, select the hello_world project directory and finally choose “hello_world.eww” (the suffix of the IAR project file is eww), then click the “Open” button, as shown below:
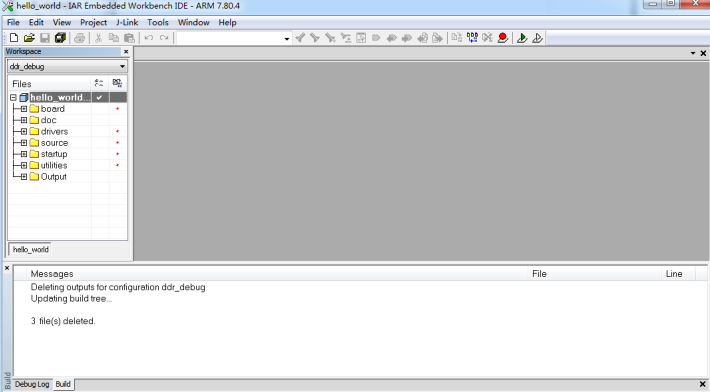
The interface after opening the hello_world project is shown below:
We can see that this project provides four compilation methods, as shown below:
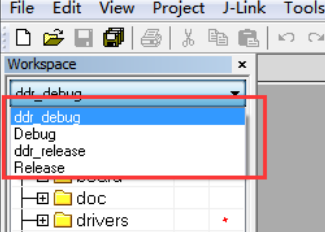
We will use the default “ddr_debug” method to compile this project. We can click the “Make” button on the toolbar to compile the project, as shown below:
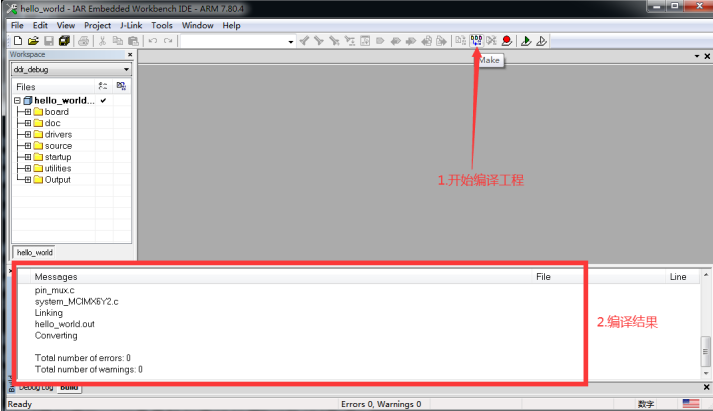
From the compilation result output information, we can see that the compilation was successful. Then we connect the JLNIK V9 downloader to the i.MX6ULL Terminator development board’s JTAG interface, as shown below:
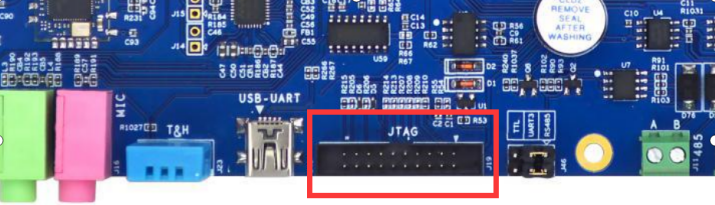
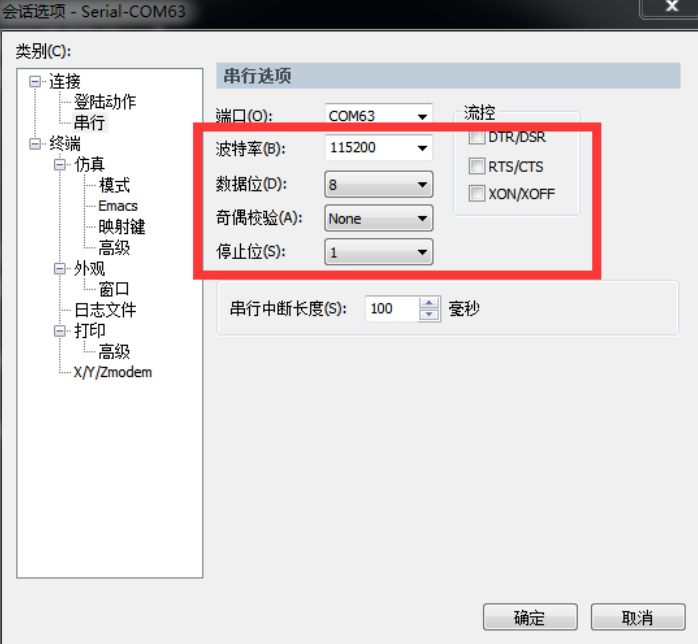
Since the JTAG interface of the i.MX6ULL chip and the SAI (sound card) are multiplexed, we need to modify the development board when using the JTAG interface (V1.0 boards need to remove the resistor R183 on the bottom; V1.1 boards need to remove the jumper cap next to the sound card chip J50). Then we connect the development board’s debugging serial port to the PC and open the serial terminal on the computer. The baud rate of the serial terminal should be set to 115200, with 8 data bits, no parity, 1 stop bit, and no flow control, as shown below:
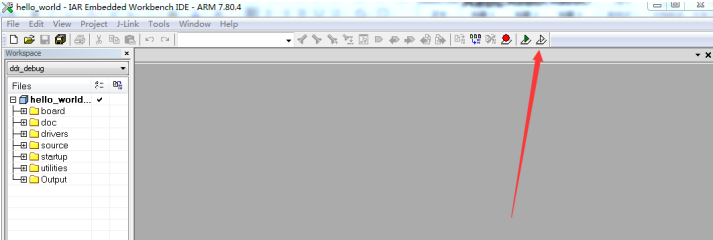
Then we power on the development board, and next we click the “Debug without Loading” icon in the menu bar of the IAR project interface, as shown below:
If the JLINK and the development board’s JTAG interface are connected correctly, it will enter the debugging interface, as shown below:
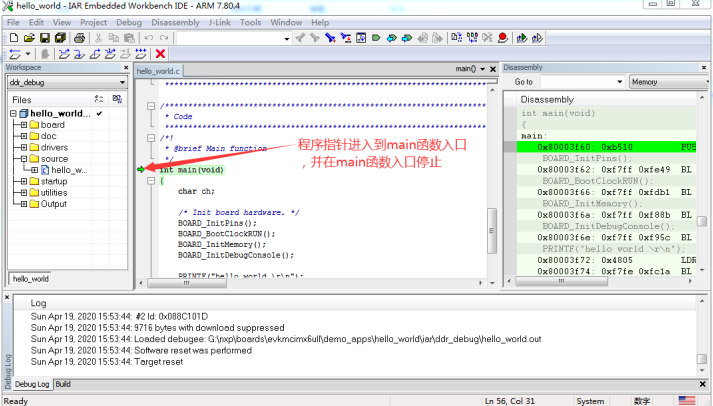
From the above, we can see that the hello_world program has started running, and the program pointer is stopped at the entrance of the main function, waiting for us to execute debugging. After entering debug mode in IAR, the debugging-related shortcut icons in the menu bar will become active (clickable), and several shortcut icons related to debugging are shown below:
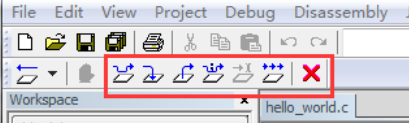
From the image above, we can see a total of seven shortcut icons, which are:
Step Over: Executes one line of code each time it is clicked.
Step Into: If the program pointer is currently pointing to a function call, clicking this icon will enter the internal execution of that function.
Step Out: Corresponding to Step Into, if we have entered a function using Step Into and want to return to the previous function and continue executing its subsequent commands, we can click this icon.
Next Statement: By right-clicking a line and selecting “Set Next Statement”, you can skip executing the intermediate code and jump directly to this line, useful for not executing certain code.
Run to Cursor: Runs the program to the cursor position (you can click on any line to position the cursor, then click “Run to Cursor”, and the program will run to that line and stop).
Go: Continues program execution; if it encounters a breakpoint, it will stop; if no breakpoint is set, it will continue to execute.
Stop Debugging: Ends the debugging mode.
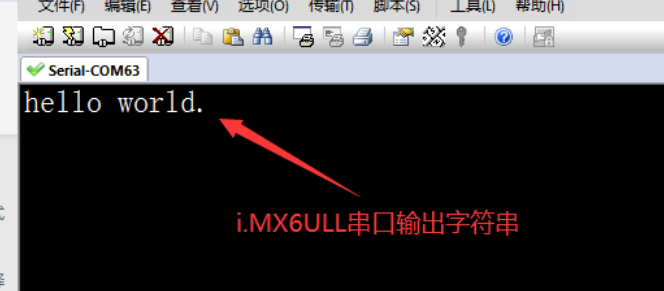
From the image above, we can see that the “Go” shortcut icon allows the program to continue running. If it encounters a breakpoint, it will stop; otherwise, it will continue executing. The program eventually enters the while(1) main loop, where it mainly receives serial data and sends the received serial data back out through the serial port. To verify that the “Go” shortcut icon will continue executing without encountering a breakpoint, we continue clicking the “Go” shortcut icon, and we can see that the serial terminal prints out the string “hello world.”, as shown below:
We will stop our introduction to using JTAG debugging on the i.MX6ULL here. We can use JLink.exe to download the compiled binary program to the specified location in the i.MX6ULL development board’s memory and then execute our binary program from that location. We will introduce the specific usage in future documents.
Link to our Taobao store:
https://arm-board.taobao.com/index.htm?spm=2013.1.w5002-22240234188.2.71f45077Xn8WJH
Link to the Terminator development board:
https://item.taobao.com/item.htm?id=614020183147&qq-pf-to=pcqq.c2c
■ Follow the “Xunwei Electronics” WeChat public account for periodic sharing of tutorials, materials, industry insights, and product information.
■ For more information about Xunwei, feel free to contact us:
Sales Engineer: 0312-6796610 ext 8001
Technical Support: 0312-6796610 ext 8003, 8004
Customized Solutions: 0312-6796610 ext 8003
■ Real-time Technical Support:
AM 9:00—12:00, PM 13:30—17:30 (Monday to Saturday)
END
Long press to recognize the QR code to follow

Xunwei Electronics
Making Learning Easier, Making Development Simpler
 http://www.topeet.com/▼Previous Recommended Reads▼Xunwei Electronics ‘iTOP4412 Development Platform’ Receives Official Support from World Open Source Software LinuxIntroduction to I.MX6ULL Terminator Base Resources[In Stock] “I.MX6ULL Terminator” He’s Here!Beijing Xunwei ~ Supporting Chinese Chips!