Today is Wednesday, and the week is halfway through. Happy Wednesday, everyone.
In the previous article (【Detailed Explanation of the Camera Body】Revisiting Sensors: Native ISO and Extended ISO), we discussed the concepts of native ISO and extended ISO.
It was mentioned that ISO affects dynamic range.
Today, we will briefly explain this issue.
01 The Relationship Between ISO and Dynamic Range
This section mainly supplements the previous article.
a Dynamic Range
First, let’s review what dynamic range is.
In simple terms, dynamic range refers to the range of the brightest and darkest areas that the sensor can capture, commonly expressed in EV (Exposure Value).
Generally speaking, the larger the dynamic range, the more detail it can record in both bright and dark areas.
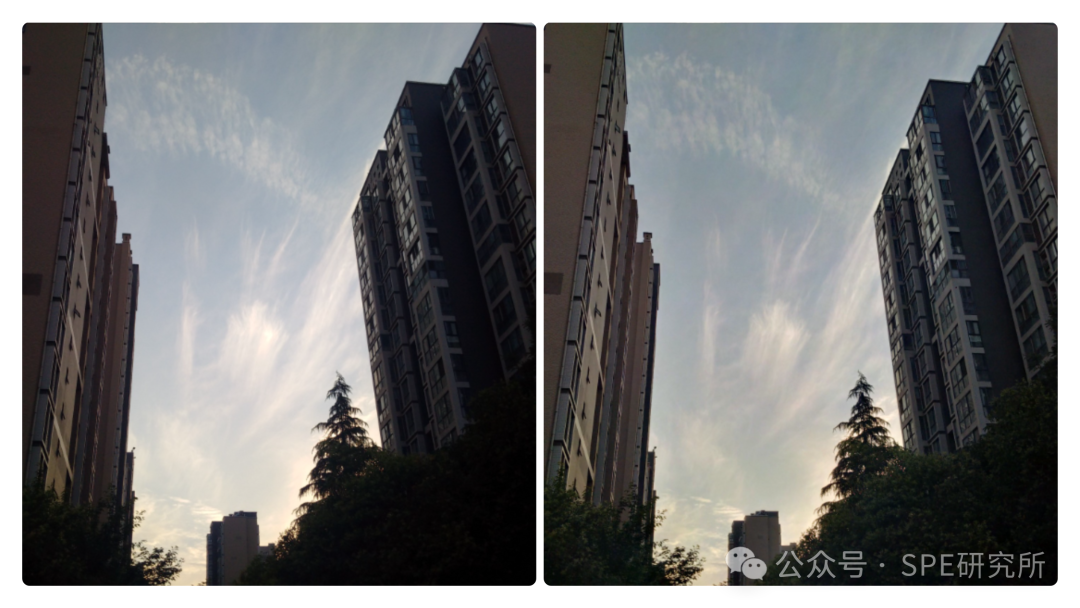
For example, comparing the two photos below (taken with a Blackberry Q30, as detailed in a previous article).
The left image was taken without HDR, where the leaves in the lower right corner are completely black.
In contrast, the right image, taken with HDR enabled, preserves details in both bright and dark areas.
b ISO and Dynamic Range
We previously discussed the relationship between ISO and image quality, as well as brightness; now let’s talk about the relationship between ISO and dynamic range.
In the previous article, we mentioned that the essence of ISO is to control the gain of the image sensor, amplifying the sensor’s signal to a suitable level for backend processing.
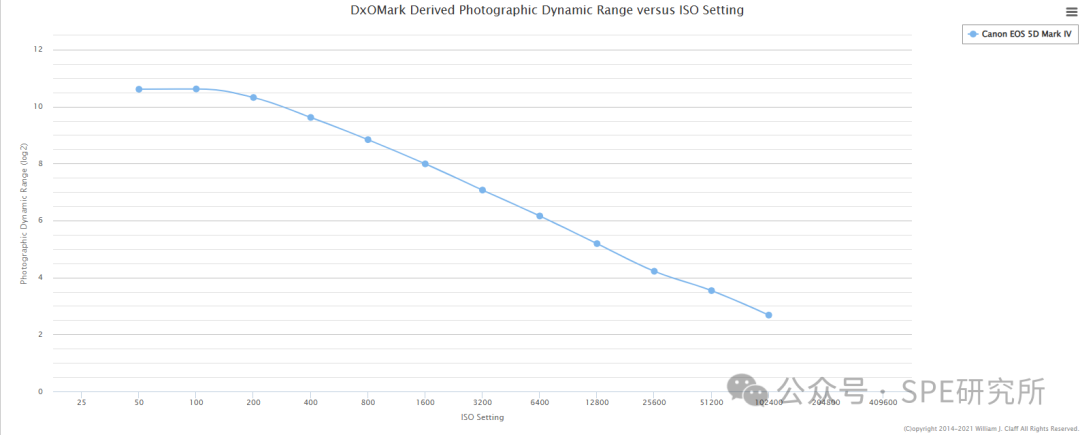
Therefore, when the image output is not amplified (i.e., the basic ISO mentioned earlier), the sensor’s dynamic range is maximized. As ISO increases, the dynamic range that the sensor can capture decreases.
For example, taking the Canon EOS 5D4 as an example, according to DxOMark data, as ISO increases, the dynamic range gradually decreases.
The actual principle is quite complex, and we will not delve deeply into it here.
However, it can be understood through the following example.
For instance, we have a scale that can measure from 0.1kg to 10kg. When we want to weigh an object around 0.01kg, this scale cannot measure it accurately.
But if we have a special method to make the object weigh 100 times more (i.e., increasing the ISO), the object will then weigh around 1kg on the scale, allowing for accurate measurement.
At this point, the actual measurement range of the scale has changed to 0.001kg to 0.1kg, meaning the range has decreased (dynamic range decreased).
Again, this is not an explanation of the actual principle, but just an example to aid understanding.
In summary, increasing ISO not only introduces more noise but also reduces the dynamic range of the sensor’s imaging.
A lower base ISO indicates that the sensor is more sensitive, and a larger native ISO range indicates that the sensor and backend amplification circuit are more capable.
02 Information Query Website
With the supplementary explanation complete, let’s discuss the sensor information query website mentioned in the previous article.
This website was previously introduced when discussing lens simulation (【Detailed Explanation of Lenses】Supplementary Explanation 2: Lens Simulation Website) and is sourced from the Protons to Photos website.
The website’s name translates to “From Photons to Photos.”
As the name suggests, this website contains a lot of information related to cameras.
This time, we will explain other functions of this website.
Here are the links:
https://www.photonstophotos.net//Charts/Measured_ISO.htm
https://www.photonstophotos.net//Charts/PDR.htm
https://www.photonstophotos.net//Charts/DXOPDR.htm
The three links above include the first one comparing the measured ISO values with the marked values, the second one showing a self-organized comparison of ISO and dynamic range, and the third one providing comparison test data of ISO and dynamic range from DXO.
Note that checking the source code reveals that it calls Google’s API, which may not function properly in domestic network environments.
You can modify the source code to replace these APIs with domestic mirror sources or use other methods to access them.

a Measured ISO vs. Marked ISO
Let’s start with the first one.
In fact, when designing sensors and backend circuits, the actual ISO value cannot be 100% accurate. For example, when set to ISO 100, the actual ISO may fluctuate around 100.
Camera manufacturers round this ISO value for user convenience in settings and judgments. When users adjust ISO in multiples on the interface, the actual ISO also changes in multiples.
This website compares the user-set ISO with the actual tested ISO at the corresponding level and displays it in chart form.
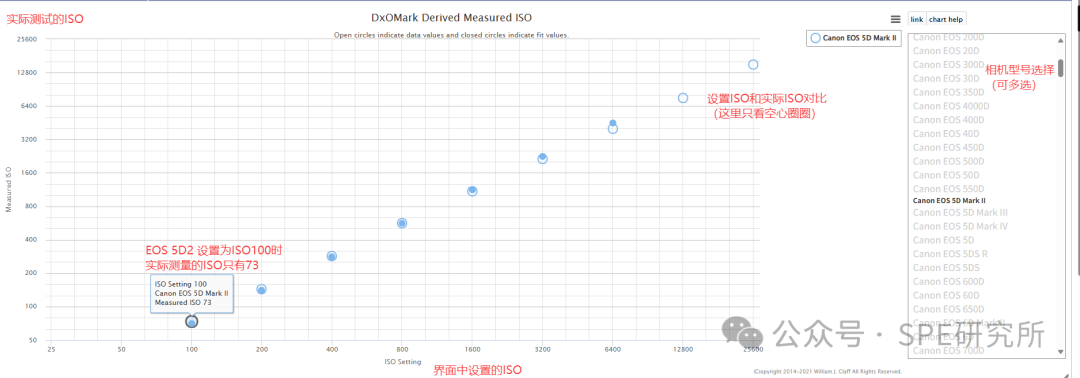
As shown in the image above.
Taking Canon’s EOS 5D2 as an example.
This camera, when set to ISO 100, actually tests out to around ISO 73.
Further analyzing this data, we can see:
- When the base ISO is set to 100, the actual ISO is 73. When the ISO multiplier changes, the actual ISO also changes correspondingly based on 73. For example, when the user sets ISO to 800 (eight times 100), the actual tested ISO is 564, which is 73 times 8.
- As the multiplier increases, the deviation of the actual ISO also becomes larger. For instance, when we set the user interface to ISO 25600, the actual ISO is 15110, which shows a significant difference compared to 73×256=18688, indicating that the higher the ISO, the more the sensitivity to light deviates from a linear relationship.
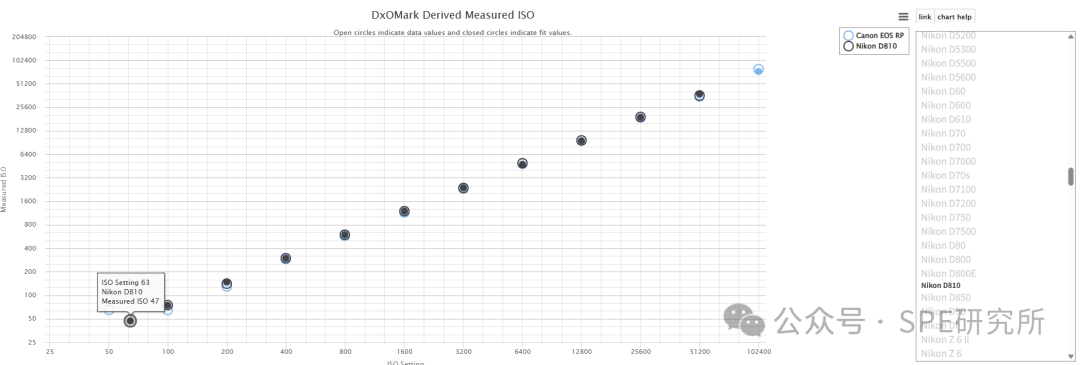
We can also choose multiple models for horizontal comparison, as shown in the image below:
b ISO and Dynamic Range
Generally, the differences in usage are not significant, but the former has more data and supported models, while the latter’s data is relatively more authoritative.
Here we will use the former as an example for explanation.
Visual explanation:
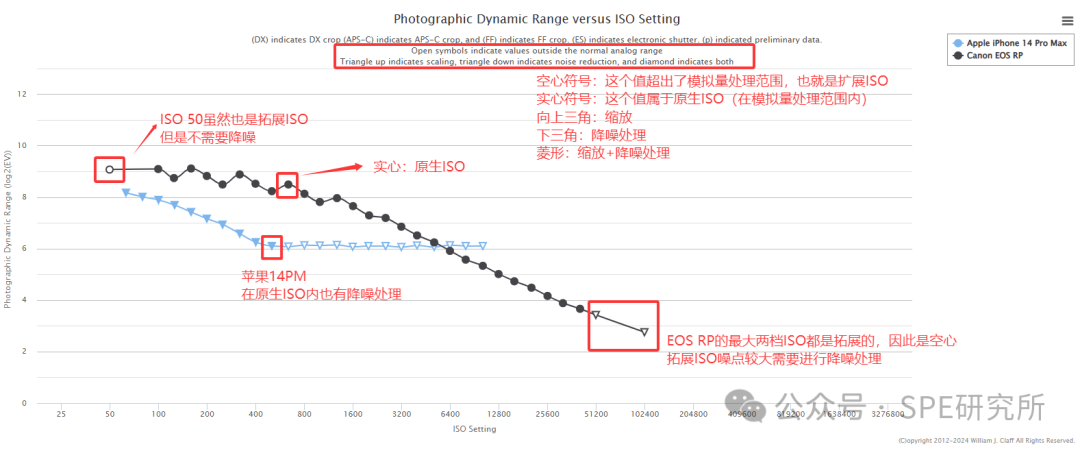
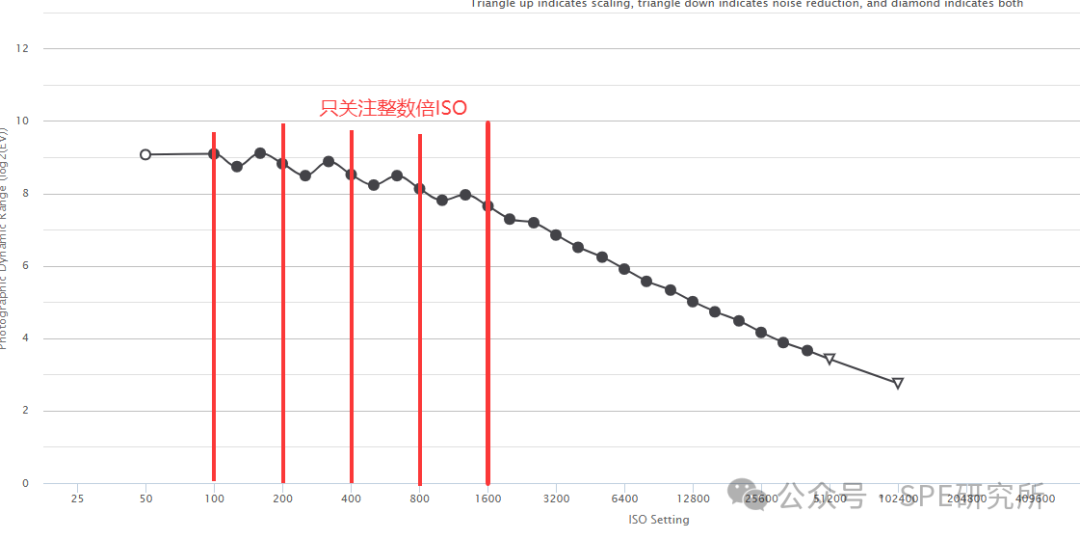
Here we can see that some data shows fluctuations (especially RP).
However, the fluctuating points are all at unconventional ISO levels, which can be ignored; only integer multiples of ISO should be focused on:
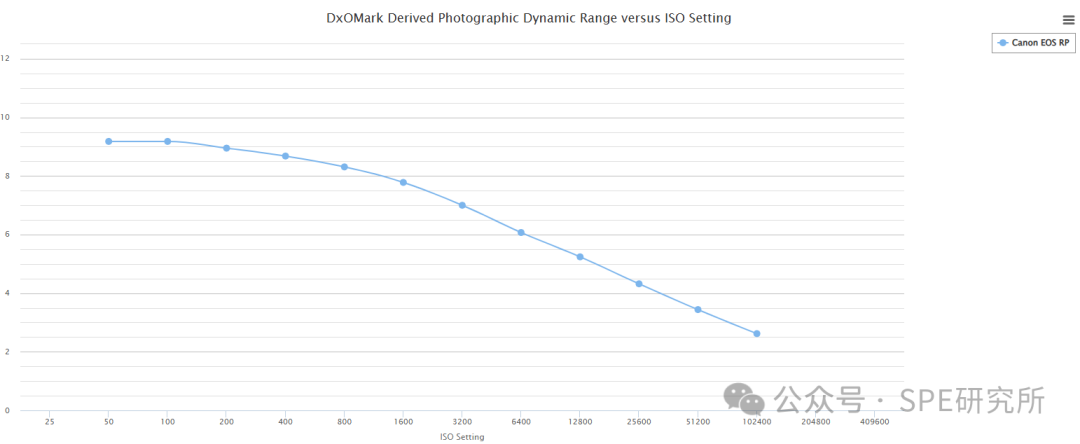
Of course, you can also look at the data in DXO, which is more intuitive (if available).
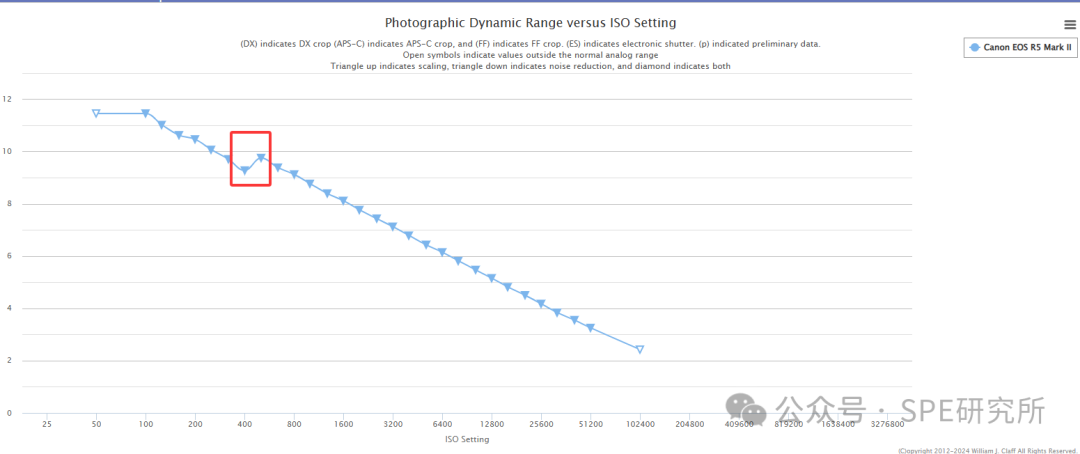
The real fluctuations occur in the case of dual native ISO mentioned earlier.
In this case, after reaching the switching threshold, the ISO will increase for a period, such as the previously mentioned R5 Mark II:
c Summary
In summary, the same statement applies.
Whether from the perspective of actual ISO deviation or from noise and dynamic range, higher ISO has a negative impact.
Therefore, it is recommended to lower ISO or stay close to the base ISO when conditions allow.
For example, when the camera supports dual native ISO, and the native ISOs are 100 and 12800, if shooting in low light handheld, you can choose the native ISO of 12800 instead of 6400.
Of course, practical issues should be analyzed practically, and it is recommended to refer to the data in this table and the actual shooting effects.
03 Conclusion
Finally, let’s summarize.
Dynamic range captures brightness and darkness, preserving details in contrast.
Increasing ISO reduces image quality, decreases range, and increases noise.
Relevant information can be found on the website; feel free to explore.
In fact, this website has many optical insights and other small tools beyond these topics.
However, the all-English website can be quite daunting; if you have the ability and interest, you can take a look.
That’s all for today.
About Me
This public account, although a photography certification account, will also cover programming, photography, and the geek world.
The author is an electronics engineer who loves photography, looking at photography from an electronic design perspective, and introducing various interesting gadgets or electronic knowledge.
Of course, if you are also interested in cats, feel free to follow me.
Talking about photography, sharing cat photos, and occasionally rambling.
Technology, programming, and landscape photos will be shared as they come.
If you are interested in my articles and cat photos, please follow me.
And don’t hesitate to like and share, thank you!!