
0x00 Introduction
Recently, I have been learning about debugging hardware interfaces such as optical modems, routers, and cameras, but I did not make any records. Therefore, I will briefly document the learning process here for future reference.
0x01 Required Tools
1. TTL to USB converter

2. Multimeter

3. TTL to USB converter

4. SecureCRT connection tool

5. Soldering iron (optional)

6. Several male-female DuPont wires

7. Devices like routers, optical modems, etc.
0x02 Overview of Hardware Interfaces
Hardware interfaces, such as UART, JTAG, I2C, and SPI, are used by device manufacturers for early debugging during design, programming during production, and for diagnostic testing.
Keeping the debugging port on the board open may cause risks such as leakage of communication protocols between devices and cloud or mobile applications, leakage of information integrity verification algorithms, and leakage of keys used during encryption. Understanding this information can potentially affect more similar devices.
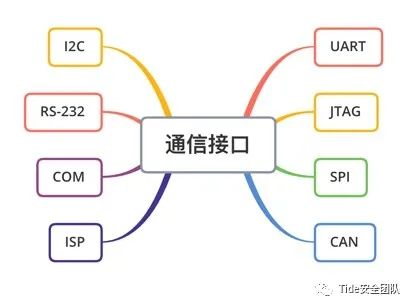
0x03 Introduction to Some Communication Interfaces
Introduction to Communication Interface – UART (Universal Asynchronous Receiver/Transmitter)
The Universal Asynchronous Receiver/Transmitter, commonly known as UART, is an asynchronous transceiver that is part of computer hardware. It converts data to be transmitted between serial and parallel communication. As a chip that converts parallel input signals to serial output signals, UART is usually integrated into connections of other communication interfaces.
UART allows asynchronous serial communication between two hardware peripherals. They can be located on the same circuit board (for example, communication between a microcontroller and a motor or LED screen) or between two different devices (such as communication between a device microcontroller and a PC). It allows reading/writing devices serially.
In many IoT devices, the UART port on the board remains open, allowing anyone to connect via the serial port to access shell, log output, etc. Typically, devices come with a set of pins. When we connect to the microcontroller’s UART RX and TX pins, we can send and receive serial data.
UART Pin Function Introduction:
VCC: Power pin, generally 3.3V-5V, positive pole
GND: Ground, negative pole
RXD: Receive data pin
TXD: Transmit data pin
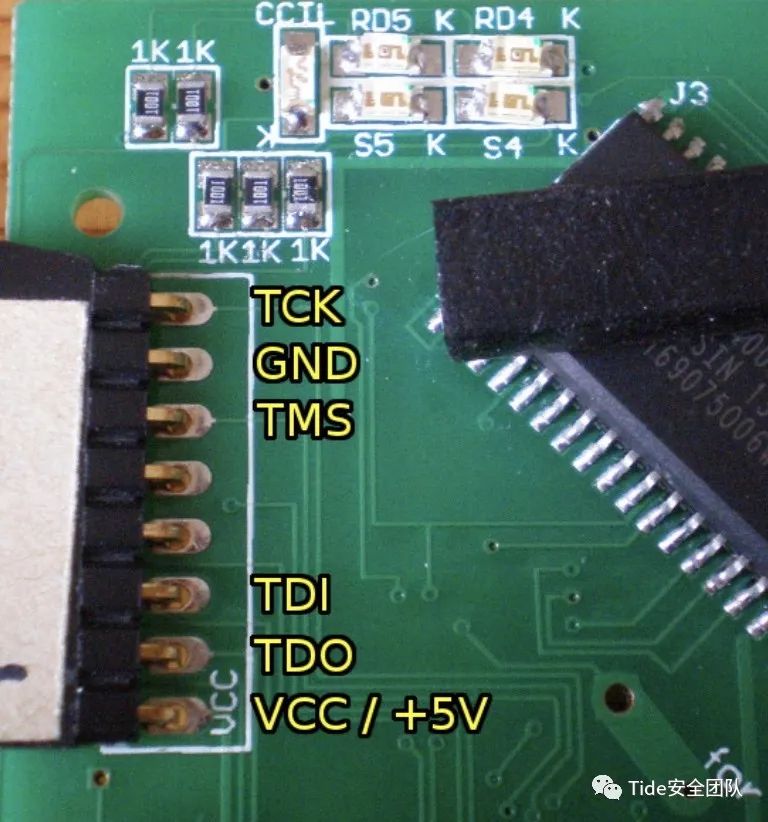
Introduction to Communication Interface – JTAG (Microcontroller Debugging Interface)
JTAG is a microcontroller debugging interface. Microcontrollers have specified pins for debugging during operation, which connect to pins on the circuit board. These pins (ports) are used by developers and designers for debugging, reading/writing firmware, and controlling/testing microcontroller pins after production. This makes the debugging port one of the most critical attack surfaces, as it provides attackers with powerful capabilities and access. In addition to JTAG, cJTAG and SWD are also included.
Introduction to Communication Interface – I2C, SPI
I2C
Inter-Integrated Circuit bus is a type of serial communication bus. It is a short-distance communication protocol used for communication between chips on the same board. I2C connects to the microcontroller’s I2C pins, usually storing data or code. Typical attacks include data tampering, extracting sensitive information, and data corruption. We analyze static data on EEPROM chips and perform runtime analysis by sniffing I2C communication to understand security risks.
SPI
Serial Peripheral Interface is also a short-distance communication protocol used for communication between chips on the same board. Compared to I2C, it has higher throughput. It is used for communication with various peripheral devices. Flash memory and EEPROM chips also use SPI. The methods for testing and analysis are similar to those of I2C.
0x04 Chip Identification
If you encounter an unfamiliar chip, you can directly query information through the model on the chip:
1. https://www.21icsearch.com
2. https://www.datasheets.com/zh-cn
3. http://www.datasheetlocator.com/zh
4. https://www.datasheetpdf.com
5. https://www.ifixit.com
6. https://fccid.io
0x05 Finding UART Serial Port Methods
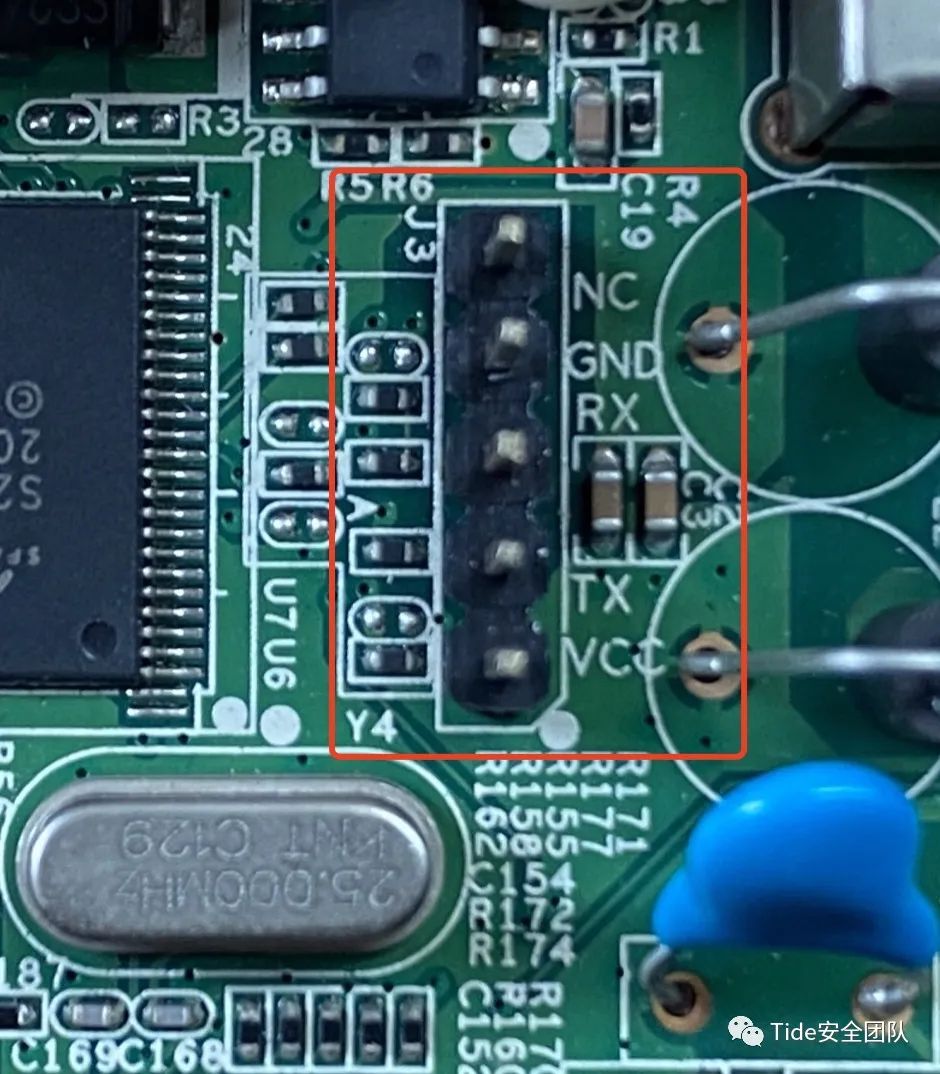
Before debugging the UART device, first find the corresponding pins on the board:
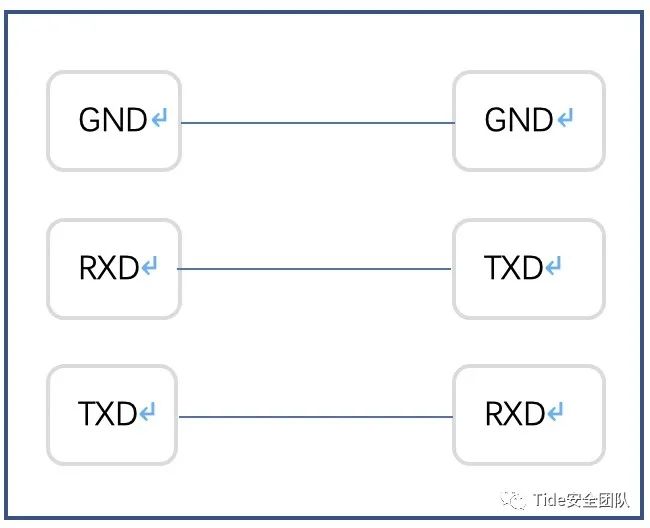
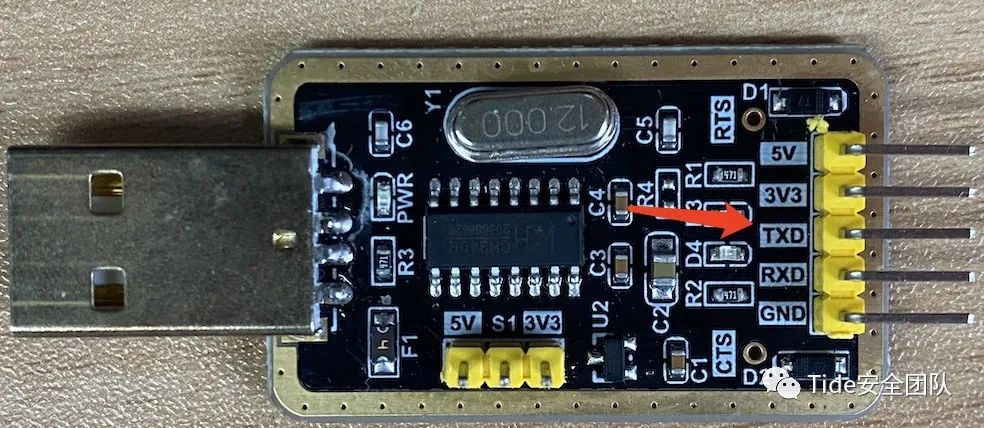
If the board has clearly marked pins, you can directly use the USB to TTL tool to connect according to the following diagram:
1. GND pin corresponds to TTL’s GND
2. RXD pin corresponds to TTL’s TXD
3. TXD pin corresponds to TTL’s RXD
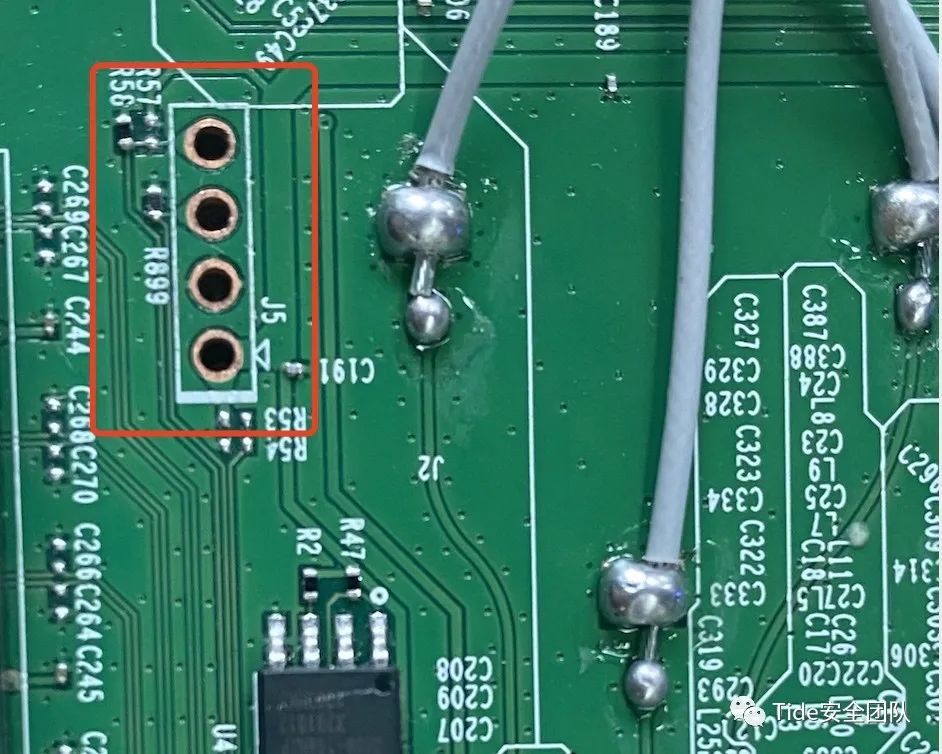
If the PCB board does not clearly mark the pins, you need to determine the UART interface through other methods:
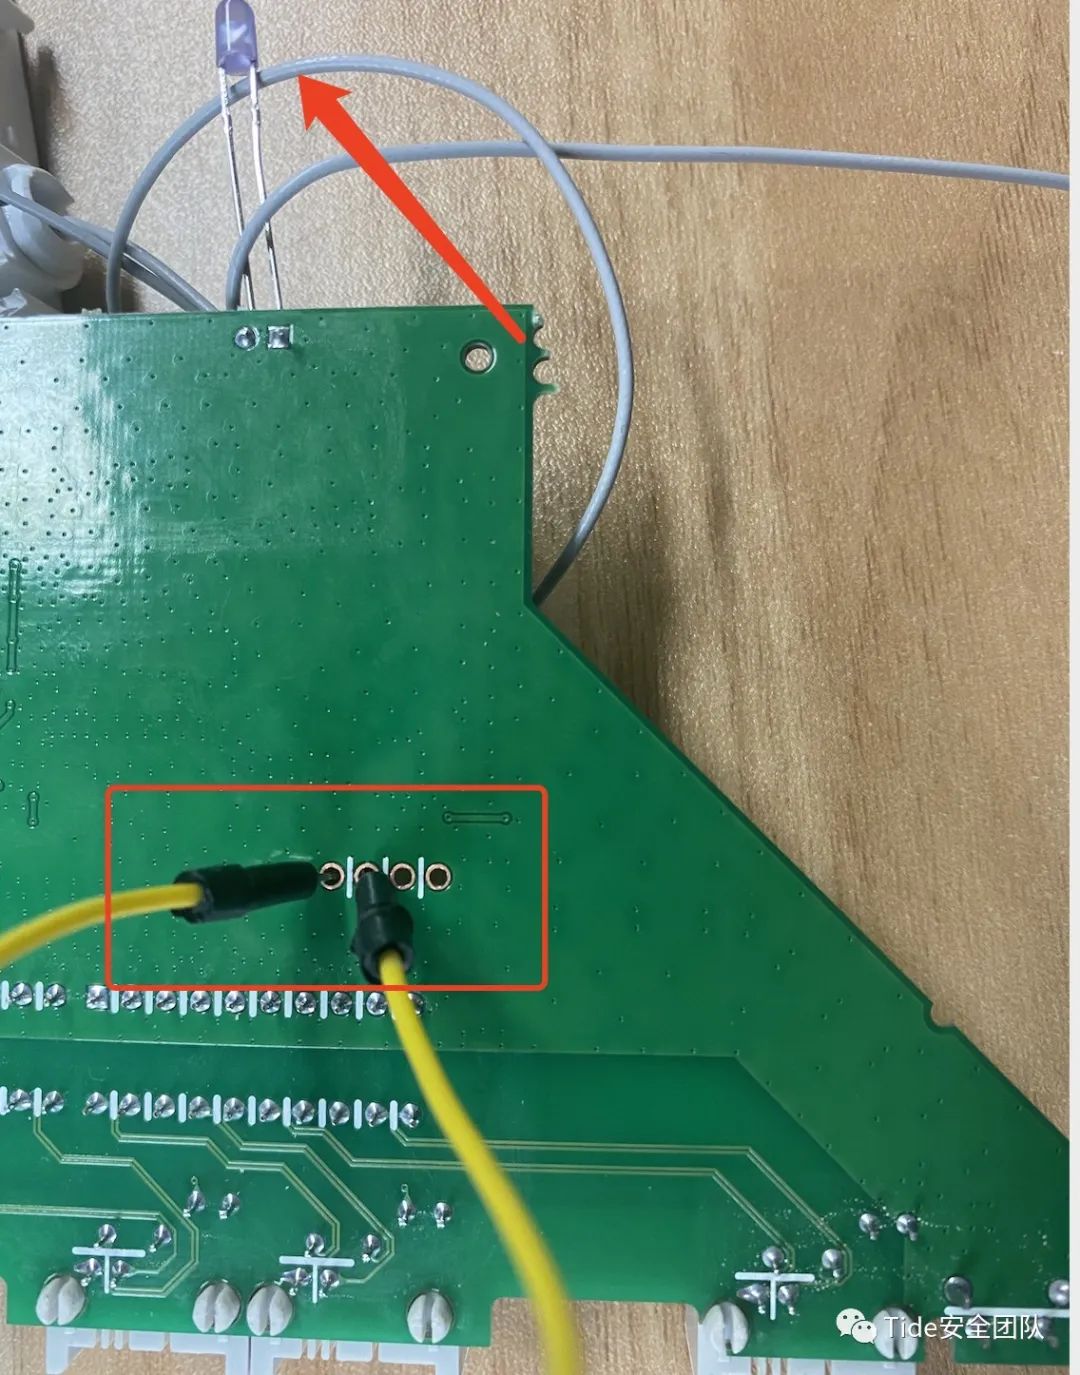
You can look for adjacent solder points or through-holes on the PCB. Generally, about 3-5 through-holes can be used as a preliminary positioning for the UART debugging serial port.
1. Locating GND
Set the multimeter to the beep mode, place one probe on the power solder point, and the other probe on the through-hole position for testing. The through-hole that beeps can be initially determined as GND.
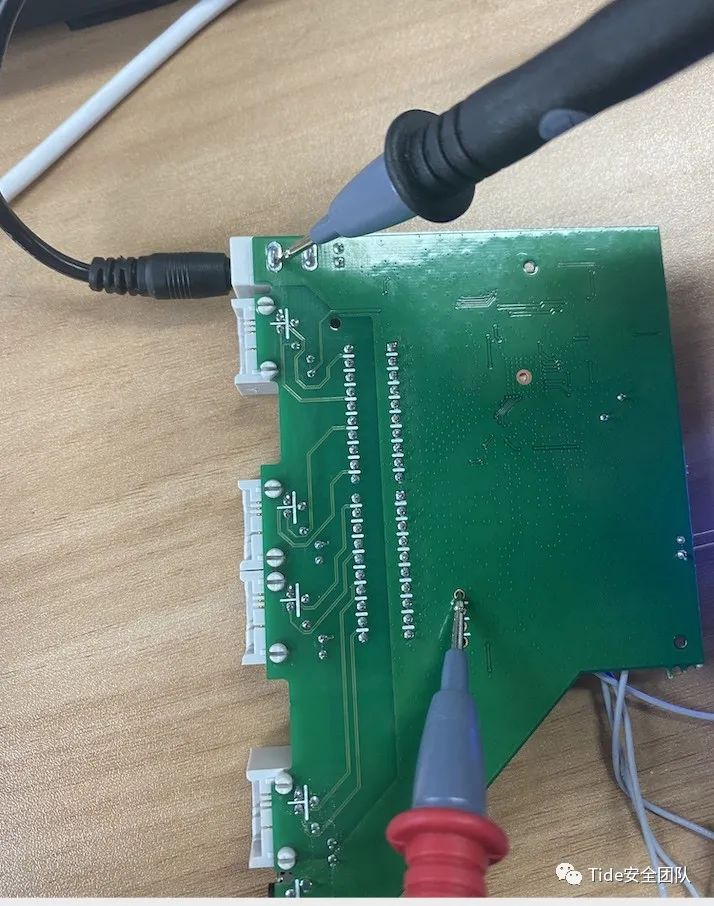
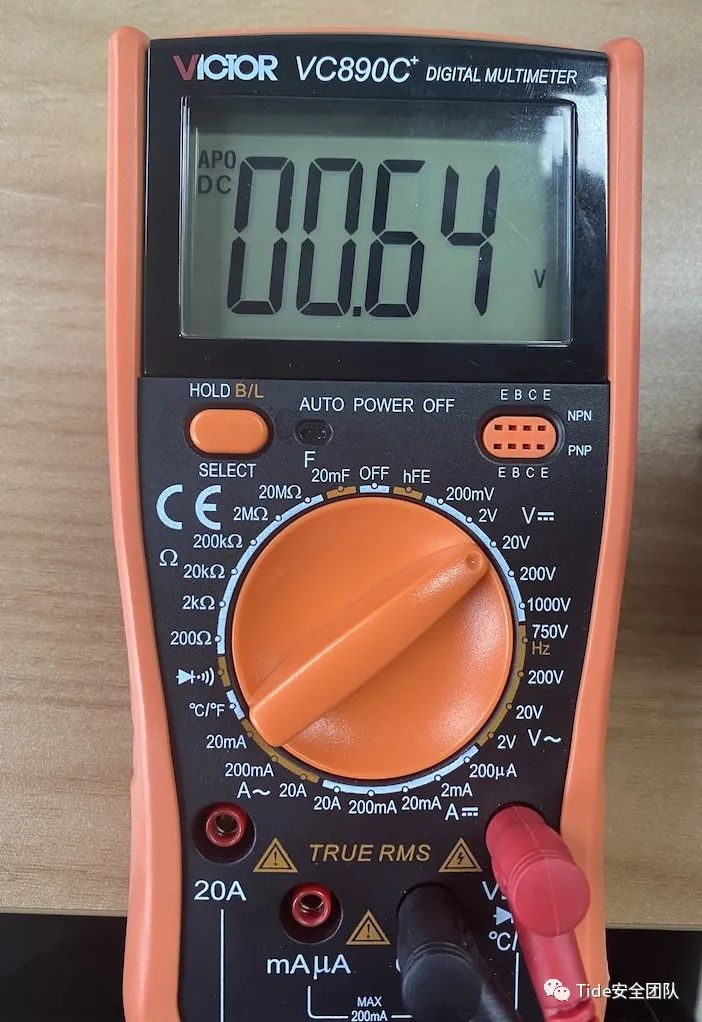
2. Locating VCC
Since the known VCC voltage is 3.3V, set the multimeter to 20V, place one probe on GND, and test other through-holes to see which one has a voltage of 3.3V. It was found that two pins were both 3.3V.
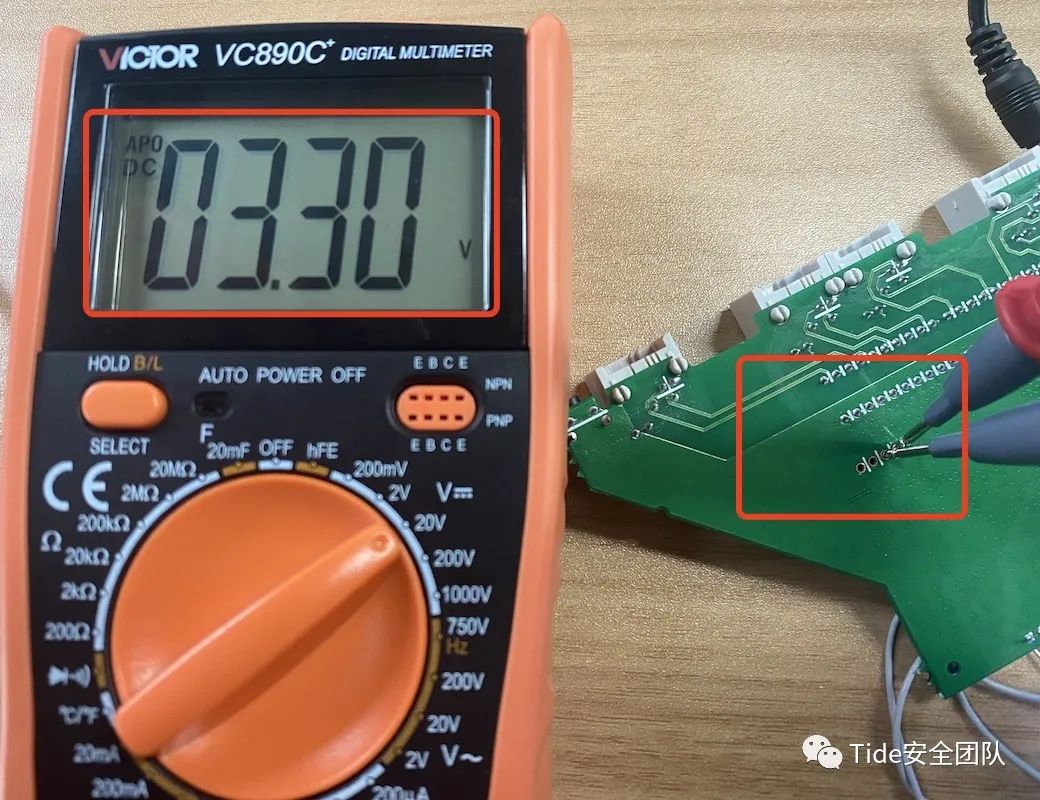
Since both pins are at 3.3V or 5V, we will use the VCC + GND positive and negative poles connected in a short circuit to finally determine the VCC pin. We will connect one wire to GND and test the other end against the two through-holes that are both at 3.5V. When we connect to the second hole, the power light goes out, so we determine that the through-hole is the VCC pin.
3. Locating TXD
Based on experience, the voltage of the TXD pin changes whenever there is data transmission during startup. You can determine the TXD pin by placing the probe into the remaining unidentified holes and observing the voltage changes upon rebooting the device.
4. Locating RXD
After locating the other three pins, the remaining one is the RXD pin….
Once the locations are determined, use the USB to TTL tool to connect to the computer in order.
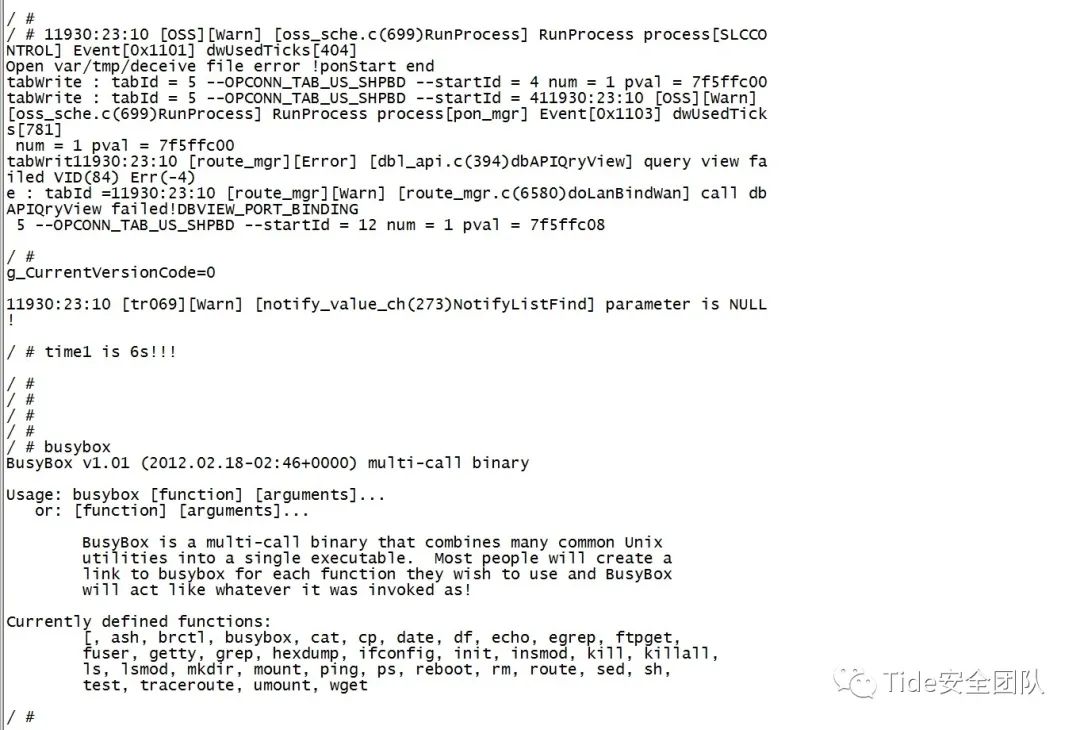
Open SecureCRT – select Serial – COM port – baud rate to connect to the UART serial port.
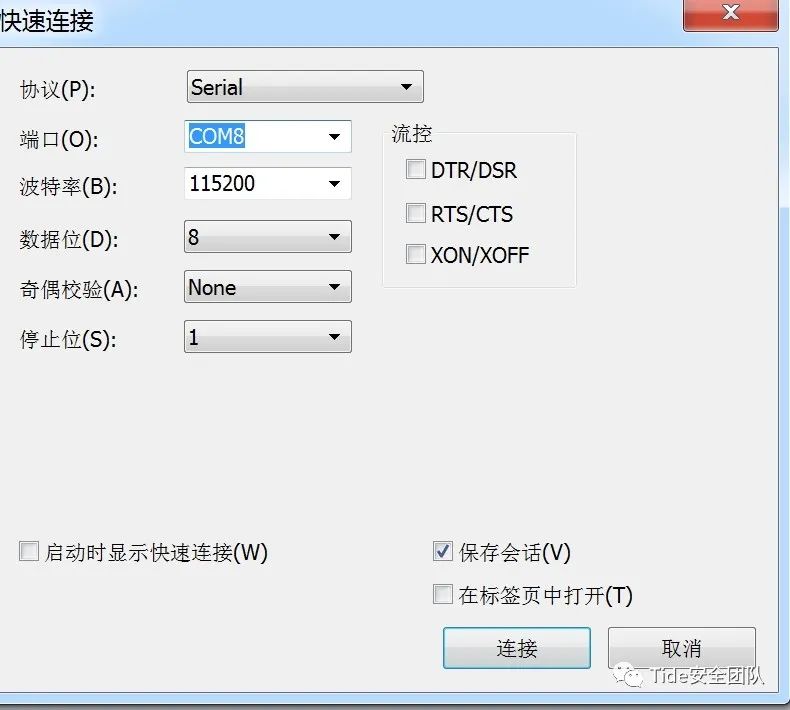
Successfully connected
0x06 Troubleshooting
Garbage Characters When Connecting to Device:
The first possibility is loose connections and reversed wire order.
This issue can be resolved by rechecking the through-hole positions and checking for poor contact, and re-soldering the pins.
The second possibility is that the baud rate is set incorrectly. You can try changing to a commonly used baud rate.
The commonly used baud rate is 115200, but depending on the device, you can judge the appropriate baud rate based on the situation.
1. Baud Rate:
The standard baud rate series specified internationally for the number of binary bits transmitted per second:
110, 300, 600, 1200, 1800, 2400, 4800, 9600, 14.4Kbps, 19.2Kbps, 28.8Kbps, 33.6Kbps, 56Kbps, etc.2. Baud Rate Factor
After the baud rate is specified, the input shift register/output shift register shifts at the specified baud rate under the control of the receiving/sending clock.
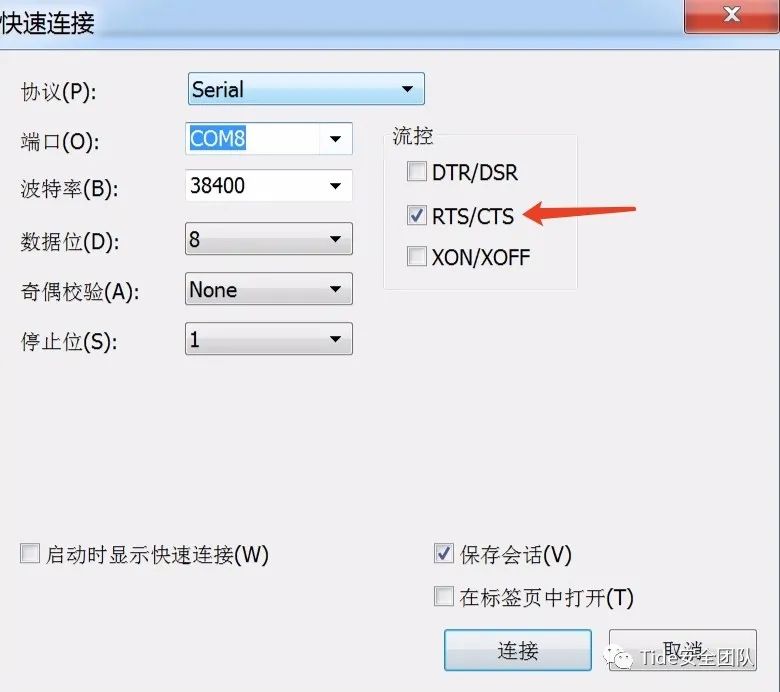
Readable but Not Writable When Connecting to Device:
In SecureCRT, go to Session Options -> Connection -> Serial -> Flow Control, and uncheck the default selected RTS/CTS to enable normal input.
0x07 References and Acknowledgments
https://www.jianshu.com/p/36540b602ef6
https://blog.csdn.net/oyaseng/article/details/81207999
https://paper.seebug.org/506/