1. Basic Principles
Three-dimensional fluorescence spectroscopy (EEM) constructs a three-dimensional data matrix (sample×excitation wavelength×emission wavelength) by scanning the fluorescence intensity of the sample at different excitation wavelengths (Ex) and emission wavelengths (Em).
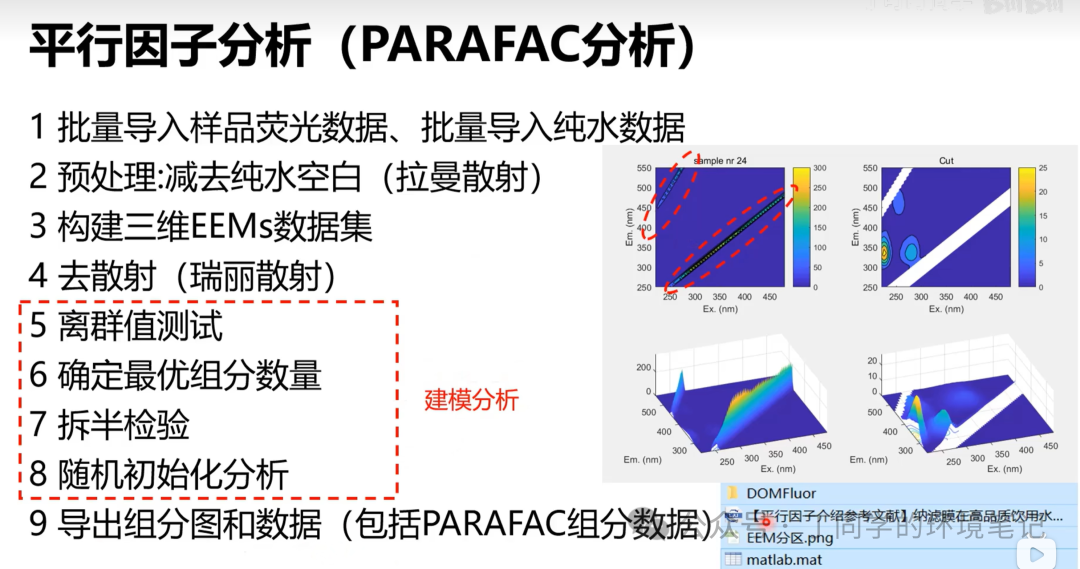
Parallel factor analysis (PARAFAC) is a mathematical algorithm based on trilinear decomposition theory, which uses alternating least squares (ALS) to decompose the complex three-dimensional fluorescence matrix into three load matrices with clear physical meanings.
2. Analysis Process and Steps
▶️Sample Preparation and Measurement:
After pre-treatment, samples (such as water, soil extracts, food, biological samples, etc.) are measured using a fluorescence spectrophotometer to obtainEEM data.
▶️Data Preprocessing:
Remove Rayleigh scattering and Raman scattering interference;
Perform inner filter effect correction (IFE correction);
Normalize the data to ensure data quality.
▶️PARAFAC Modeling Analysis:
Use the DOMFluor toolbox in MATLAB, the OpenFluor database, or other software (such as EFC software) to perform PARAFAC modeling;
Determine the optimal number of components (usually determined by residual analysis, core consistency tests, split-half analysis, etc.);
Obtain the excitation-emission spectral characteristics of each fluorescent component and their relative concentrations in the sample (Fmax values).
▶️Result Interpretation and Application:
Perform qualitative analysis based on the characteristic spectra of fluorescent components (such as excitation/emission peak positions) to determine the types of fluorescent substances (such as humic-like, protein-like, fulvic-like, etc.);
Use the relative concentrations of each component (Fmax values) for semi-quantitative analysis to explore the variation patterns of fluorescent substances under different sources and environmental conditions;
Combine with other auxiliary indicators (such as fluorescence index FI, humification index HIX, biological index BIX, etc.) to further analyze the sources, transformation processes, and environmental significance of organic matter.
⚠️Note
-
Minimum Sample Size: ≥10 (exploratory analysis only), ≥30 (robust modeling).
-
Core Principle: Samples must cover all possible fluorescence variations, and data must be strictly calibrated.
Code Access:
Send the keyword “Parallel Factor” to this public account to obtain the file download link
#ThreeDimensionalFluorescence #ParallelFactor #PARAFAC #DOM #MATLAB #Code #EnvironmentalEngineering #EPS #ExtracellularPolymer▶️Selected Past Articles:Three-Dimensional Fluorescence Background Removal + MATLAB Scattering Removal + Origin Plotting TutorialThree-Dimensional Fluorescence Area Integration TutorialPeking University Liu Sitong Team Nature Communication | Inter-species hydrogen transfer between cyanobacteria and symbiotic bacteria drives nitrogen loss