Hello everyone, I am the Mixed Bag Guy.
Today, I would like to share some knowledge about performance metrics in embedded systems. Embedded software performance metrics are important criteria for measuring the performance of embedded systems.
What are the commonly used embedded software performance metrics across various industries?
Performance metrics for embedded software typically focus on real-time performance and resource efficiency. Here are the most important metrics:
1. Real-time Performance
Real-time performance is not about being “fast”, but about being “on time”. — Hard real-time systems may allow slower speeds, but they must adhere to timing constraints.
This metric directly affects the interactivity of the system and is crucial in fields such as aerospace and industrial automation.
For example, in autonomous driving systems, the response time to sudden situations must be short enough to ensure safe driving. Generally, the response time for critical tasks needs to be controlled within milliseconds or even microseconds.
1. Real-time Performance Testing Tools
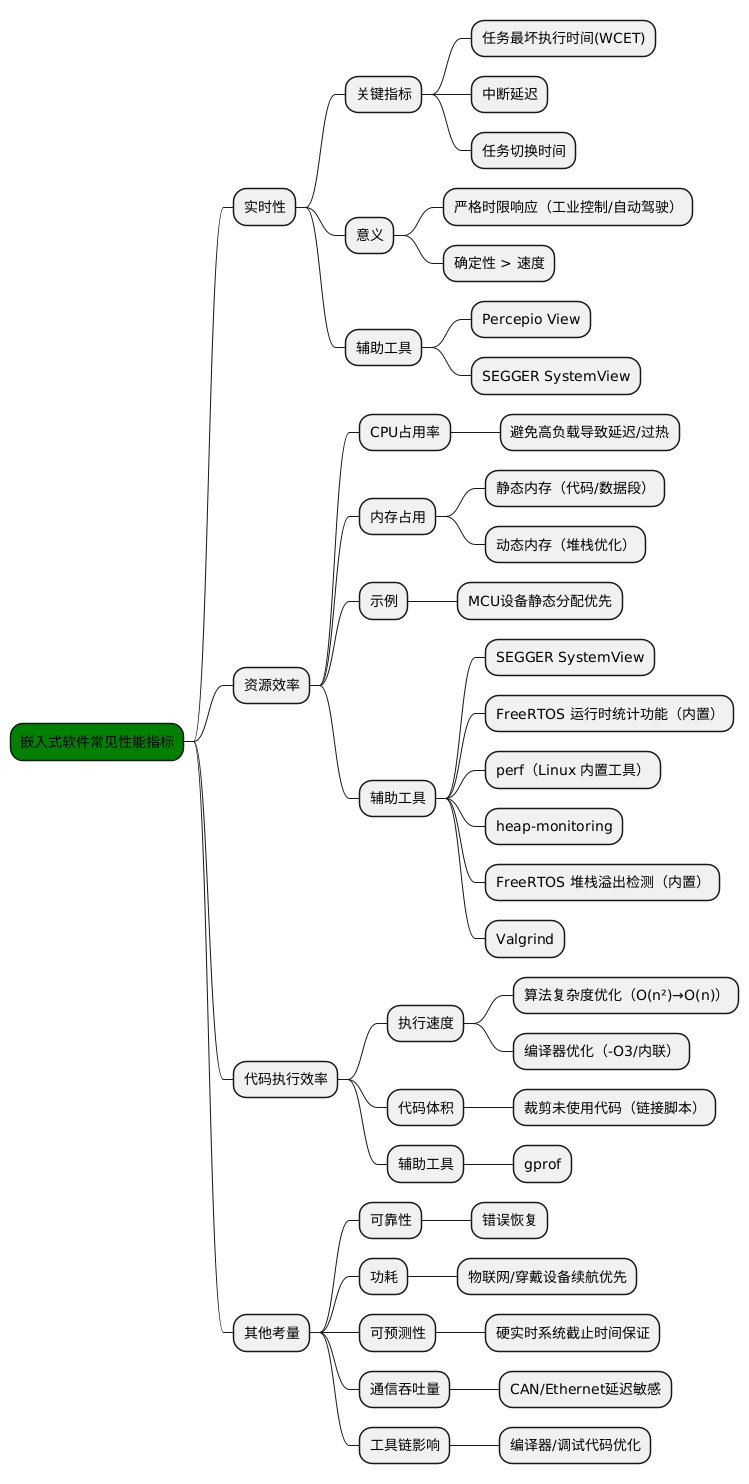
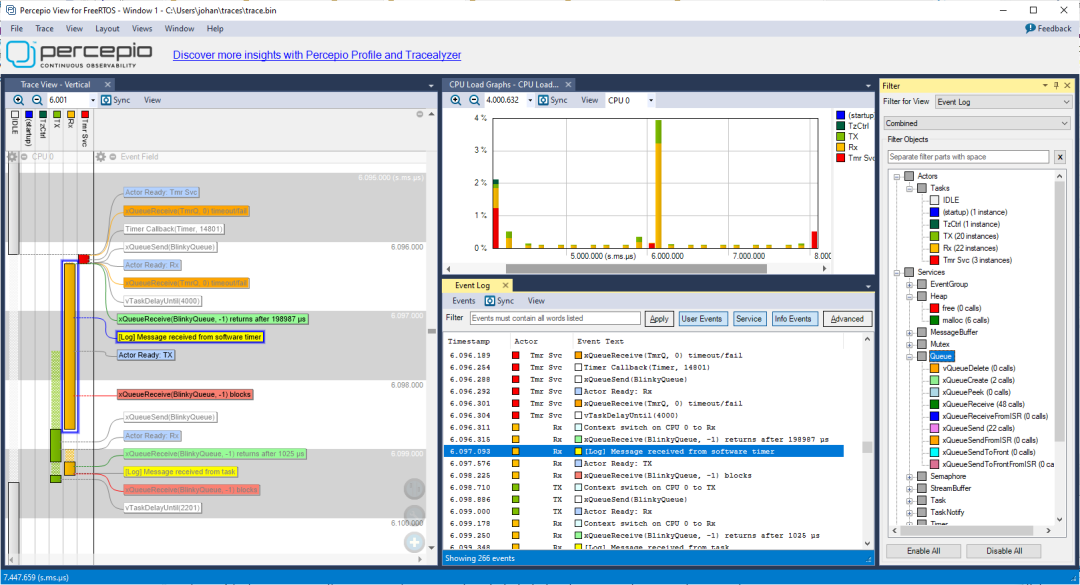
(1) Percepio View
Percepio View is a free tracing tool based on Percepio Tracealyzer, used for monitoring FreeRTOS applications, facilitating debugging and verification.
https://www.freertos.org/Documentation/03-Libraries/02-FreeRTOS-plus/05-FreeRTOS_plus_Trace/01-Percepio_View
Percepio View can be used in conjunction with traditional debuggers (such as ST-Link, J-Link) to visualize the real-time execution of tasks and ISRs, supplementing the debugger.
These tasks include FreeRTOS API calls and your own “user events”. It does not require any special tracing hardware.
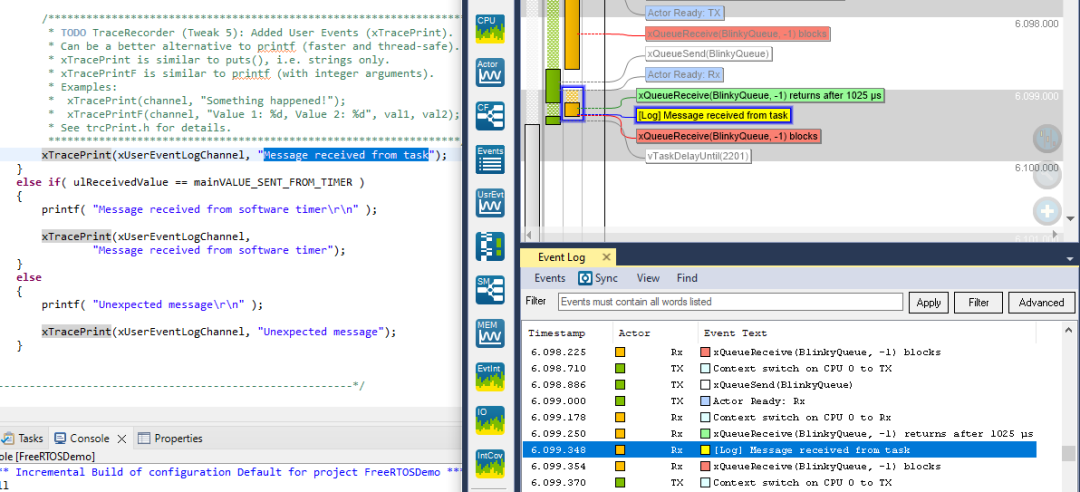
(2) SEGGER SystemView
SEGGER SystemView is a real-time recording and visualization tool used to analyze and describe the behavior of embedded systems.
It provides deep insights into runtime behavior, surpassing the capabilities of traditional debuggers.
SystemView is free for non-commercial use, and its functionality is not limited.
https://www.segger.com/products/development-tools/systemview/
SystemView is particularly suitable for complex systems with multithreading and interrupts, helping developers ensure their systems perform as expected, identify inefficiencies, and discover unexpected interactions or resource conflicts.
By recording monitoring data from the embedded system through the debugging interface, SystemView visualizes the execution of tasks, interrupts, and software timers in detail.
2. Resource Utilization Efficiency
This metric primarily measures the utilization of system hardware resources (such as CPU and memory).
By monitoring resource utilization, one can understand the software’s demand for and occupation of hardware resources, avoiding excessive occupation or waste of resources.
For example, if CPU utilization is consistently too high, it may lead to slower system responses or even crashes; excessive memory utilization may cause memory leaks and other issues.
CPU utilization is defined as the proportion of time the CPU spends executing computational tasks over a certain period to the total time. Specifically, CPU Utilization = 1 – Idle Time / Total CPU Time.
Reasonable resource utilization can enable the system to operate stably under limited hardware resources and reserve some resources for future functional expansions.
1. CPU Usage Analysis Tools
(1) SEGGER SystemView
SEGGER SystemView works with J-Link to capture task switches and interrupt events, analyzing CPU usage hotspots, supporting FreeRTOS, Zephyr, and other RTOS.
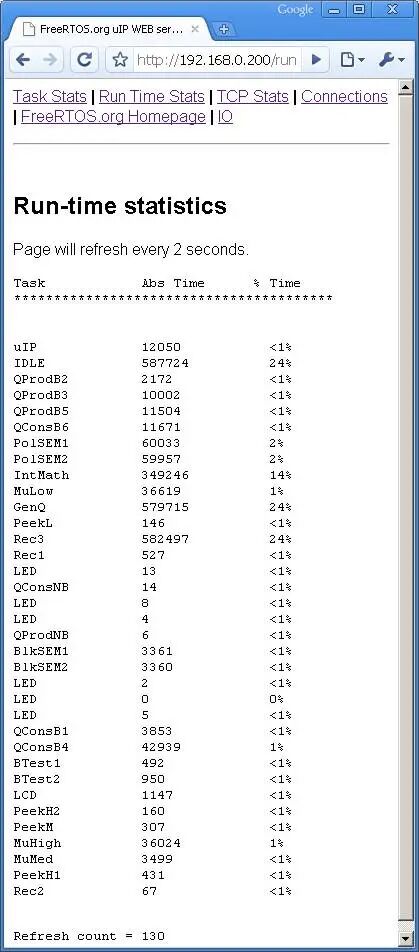
(2) FreeRTOS Runtime Statistics Feature (Built-in)
https://www.freertos.org/Documentation/02-Kernel/02-Kernel-features/08-Run-time-statistics
In FreeRTOS, enable it through config GENERATE_RUN_TIME_STATS, which counts the CPU usage and execution time for each task.
No additional tools are required; it is directly integrated into FreeRTOS, suitable for quickly locating high-load tasks.
(3) perf (Linux Built-in Tool)
perf is a performance event subsystem based on the Linux kernel, which can collect various performance data, such as CPU usage, memory access, function calls, etc.
Use the command:
perf record -e cpu-clock -g ./embedded_app  # Record CPU events
perf report  # Generate hotspot function analysis report
2. Memory Usage Analysis Tools
(1) heap-monitoring
heap-monitoring is a dynamic memory monitoring tool in SEGGER SystemView applications.
When applications use C or C++ heaps, multiple custom heaps, or memory pool objects provided by RTOS, heap-monitoring can track the usage of these objects, analyze their usage patterns, assess heap load, identify potential memory leaks, and track peak memory usage.
Usage:
Use SEGGER_SYSVIEW_HeapDefine to define the characteristics of the heap once.
Then use SEGGER_SYSVIEW_HeapAlloc and SEGGER_SYSVIEW_HeapFree to monitor its usage.
(2) FreeRTOS Stack Overflow Detection (Built-in)
In FreeRTOS, enable stack overflow detection for tasks through config CHECK_FOR_STACK_OVERFLOW.
Real-time monitoring of task stack usage prevents system crashes caused by memory overflows.
(3) Valgrind
Valgrind is a software development tool for memory debugging, memory leak detection, and performance analysis.
Previous articles: Tools | Using Valgrind Simulation Debugging Tool
The Valgrind toolkit includes several tools:
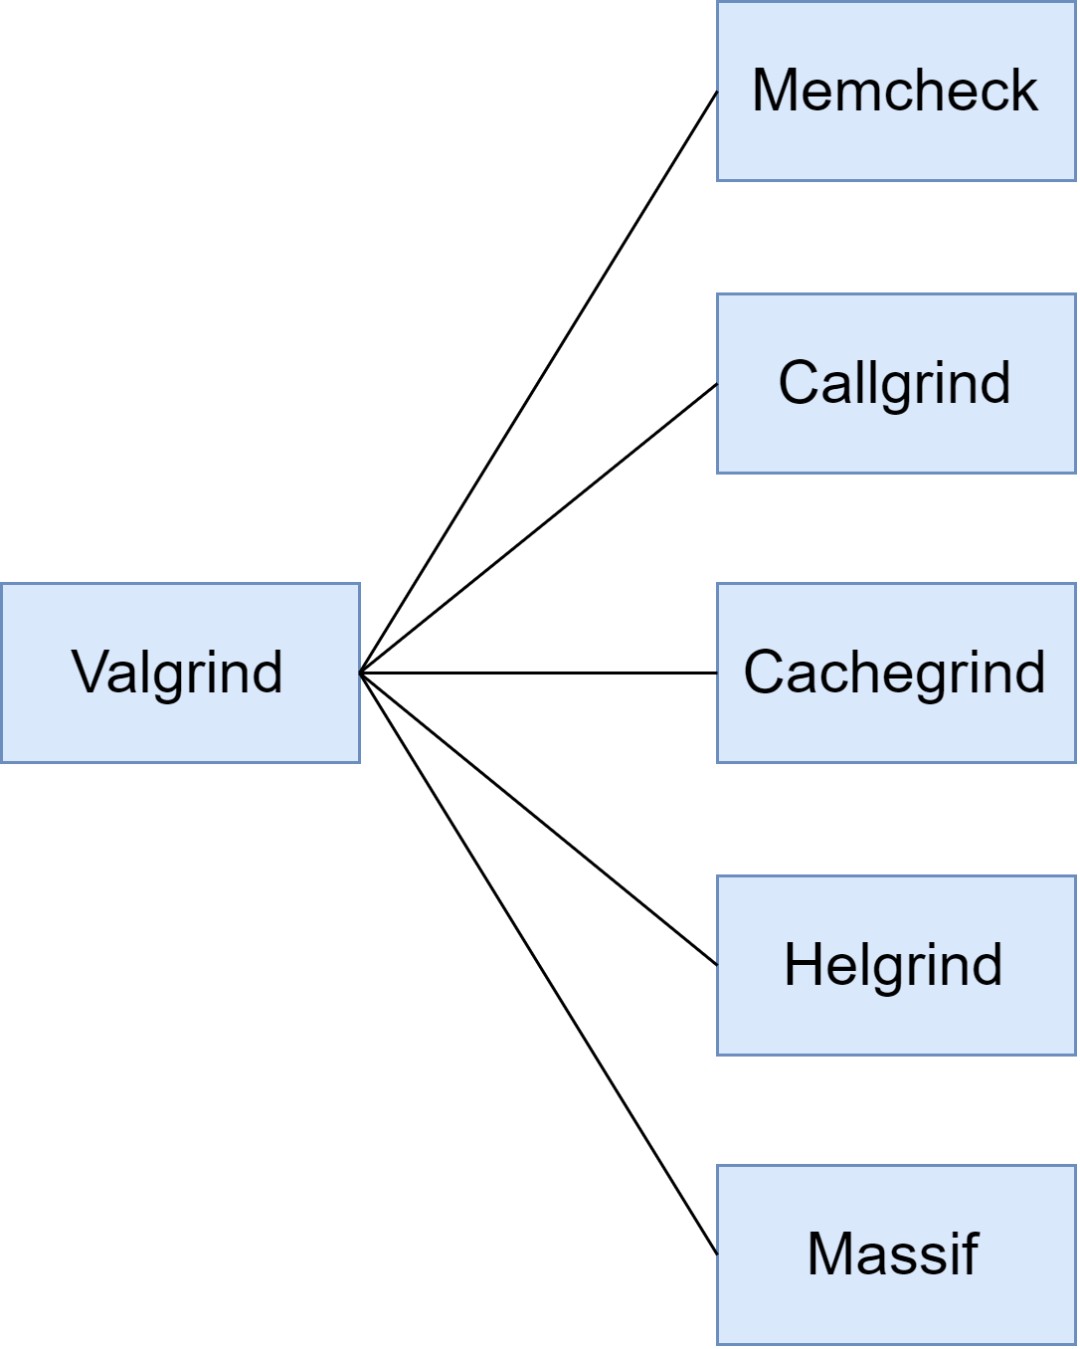
Among them, the Valgrind Massif tool is a heap profiler. It measures how much memory a program uses on the heap, telling us the size of heap blocks, heap management blocks, and stacks.
Valgrind Massif can help us reduce memory usage, and in modern systems with virtual memory, it can also speed up our program’s execution and reduce the chances of the program staying in the swap area.
Valgrind consists of a core and other debugging tools based on the core.
It simulates the program by first gaining control of the actual processor before the application runs, simulating a virtual processor based on the actual processor, and allowing the application to run on this virtual processor, thus monitoring the application’s execution.
The application does not know whether the processor is virtual or actual, and the already compiled binary code does not need to be recompiled; Valgrind directly interprets the binary code, allowing the application to run based on it, thus checking for possible errors during memory operations.
Therefore, programs running under Valgrind are much slower and use much more memory. It is best to use Valgrind on machines with good performance and during the development and debugging phase.
3. Code Execution Efficiency
Code execution efficiency directly affects the system’s reliability, real-time performance, power consumption, and cost.
- In image processing algorithms, consider balancing resource utilization by using lookup tables to improve efficiency.
- In communication protocol parsing, reduce the number of redundant string operation function calls.
1. Code Execution Efficiency Testing Tools
(1) gprof
GNU gprof is a classic performance analysis tool integrated into GCC, which can be used simply by adding compilation options, suitable for Linux/MPU or cross-compilation environments (such as ARM Cortex-A series), to locate algorithm or logic bottlenecks.
https://ftp.gnu.org/old-gnu/Manuals/gprof-2.9.1/html_mono/gprof.html
It can display the number of calls and execution time for each function, helping to locate hotspot code. For embedded development, it can be used in cross-compilation environments.
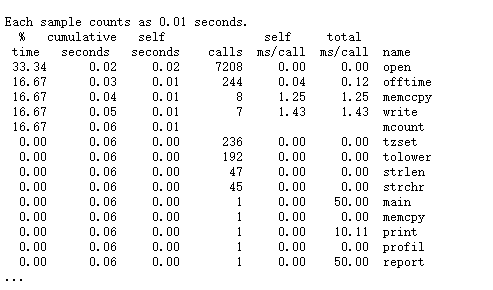
Enable analysis when compiling code:
gcc -pg -o my_app my_code.c
Generate analysis report:
gprof my_app gmon.out > report.txt
4. Other Metrics
- Reliability: For embedded systems, especially software used in critical fields (such as medical devices, traffic control, etc.), reliability is a crucial metric. Software needs to have fault tolerance, error recovery capabilities, and stability to handle various possible exceptions, ensuring the system runs continuously and stably.
- Power Consumption: Low-power design can extend device usage time, reduce charging frequency, and improve user experience. Additionally, for large-scale deployed IoT devices, reducing power consumption can lower operational costs and environmental impact.
- Predictability: Ensuring all tasks meet deadlines under any load (the core of hard real-time systems).
- Communication Throughput: In systems involving networks or buses (such as CAN, Ethernet), data throughput and latency are critical.
- Toolchain Impact: The impact of compiler optimization levels and debugging code (such as assertions) on performance needs to be evaluated in the release version.
If this article has inspired you, please take a moment to like or share it~

END
Source: Embedded Mixed Bag
Copyright belongs to the original author. If there is any infringement, please contact for deletion..▍Recommended ReadingThe company received a lawyer’s letter for using pirated AD software…In the future, if your code is fast and good, you will be a fool!!!Why is hardware harder than software, yet hardware engineers earn less than software engineers?→ Follow for more updates ←