Previously, when comparing Cambricon and Haiguang Information with 30 edge control chip companies, it was found that the valuation of AI server chip companies is an entire order of magnitude higher. This suggests that there may be a certain relationship between the valuation of chip companies and chip performance. This aligns with market logic: higher performance chip technologies have greater difficulty and barriers, and thus should have higher valuations. Therefore, the author has organized data from 30 SoC chip companies in an attempt to identify companies with overvalued or undervalued valuations.
Data Collection and Processing
First, the author collected the highest and lowest performance chip models from 30 companies.
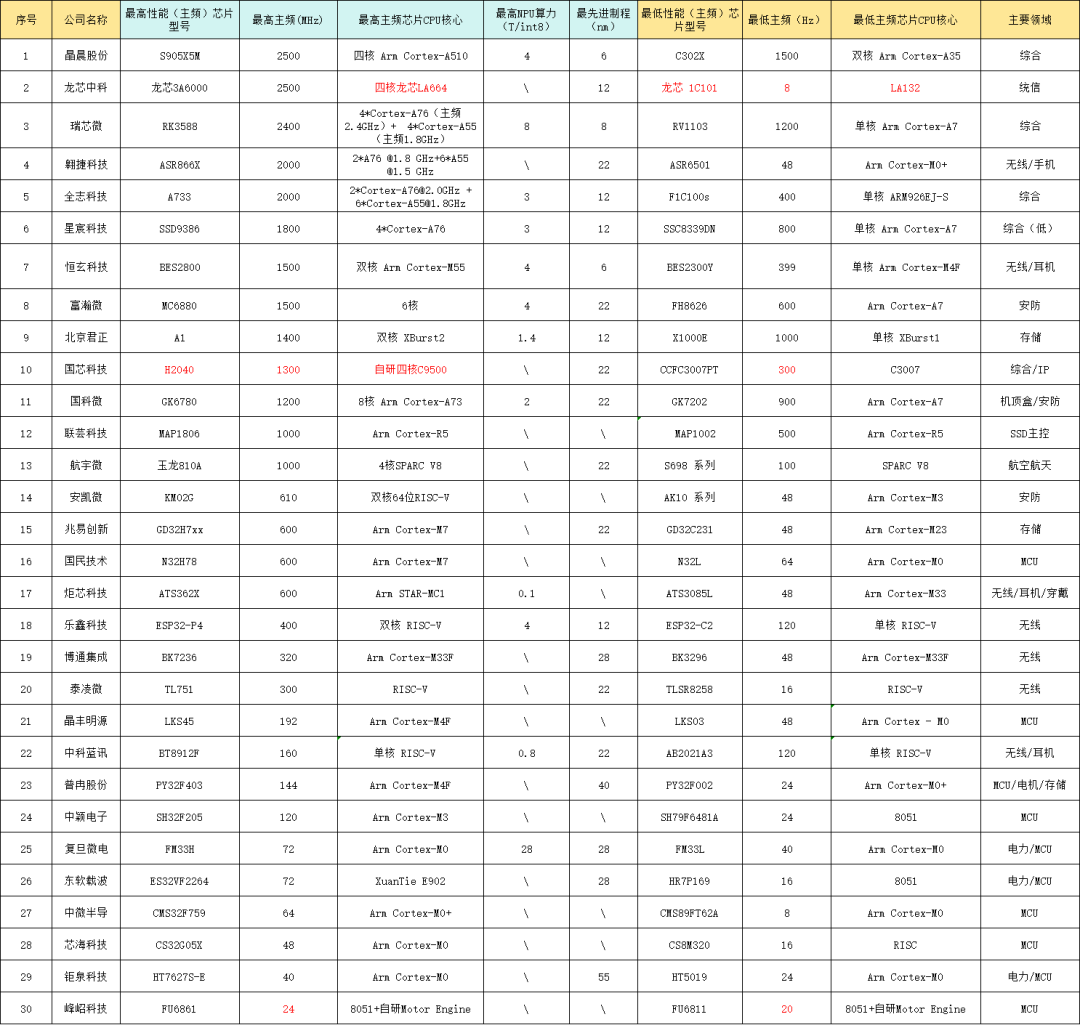
Since many chip companies provide specifications that are quite vague and difficult to find, the author could only do their best to gather information on the highest and lowest performance chips from the company’s official website, technical forums, chip specifications, news, and financial reports. Much of the information is inaccurate, but it can be used with some effort.
Performance Evaluation Criteria
Evaluating the performance of SoC chips is a complex task, as SoCs may include CPUs, GPUs, NPUs, and other computing units. The CPU also involves multiple cores, and performance is significantly related to the chip manufacturing process, making it difficult to establish a solid standard. Therefore, the author has broadly used the highest CPU core frequency of the highest performance chip as a standard for evaluating a chip company’s highest capability.
This is a very broad indicator, as it does not consider overall performance. For example, the Amlogic S905X5M and Loongson 3A6000 chips have a maximum frequency of 2.5GHz but only 4 cores; while the Rockchip RK3588 has 8 cores (4 [email protected] + 4[email protected]) plus 8T NPU computing power. Can we directly say that the RK3588 is inferior to Loongson and Amlogic? Clearly, we cannot. However, due to the author’s limited research capabilities, this is the best analysis that can be provided.
Company Classification
Subsequently, the author classified the companies into three categories based on the highest frequency.
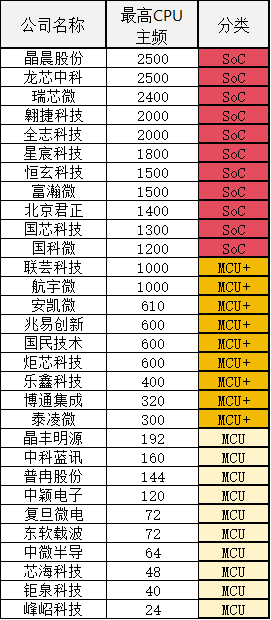
- Highest frequency above 1.0GHz (excluding 1.0) classified as True SoC companies;
- Highest frequency between 200MHz and 1.0GHz (inclusive) classified as MCU+ companies, which originate from MCU companies and have the potential to advance into the ranks of true SoCs as R&D progresses;
- Highest frequency below 200MHz classified as MCU companies.
Valuation Data
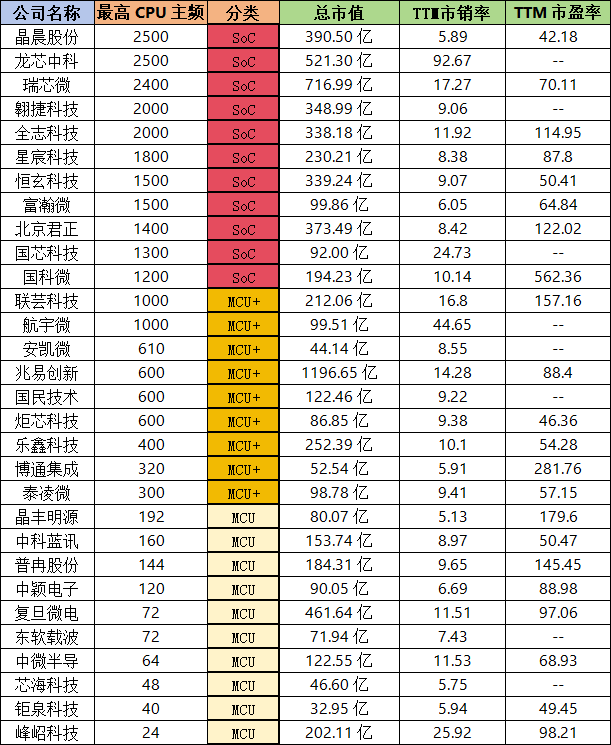
Finally, the market capitalization, TTM price-to-sales ratio, and TTM price-to-earnings ratio data for each company as of November 24 were filled in.
Conclusion
The conclusion is that no direct linear relationship was found, as the SoC chip has already passed the era where pure performance reigns. Various SoC chips have their own market domains. The die area of the CPU actually only accounts for about 30% to 70% of the SoC. In addition to performance, cost-effectiveness, wireless RF, software ecosystem, business ecosystem, interfaces, and quality (industrial and automotive standards) are all points that market products consider comprehensively.
However, some relatively unreasonable valuations that cannot be justified were still filtered from the data, and the author will continue to closely observe these targets.
——————————————————————————————For data source files and more discussions related to chips, feel free to scan the QR code to join the Wild Chip Researcher knowledge community.