Errors in ECG diagnosis are frequently encountered in clinical practice, often leading to incorrect clinical diagnoses, which in turn affects the selection of appropriate treatment plans. Therefore, improving the accuracy of ECG diagnosis is extremely important. This article analyzes some common causes of ECG diagnostic errors based on years of experience in reading ECGs, combined with relevant literature, and proposes corresponding countermeasures to prevent diagnostic errors for reference in work and study.
1. Poor performance of ECG instruments causing ECG errors
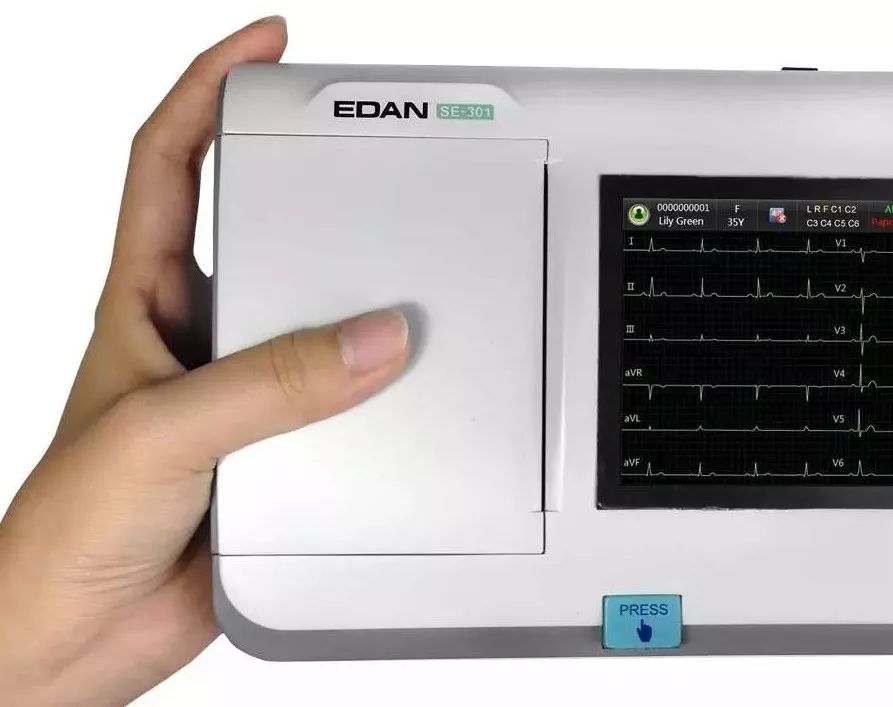
In recent years, with the rapid development of computer technology, biomedical technology, and ECG analysis technology, the development and production of ECG instruments have also advanced rapidly. However, there are still certain differences among the ECG instruments provided by various manufacturers. Some lower-quality ECG instruments can cause distortion in the ECG, creating some false impressions that lead to diagnostic errors. When encountering ECG errors due to poor performance of the ECG instrument, one should immediately contact the manufacturer for maintenance, improve the machine’s performance, or replace it with a high-quality ECG instrument.
2. Human operational errors and artificial artifacts leading to ECG diagnostic errors
Many misdiagnoses occur due to failure to recognize and eliminate certain human errors during ECG analysis. A study on ECG diagnostic errors found that human operational errors and artificial artifacts account for about 1% of ECG diagnostic errors. In China, it is estimated that ECGs are recorded for hundreds of millions of people every year, making the number of diagnostic errors caused by human operational errors and artificial artifacts staggering. Therefore, mastering correct operational techniques and preventing human positioning errors is crucial.
1. Common operational errors
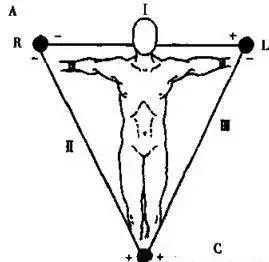
Reversed left and right limb lead connections: This is a common operational error where the left and right upper limb leads are connected incorrectly, causing the recorded six limb lead ECG patterns to resemble those of right heart position, i.e., lead I is inverted (the P and T waves of lead I are inverted, and the QRS main wave points downward), lead II and lead III are swapped, and lead aVR and lead aVL are swapped, while lead aVF remains normal. Observing the chest lead patterns reveals no characteristic changes of right heart position ECG, which can be used for differentiation. In addition to the errors mentioned above, one should also pay attention to the incorrect connections of upper and lower limb leads.
The simplest method to identify lead connection errors is to observe the ECG pattern of lead aVR. Under normal circumstances, the P and T waves of lead aVR point downward, and the main wave of the QRS complex also points downward. If the above errors occur, it generally causes the P and T waves of lead aVR to be upright. Whenever such abnormal changes are observed, one should consider the possibility of lead connection errors, immediately check, correct the erroneous connections, and re-record to avoid misdiagnosis.
Improper placement of chest electrodes: This error can affect the amplitude of the QRS complex. When the electrode position is raised by 2 cm, the amplitude of the R wave significantly decreases, and an rS-type wave may turn into a QS-type, which could be misdiagnosed as myocardial infarction. The method to prevent this error is to strictly follow operational protocols. The technicians or nurses recording the ECG should undergo standardized training in ECG procedures and hold a certification of completion. For hospitalized patients, when ECGs are recorded repeatedly, the position of the chest electrodes should be marked to avoid position changes that may lead to diagnostic errors.
The impact of using interference keys: Most ECG machines are equipped with interference keys. When using the interference key, the total amplitude of the P, Q, R, S, and T waves may decrease.
It has been reported that using the AC interference key alone decreases the amplitude by an average of 13.16%, while using the electromyographic interference key alone decreases it by 8.43%. When both keys are used together, the total amplitude decreases by an average of 17.54%, with a very significant difference (P<0.001).
It is recommended to avoid using interference keys in general, especially to avoid using both keys together. In special circumstances where the interference key is used, it should be noted in the ECG images and other relevant materials to ensure the authenticity and comparability of the images.
2. Common artificial artifacts
These include external AC current interference, patient muscle tremor interference, unstable ECG baseline, loose or disconnected lead wires, poor ground contact, poor electrode contact, telephone or mobile phone interference, improper timing of pressing the voltage calibration key, patient constitution, or pathological factors, all of which can alter the ECG patterns.
External AC current interference: This is characterized by a very regular fine waveform appearing in all leads at a frequency of 50-60 times per second. One should look for the source of interference, such as checking for AC electrical equipment in the surrounding environment, whether the patient’s limbs are in contact with a metal bed, whether the electrode plates are clean or rusty, whether the skin preparation under the electrode plates is adequate, whether the electrode plates are tied too tightly or too loosely, and whether the lead wires or ground wire have poor contact or are broken, and immediately address these issues.
Muscle tremor interference: Muscle tremor interference typically presents as rapid, irregular, fine, spiky waves at a frequency of 10-300 times, which can easily be misdiagnosed as atrial fibrillation. One should identify the causes, such as excessive tension in the subject, low room temperature, overly tight contact between the electrode plates and the skin, or narrow examination beds that prevent the relaxation of limb muscles, pathological spasms, and tremors such as hyperthyroidism and tremor paralysis.
Unstable ECG baseline that fluctuates up and down or suddenly rises or falls: This severely affects the correct interpretation of ST-T. One should immediately search for the cause and correct it. Common causes include patient movement or limb movement during ECG recording, unstable breathing causing baseline fluctuations in chest lead ECG, rusty electrode plates, excessive or insufficient conductive paste, tight pulling of lead wires, poor contact between electrode plates and skin, or exhausted dry batteries in the ECG machine or unstable AC power supply.
Loose or disconnected lead wires: This can lead to a sudden absence of waveforms in the ECG for a period, easily misinterpreted as sinus arrest or sinoatrial block. One should carefully check whether the electrode plates are securely connected, whether they have fallen off, whether there are copper wires falling off or broken at the lead wire ends, and take appropriate measures. Poor installation or improper connection of the ground wire can lead to poor contact with the ground wire.
The characteristic ECG manifestation is the appearance of continuous low-amplitude, uniform serrated waveforms at medium frequency. When this type of interference appears, correcting the contact of the ground wire will immediately eliminate the interference artifact. Another important role of the ground wire is to prevent the ECG machine from leaking electricity and posing a danger to the patient’s life. Please pay attention!
3. Failure to develop a systematic method of ECG analysis or lack of meticulous reading habits leading to ECG diagnostic errors
Developing a scientific method and habit of ECG analysis, and reading ECGs step by step, is a crucial step to ensure correct ECG diagnosis and prevent errors. Careful and meticulous reading, and analyzing and comparing waveforms as needed, is key to avoiding diagnostic errors. Many highly skilled physicians make diagnostic errors primarily due to carelessness. The main situations in clinical practice include:
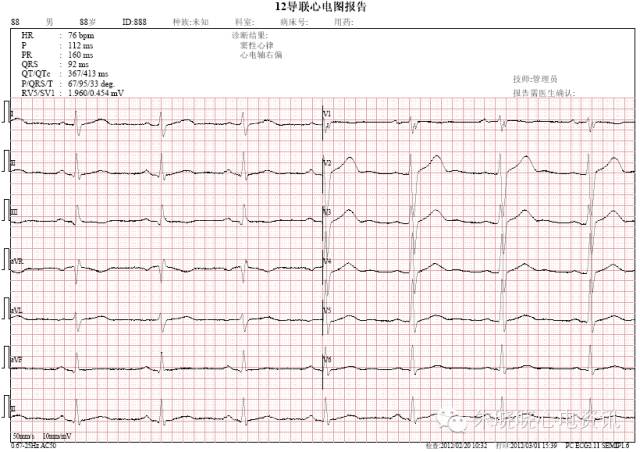
1. Neglecting the voltage calibration mark: Inexperienced physicians often overlook the voltage calibration mark, misdiagnosing a normal ECG as high voltage or low voltage. During the examination, if an automatic recording device is not used, a voltage calibration mark should be placed at both ends of all leads where the voltage remains unchanged; if part of the leads changes the calibration voltage, the changed voltage marks should be placed at both ends of all leads that have changed the calibration voltage, and their height and damping should be frequently checked.
2. Ignoring the P-R segment: The P-R segment reflects changes in the P-Ta segment and can provide valuable diagnostic information, such as acute pericarditis, atrial infarction, and atrial injury. Ignoring shifts in the P-R segment may lead to missed diagnoses of early acute pericarditis and changes in the ECG related to atrial infarction. The ECG manifestations of pericarditis traditionally include widespread ST-T changes, flattened T waves, isoelectric T waves, bidirectional or inverted T waves, and low voltage of the QRS complex along with sinus tachycardia as three main characteristics.
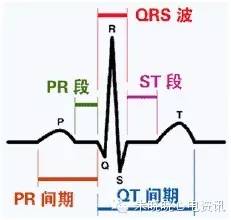
Recent studies have found that cardiac electrical alternans, the elevation of the ST segment in lead V6 and the T wave ratio, and the shift of the PR segment are three new characteristics of ECG manifestations of pericarditis, especially the elevation of the PR segment in lead aVR, which is characteristic of pericarditis and has high diagnostic value.
The ECG characteristics of acute pericarditis with PR segment shift are as follows: 1) The PR segment shift vector points towards the right upper (or right posterior), hence lead aVR (sometimes seen in lead V1) is always elevated, while most leads such as I, II, III, aVF, and V4~V6 show a depressed PR segment; 2) The shift amplitude is 0.05~0.15 mV; 3) Regardless of whether elevated or depressed, the shift morphology is often horizontal; 4) The direction of the PR segment shift is opposite to that of the ST segment vector, hence the lead with elevated ST segment has a depressed PR segment, and vice versa, the lead with a depressed ST segment has an elevated PR segment, especially evident in lead aVR.
The PR segment shift is also one of the characteristic ECG manifestations of acute pericarditis, generally appearing in the early stages of acute pericarditis, specifically before the elevated ST segment returns to the isoelectric line and before the T wave inverts, with a relatively short duration. It may represent the earliest ECG abnormality in acute pericarditis, even the only visible ECG change, and should be given attention for early diagnosis.
3. Not noticing the shortening of the P-R interval: Misdiagnosing pre-excitation syndrome as bundle branch block, ventricular hypertrophy, or myocardial infarction. Some may only notice that the P-R interval is normal without realizing that there is a pre-excitation wave at the starting point of the QRS, widening of the QRS, and accompanying secondary ST-T changes, leading to the missed diagnosis of Mahaim bundle pre-excitation waves.
The ECG manifestations of pre-excitation waves or pre-excitation syndrome involving the Mahaim bundle are as follows:
1) The ECG presents a pre-excitation syndrome pattern similar to left bundle branch block; when the heart rate is fast, the pre-excitation wave increases, and when the heart rate is slow, the pre-excitation wave decreases or disappears. This is frequency-dependent, intermittent pre-excitation syndrome, which differs from left bundle branch block in that the patients are often younger and without organic heart disease, experiencing tachycardia.
2) The change in the QRS waveform from negative to positive in the chest leads appears after lead V4; the R wave in leads V2~V4 is greater than 40 ms, while the Q wave in leads V5~V6 decreases or disappears.
3) After atrial fibrillation occurs, the size of the pre-excitation wave varies significantly.
4) The QRS electrical axis is between 0° and 75°.
5) When reentrant tachycardia occurs, the QRS complex is wide and deformed, resembling a left bundle branch block pattern. The electrical axis is significantly leftward, and sometimes resembles the QRS-T waveform of right ventricular apex pacing, with the QRS main wave in leads V1~V4 pointing downward, while lead I remains R-type.
6) Mahaim bundle pre-excitation waves and Mahaim bundle pre-excitation syndrome are rare and should be distinguished from anterior wall myocardial infarction and left bundle branch block.
4. Ignoring the J wave: The junction point between the end of the QRS complex and the ST segment is called the J point. If its amplitude increases and persists for a certain period, it is called a J wave. Ignoring the J wave can lead to missed diagnoses of hypothermia, hypercalcemia, and ischemic J wave changes in the ECG.
5. Failing to recognize hidden P waves (P′ waves) within the ST-T segment: This can lead to missed diagnoses of arrhythmias such as atrial premature beats, atrial tachycardia with atrioventricular block, second-degree and complete atrioventricular block, etc. If an elevation is found in the ST segment, with notches or deformations in the T wave, attention should be paid to whether there are hidden P waves or P′ waves.
6. Not performing a comprehensive observation and measurement of the QRS duration: Misinterpreting some components of the QRS complex (the initial Q wave or terminal S wave) as retrograde P waves. To find the lead with the widest QRS complex for measurement can reveal that the so-called retrograde P waves are actually part of the QRS complex.
7. Ignoring the U wave: The small U wave is a normal component of the ECG, and an enlarged U wave indicates low potassium or the effects of certain medications (such as quinidine); a giant U wave is often associated with Torsades de Pointes ventricular tachycardia. The upright T wave in chest leads and inverted U wave (at rest or after exercise tests) is an important indicator for diagnosing myocardial ischemia.
8. Failing to recognize the λ (Lambda) wave: The terminal part of the ascending limb of the QRS and the descending limb both have notches, combined with the downward sloping ST segment elevation and inverted T wave, resembling the Greek letter λ (Lambda), referred to as the λ wave. Some past cases were considered atypical Brugada syndrome, but both the ECG performance and clinical characteristics, as well as molecular biology test results, indicate that it has distinct characteristics different from Brugada syndrome, thus the λ wave has been established as an independent ECG marker for identifying patients at high risk of sudden death.
The λ (Lambda) wave manifests as downward sloping ST segment elevation in the inferior leads; it resembles non-ischemic “single-cell action potential-like” changes or presents as a composite wave of QRS-ST, which is formed by the slow descent of the ST segment and the subsequent inverted T wave.
9. Ignoring lead aVR: In the six-axis system, lead aVR is located in the right upper frontal plane, with its negative pole at 300° in the left lower quadrant, between leads I and II. Due to the emergence of chest leads and the emphasis on leads I and II, lead aVR is often overlooked.
In recent years, researchers have pointed out that lead aVR has significant application value in diagnosing ischemic heart disease, myocardial infarction, arrhythmias (differentiating left anterior fascicular block, wide QRS tachycardia, and narrow QRS tachycardia), acute pericarditis, predicting malignant arrhythmias, and acute pulmonary embolism. For example, Vereckei proposed a simplified new process for differentiating wide QRS tachycardia using lead aVR in 2008, which is simple, quick, and relatively accurate, suitable for emergency clinical situations, with an accuracy of 91.5%, sensitivity of 96.5%, and specificity of 75%.
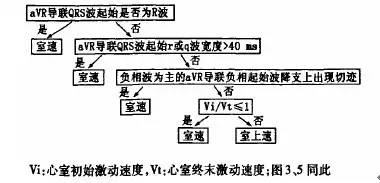
Figure: Vereckei’s simplified new process for differentiating wide QRS tachycardia using lead aVR proposed in 2008.
4. Lacking the ability to differentiate similar ECG changes, leading to misdiagnosis
Insufficient systematic knowledge of ECG leads to overlooking some ECG changes with diagnostic value, resulting in incorrect diagnoses.
1. Not observing comprehensively and diagnosing based solely on individual lead waveforms: For example, if the P wave amplitude in leads II and III is similar, the P wave in lead I may be flat and difficult to detect. If one does not understand Einthoven’s equation, it is easy to misdiagnose based solely on the waveform of lead I as junctional rhythm.
2. Misdiagnosing the TUP phenomenon or multifocal atrial tachycardia as atrial fibrillation.
3. Confusing normal variant or positional Q waves with pathological Q waves: Abnormal Q waves in leads aVL, III, and aVF, or QS-type in leads V1 or V2 may be normal variants or positional Q waves. Noticing related leads such as I, II, and V3 without abnormal changes and without significant ST-T changes, lowering the chest lead recording by one intercostal space, and recording the ECG vector diagram can facilitate differential diagnosis.
It is important to emphasize that the ECG vector diagram can provide a more accurate basis for differential diagnosis, so please pay attention!
4. Misdiagnosing left bundle branch block and left ventricular hypertrophy changes in the right chest leads as anterior wall myocardial infarction: Left bundle branch block and left ventricular hypertrophy can both show QS-type in leads V1~V2, and combined with corresponding ST segment elevation, it is easy to misdiagnose as anterior wall myocardial infarction. Noticing the morphology, degree, and stability of QRS voltage elevation in chest leads and ST segment elevation in right chest leads makes differentiation straightforward. If necessary, use the ECG vector diagram for differentiation.
5. Misdiagnosing sinus tachycardia with “giant R wave” ST segment elevation as ventricular tachycardia: Multi-lead observation shows that the QRS wave in leads without ST segment elevation is not widened, although TP fusion occurs, careful observation reveals that each QRS complex is preceded by a related P wave.
6. Missing severe hyperkalemia: In cases with widened QRS duration and low or absent P waves, one should consider the possibility of hyperkalemia. If there are clinical causes of hyperkalemia, immediate treatment should be initiated without waiting for laboratory reports, as the patient may experience cardiac arrest during the waiting period.
7. Misdiagnosing atrial flutter with 2:1 atrioventricular conduction as sinus tachycardia or atrial tachycardia: This occurs because one of the F waves overlaps with the ST-T segment. When encountering narrow QRS tachycardia at around 150/min, one should consider the possibility of atrial flutter with 2:1 atrioventricular conduction, carefully observing leads II, III, aVF, and V1, and if necessary, using carotid sinus massage to assist in diagnosis.
8. Misdiagnosing multifocal atrial tachycardia as atrial fibrillation: Because both have fast and irregular ventricular rates. Careful observation reveals that in the former, each QRS complex is preceded by a related P wave, with variable P wave morphology and a non-fixed P-R interval.
9. Ignoring the Wenckebach cycle: Grouped heartbeats often contain a Wenckebach cycle. Measuring the P-P or R-R intervals and noting whether they have the characteristic of “shortening then lengthening” can help calculate the atrial or ventricular rate based on the number of P-P (R-R) intervals within the Wenckebach cycle and the missed heartbeats, leading to a correct diagnosis.
10. Misdiagnosing branch-type ventricular tachycardia as supraventricular tachycardia combined with intraventricular conduction delay: When tachycardia presents with right bundle branch block and left axis deviation, one should be alert to the possibility of branch-type ventricular tachycardia. Careful observation of each lead is necessary to check for any atrioventricular dissociation, and if necessary, use esophageal leads to reveal the truth of atrial activity.
5. Aging of ECG knowledge or knowledge deficits leading to ECG misdiagnosis
1. Misdiagnosing interference-related atrioventricular dissociation as high-degree atrioventricular block: In cases of first-degree atrioventricular block accompanied by a relative increase in atrial rate, changes similar to high-degree atrioventricular block can occur in the ECG.
Based on the R-P interval of the ventricular capture + P-R interval, one can infer the atrial rate received below, thus ruling out high-degree atrioventricular block. Complete atrioventricular dissociation is only one of the conditions for diagnosing complete atrioventricular block; another condition is that the ventricular rate is significantly slow (<45/min). Atrial dissociation with a ventricular rate close to the atrial rate is often interference-related. If the atrial rate exceeds the ventricular rate, it indicates block-related atrioventricular dissociation, i.e., complete atrioventricular block.
2. A P-R interval of ≥0.12s does not necessarily reflect a conductive relationship between the P wave and QRS wave; it may also be coincidental: In sinus rhythm and junctional rhythm, during atrioventricular dissociation, the standards for diagnosing ventricular capture are: 1) it appears early; 2) the P-R interval reaches a conductive level; both must be present. In cases where the baseline rhythm has a significantly prolonged P-R interval, early appearing heartbeats with a P-R interval ≥0.12s do not indicate a conductive relationship between the P wave and QRS wave.
3. Misdiagnosing complete atrioventricular block as 2:1 atrioventricular block: This occurs because the atrial rate is exactly double the ventricular rate, with two P waves visible before each QRS complex; careful measurement shows the P-R interval is not constant, while in 2:1 atrioventricular block, the P-R interval is constant.
4. Misdiagnosing rapid atrial fibrillation as supraventricular tachycardia: In rapid atrial fibrillation, because the f waves are not obvious and the ventricular rate is too fast, the R-R intervals may seem regular, easily misdiagnosed as supraventricular tachycardia. Careful measurement shows that the R-R intervals are still irregular, often >0.03s.
5. Misdiagnosing pre-excitation with atrial fibrillation as ventricular tachycardia: WPW syndrome with Af occurs in 11-39% (significantly higher than the general population of 0.5-2%). The manifest is more common than the concealed; multiple bypasses are more common than single bypasses; WPW syndrome with atrial fibrillation shows wide and deformed QRS complexes, requiring caution in differentiating it from atrial fibrillation with ventricular tachycardia. The differentiation points are shown in Table 1. Ventricular tachycardia can sometimes also present with irregular R-R intervals, but the difference between R-R intervals is <0.03s, while in pre-excitation with atrial fibrillation, the difference between R-R intervals is often >0.03s.
Table 1: Differentiation points between WPW syndrome with Af and Af with ventricular tachycardia
|
WPW syndrome with Af |
Af with ventricular tachycardia |
|
|
RR interval difference |
≥130ms |
<130ms |
|
Wide QRS waveform |
Shows variability (different pre-excitation levels), initial vector same as δ vector, often appears blunt |
Identical source waveform (occasional ventricular fusion wave) |
|
Narrow QRS regularity |
Delayed appearance (increased weight of normal conduction) |
Early appearance (ventricular capture) |
|
Clinical situation |
Has a history of recurrent SVT, WPW syndrome ECG manifestation before and after episodes |
Often has organic heart disease, especially after myocardial infarction, consider ventricular tachycardia, predicting accuracy can reach 85%; right ventricular dysplasia, long QT syndrome often has a family history; drug poisoning and electrolyte disturbances leading to wide QRS tachycardia often have corresponding history for reference. |
6. Misdiagnosing an occasional long R-R interval in atrial fibrillation as accompanying second-degree atrioventricular block: Atrial fibrillation with hidden conduction in the atrioventricular junction can cause long R-R intervals. If one of the following two criteria is met, it can be diagnosed as second-degree atrioventricular block:
1) R-R intervals lasting over 1.5s, with a ventricular rate below 40 beats/min. In a long interval of 1.5s, the ectopic impulses of atrial fibrillation have not been conducted downwards, although some cases may relate to hidden conduction, it is unreasonable to explain it solely by hidden conduction. Clinically, long R-R intervals often occur with digitalis overdose or late-stage atrial fibrillation, while early atrial fibrillation and patients not using digitalis never exhibit long R-R intervals. Therefore, in most cases, R-R intervals longer than 1.5s are caused by second-degree atrioventricular block. If it occurs more than three times, it can avoid coincidental occurrences, making the diagnosis more reliable.
2) The presence of junctional or ventricular escape beats, occurring more than three times. The appearance of escape beats indicates that the ventricular rate has slowed to a level that threatens circulatory function; the ECG may show a long and constant R-R interval amidst an irregular ventricular rate. In junctional escape beats, the escape cycle is 1-1.5s, corresponding to 40-60 beats/min, while in ventricular escape beats, the QRS complex is wide and deformed ≥0.12s. In junctional escape beats, since the QRS complex is the same as normal, the diagnosis relies on the delayed appearance, fixed escape cycle, and constant R-R intervals.
7. Not understanding the diagnostic methods and steps for wide QRS tachycardia: Common causes of wide QRS tachycardia (WRT) include ventricular tachycardia (VT), supraventricular tachycardia (SVT) with intraventricular conduction delay, bundle branch block, and pre-excitation syndrome (WPW) with SVT. Their ECG presentations are similar, but the clinical significance differs, thus differential diagnosis is extremely important.
Many ECG technicians are not proficient in the diagnostic methods and steps for wide QRS tachycardia, such as the Brugada four-step method, the WRT differentiation criteria proposed by Griffith, the four-step method for differentiating wide QRS tachycardia using lead aVR, and the Vi/Vt value for diagnosing wide QRS tachycardia, making it difficult to correctly differentiate between ventricular tachycardia and supraventricular tachycardia with intraventricular conduction delay, as well as between ventricular tachycardia and supraventricular tachycardia with bypass conduction.
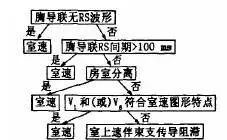
Figure: Brugada four-step method
6. Ignoring clinical data leading to ECG misdiagnosis
Many ECG changes are non-specific, and only by combining them with clinical data can a more reliable judgment be made. For example:
1. Not understanding the patient’s age, gender, and clinical situation, diagnosing some normal variants as pathological conditions.
2. For patients suspected of having idiopathic long QT syndrome or Brugada syndrome, it is crucial to inquire about any history of syncope and whether any family members have experienced sudden death. In patients with recurrent syncope, the ECG may show prolonged QT intervals and the phenomenon of U wave electrical alternans. Understanding their family history and past syncope history can confirm a diagnosis of hereditary long QT syndrome.
3. In differentiating wide QRS tachycardia, the patient history is very important. A history of recurrent wide QRS tachycardia without a history of heart disease, especially in young people, often suggests supraventricular tachycardia or pre-excitation syndrome; a history of organic heart disease, especially after myocardial infarction, should first consider ventricular tachycardia, with predictive accuracy reaching 85% in patients with old myocardial infarction. Right ventricular dysplasia and long QT syndrome often have a family history; drug poisoning and electrolyte disturbances leading to wide QRS tachycardia often have corresponding history for reference.
4. The ECG can be a double-edged sword in diagnosing pulmonary embolism. To correctly utilize the ECG for diagnosing pulmonary embolism, it must be combined with the patient’s history and various auxiliary examination results. The symptoms and signs of pulmonary embolism are non-specific; one must be adept at identifying issues from clinical syndromes and be timely in conducting auxiliary examinations for confirmation. The ECG manifestations of pulmonary embolism closely resemble myocardial ischemia from coronary heart disease and can easily be confused with old myocardial infarction.
5. Tall T waves should raise suspicion of possible hyperkalemia. If the patient presents with oliguria or anuria, disappearing or faint P waves, widened QRS waves, and tall T waves, it may indicate hyperkalemia. In such patients, if accompanied by sinus tachycardia or other supraventricular tachycardia, without paying attention to the medical history, it may be misdiagnosed as ventricular tachycardia.
6. In some acute pericarditis cases, ST segment elevation may only be significant in a few leads and appear arc-shaped upwards, resembling AMI. It is necessary to combine the medical history (nature of chest pain), myocardial enzymes, and echocardiography for evaluation.
Source: ECG Assistant
Guarding the health of patients with chest pain!
Long press to identify the QR code to follow