Author:
This FAQ is applicable to S32DS IDE, including various versions of S32DS for ARM/Power/Vision. The problems and solutions are accumulated through continuous use, and this article serves as a “starting point”. The journey of MCU debugging is long and arduous. I hope that readers, especially engineers, can summarize and reflect on their daily work – “gathering small efforts to achieve great results”. Ultimately, using S32DS IDE should become second nature, allowing for efficient handling of bugs.
Content Summary
Introduction
1. How to start multicore debugging?
2. How to download and debug S19/HEX/BIN/elf compilation results from non-S32DS IDE projects?
3. How to view special registers (SPR) of the e200Zx series CPU cores in Qorivva MPC57xx and S32R series MCUs?
4. How to view disassembled code and debug assembly instructions?
5. How to protect specific NVM (Flash/EEE) address contents from being erased during program download?
6. How to load different Flash algorithm files for programming Data-Flash and external QSPI Flash?
7. How to attach for debugging and locating bugs?
8. How to export programming results from memory to S19/HEX/BIN files?
9. How to efficiently set and manage application debugging breakpoints?
10. How to view global variables?
11. How to dynamically monitor variable changes during debugging?
12. How to find the help documentation for S32DS IDE?
Conclusion
Introduction
As the saying goes, “To do a good job, one must first sharpen their tools.” In my previous article titled “S32DS Usage Tips – Common Issues in SDK Usage (FAQ)”, I shared several common issues related to SDK and Processor Expert usage in S32DS IDE. To further assist everyone in effectively using S32DS IDE, this article summarizes common problems and solutions encountered during application debugging in S32DS IDE, hoping to provide inspiration and assistance.
1. How to start multicore debugging?
Currently, S32DS IDE supports most parts of NXP Qorivva MPC57xx and S32R series, as well as MAC57D5xx (Halo) and S32V series, which are multicore (dual-core or triple-core, or even more) CPU MCUs. The next generation S32K2xx and other S32 series will also include multicore parts, so S32DS IDE naturally needs to support multicore debugging.
Taking S32R274 as an example, here’s how to start multicore debugging in S32DS for Power:
First, create a multicore application and compile it successfully;
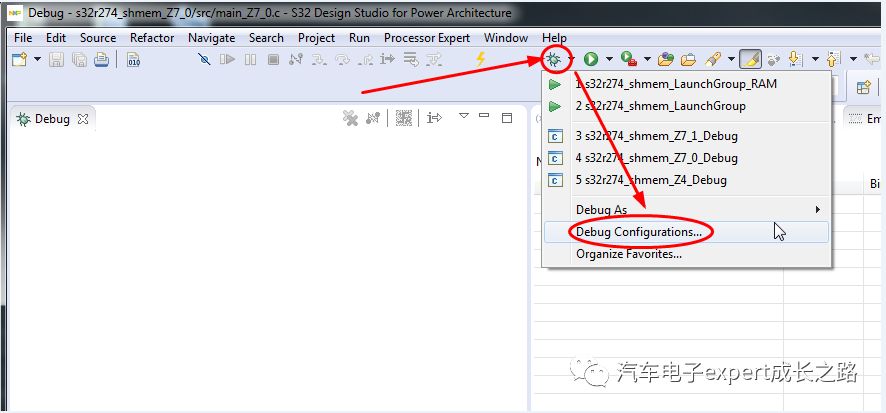
Then, select any core’s application project, right-click –> Debug Configuration, or click the shortcut menu in the image below to select Debug Configuration to open the project’s debug configuration interface:
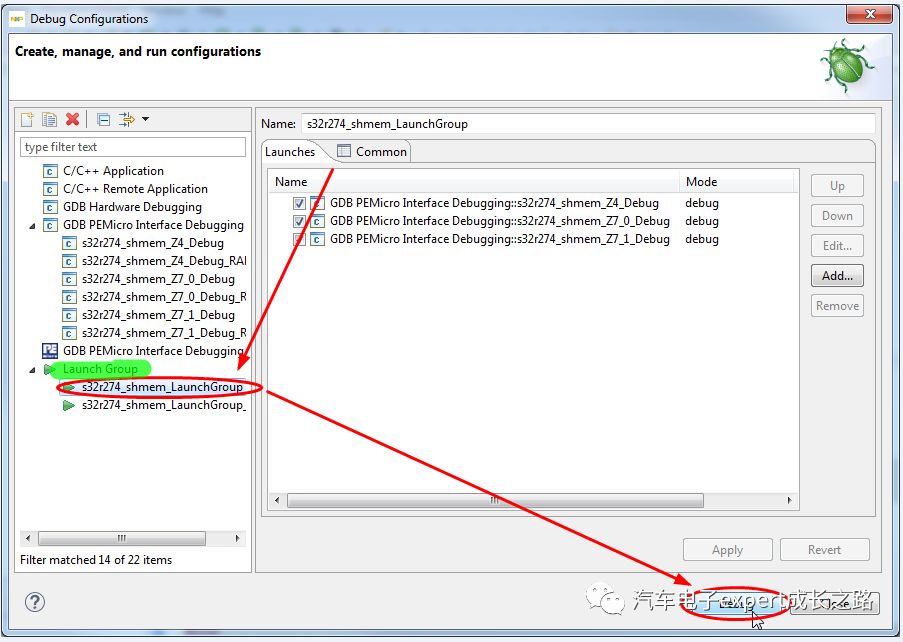
In the debug interface, click to open the Launch Group on the left side, select the different compilation targets corresponding to the multicore debugging targets, and then click Debug to start multicore debugging:
Once all core debugging has started, the debug interface will look like this, automatically stopping at the default breakpoint at the beginning of each core’s main() function. You can select different core debugging targets in the upper left Debug window to switch to the corresponding core for application debugging and breakpoint settings, as well as viewing registers and variables;
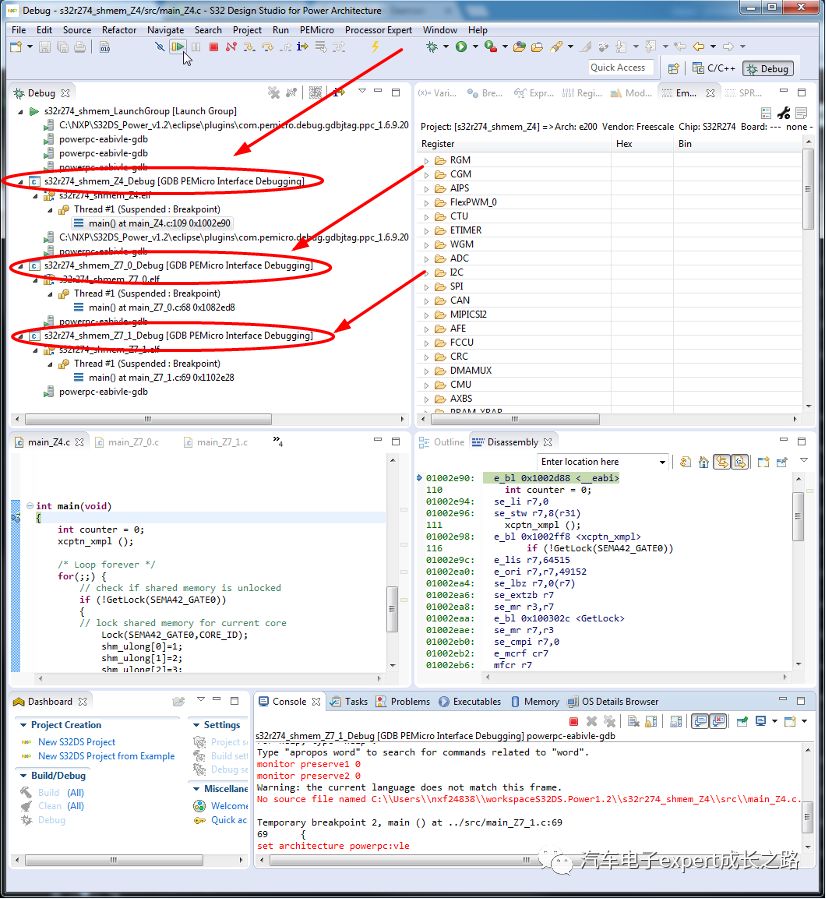
Tips: During multicore debugging, the operation and control of each core are independent, allowing multiple cores to run/pause simultaneously; however, only one core’s debug information can be viewed at a time;
Tips: For multicore MCUs, you cannot debug non-boot_core applications separately, such as downloading and debugging only the Z7_0 and Z7_1 cores of S32R274; because after each MCU reset, it starts running from the boot_core, and if the boot_core has not started, the other cores cannot function at all;
2. How to download and debug S19/HEX/BIN/elf compilation results from non-S32DS IDE projects?
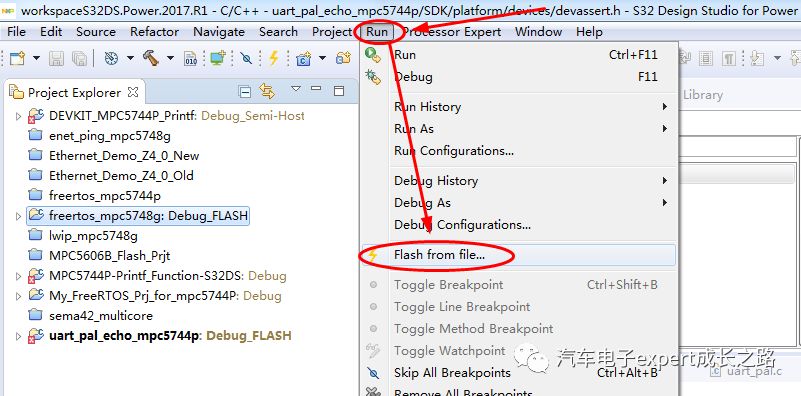
You can use the Flash from file tool in S32DS IDE to download S19/HEX/BIN/elf compilation results from non-S32DS IDE projects: from the menu Run –> Flash from file to start the corresponding software interface:
For specific methods and steps, please refer to my previous article (click the article title to jump to read): “S32DS Usage Tips – Using Flash from file to download S19 or elf files“;
If you also need to debug elf compilation results from non-S32DS IDE projects, you can use the Attach function in S32DS. For details, please refer to my previous article (click the article title to jump to read): “S32DS Usage Tips – How to configure and enable the Attach function to locate software program bugs and complete joint debugging of bootloader and application projects“;
3. How to view special registers (SPR) of the e200Zx series CPU cores in Qorivva MPC57xx and S32R series MCUs?
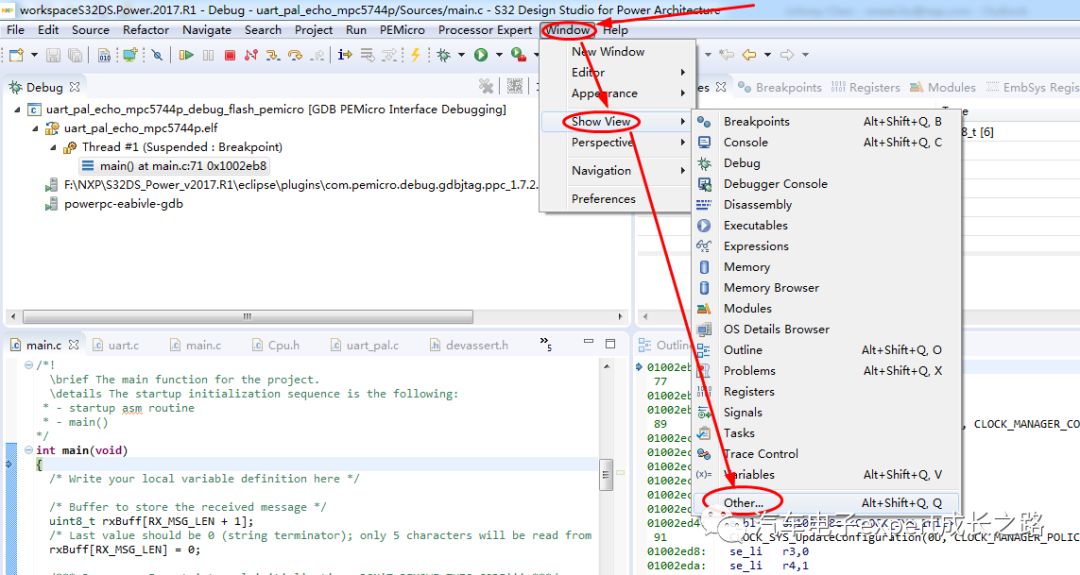
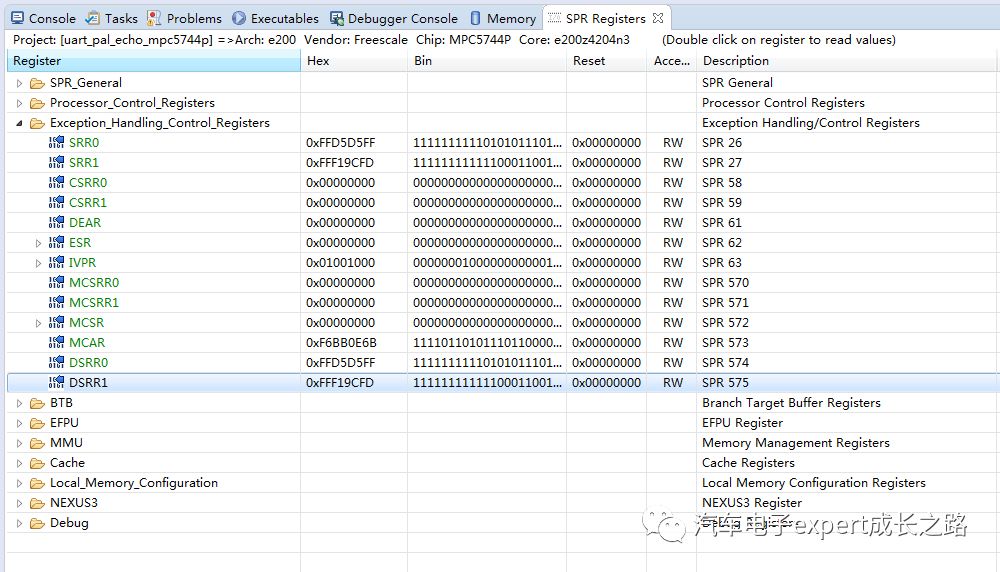
When debugging Qorivva MPC57xx and S32R series MCUs, tracking issues often requires viewing the special registers (SPR) of the e200Zx series CPU cores. The default Register window in S32DS for Power’s debug interface only lists the core’s general registers. To view special registers (SPR), you need to use the SPR Register window, which can be opened as follows:
Select the menu Windows –> Show View –> Others..:
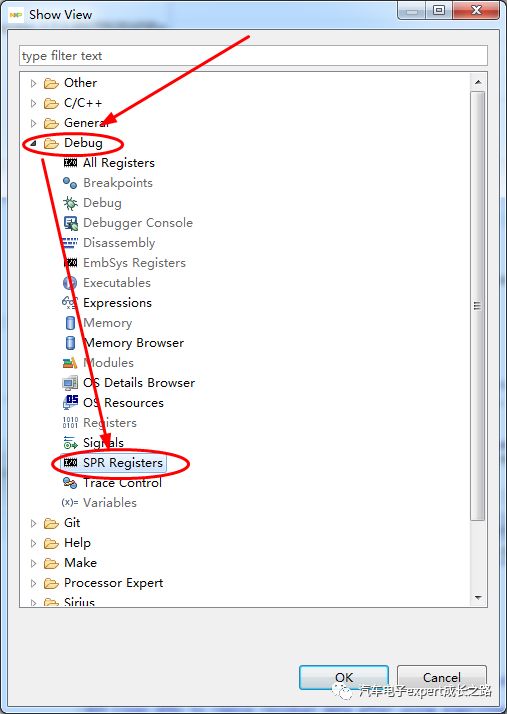
In the opened Show View window, select Debug –> SPR Registers:
This will open the SPR Register window, where you can click on the name of the special register you want to view to display the current value of that SPR:
4. How to view disassembled code and debug assembly instructions?
During debugging, viewing the disassembled code of the application and performing assembly-level debugging can help us locate and resolve issues. In the default S32DS IDE debug interface, the disassembly window is usually not opened. For C code-level debugging, you can click the debug shortcut icon shown in the image below to open the application’s disassembly window — Disassembly window, which also enables single-step debugging of assembly instructions:
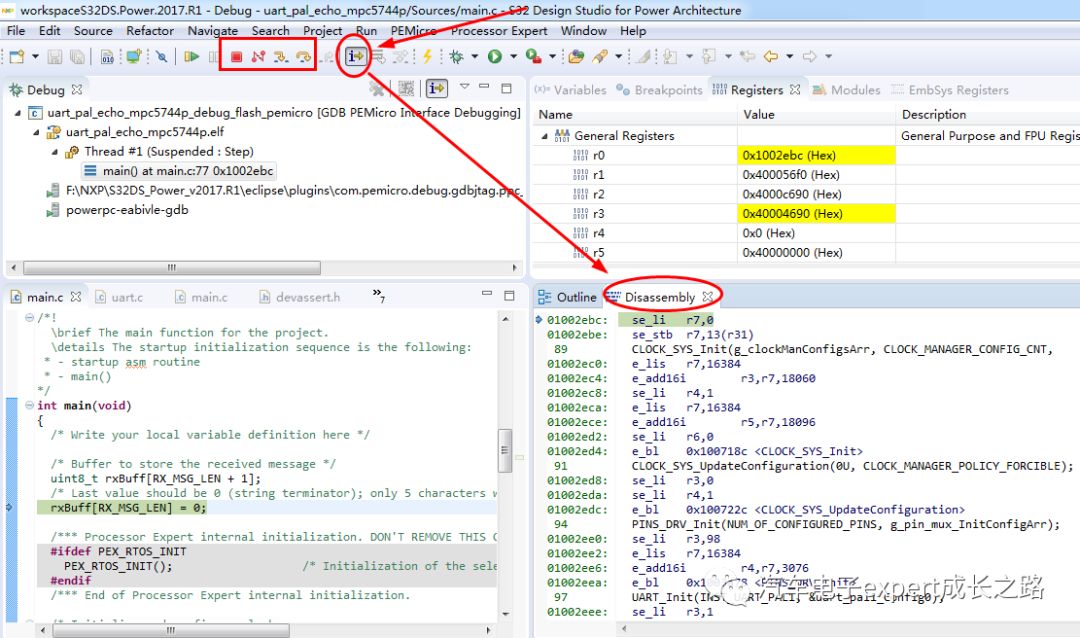
Tips: Please note that if you find that viewing debug control (step, enter/exit function) in the C source code window is slow, it is likely because the single-step debugging feature for assembly instructions has been enabled. Please double-check if the debug shortcut icon shown above has been clicked (pressed).
5. How to protect specific NVM (Flash/EEE) address contents from being erased during program download?
When developing a bootloader or conducting calibration tests, it is often desired that the current application project download does not affect the Bootloader/APP or calibration data stored in other NVM (Flash/EEE) addresses outside its occupied address. This requirement can be achieved by setting the memory protection feature:
The specific method is as follows:
In the debug configuration interface of the application project, select the debug target, and in the Debugger section, click on Advanced Options to open the advanced options window for the debugger:
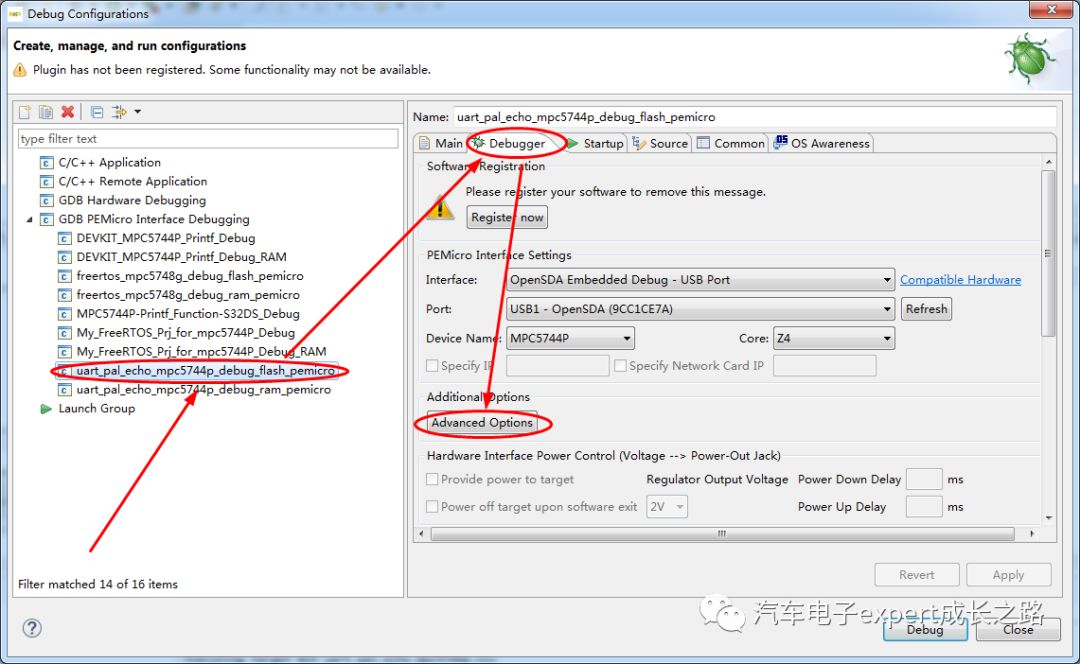
In the popped-up advanced options window for the debugger, check Preserve this range (Memory Range 0/1/2) and enter the correct corresponding starting address (From) and ending address (To) for protection. For example, the following image sets protection for the MPC5744P address starting from 0xF80000 for 64KB of Code-Flash space:
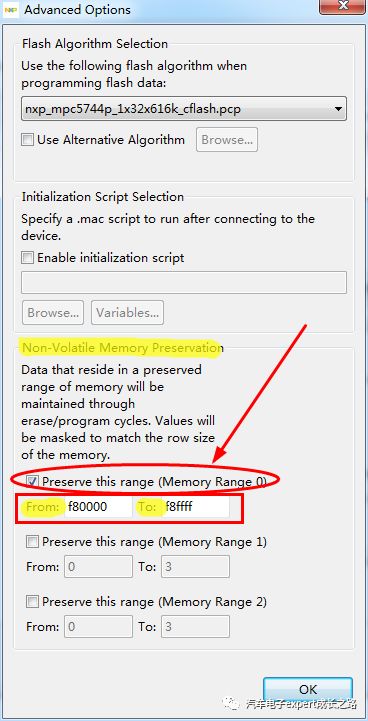
Tips: This method can protect up to 3 segments of NVM address space. To ensure proper functionality, the starting address must align with the minimum Flash erase unit address. For example, the P-Flash Sector size of S32K is 4KB, so the address must be a multiple of 4KB; while the Code-Flash Block size of Qorivva MPC57xx and S32R series MCUs can be 16KB/32KB/64KB/128KB/256KB, so the protected address range must also be a multiple of these sizes;
Additionally, to ensure the current application project downloads successfully, the protected memory address space must not overlap with the current application project compilation results or have across Flash sector/block situations;
6. How to load different Flash algorithm files for programming Data-Flash and external QSPI Flash?
The default S32DS IDE application project debugging uses its Code-Flash algorithm file:
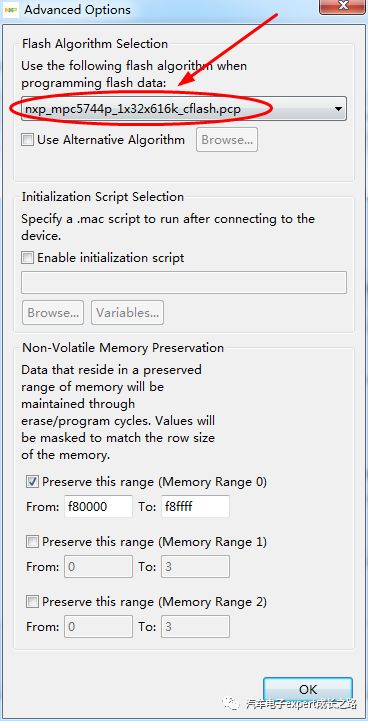
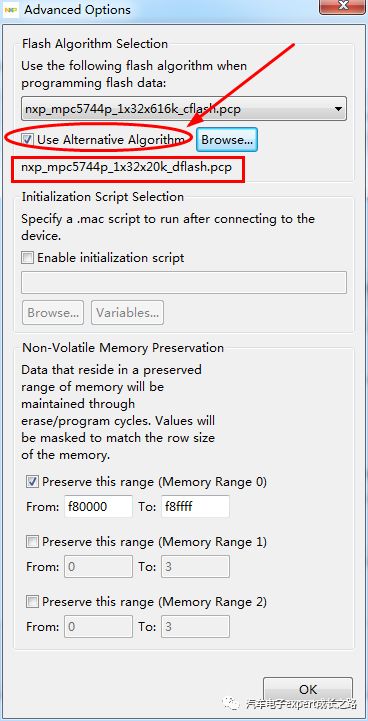
If you want to program its Data-Flash or external QSPI Flash (only supported by certain MCUs), you need to check Use Alternative Algorithm in the advanced options of the debugger, browse and load the corresponding algorithm file. For example, the following image shows the settings for loading and using the MPC5744P Data-Flash algorithm file to program its Data-Flash:
Tips: These Data-Flash or QSPI Flash algorithm files are stored in the installation directory of S32DS IDE. For example, the Flash algorithm .pcp file related to MPC5744P is as follows:
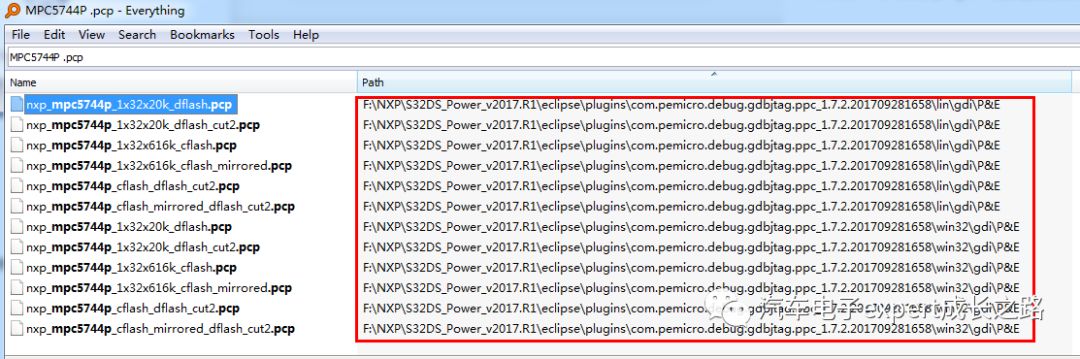
Tips: Different cut versions of chips may have differences in their Flash algorithm files. Please pay attention to the specific MCU chip’s errata and datasheet instructions.
7. How to attach for debugging and locating bugs?
Please refer to my previous article (click the article title to jump to read): “S32DS Usage Tips – How to configure and enable the Attach function to locate software program bugs and complete joint debugging of bootloader and application projects“;
8. How to export programming results from memory to S19/HEX/BIN files?
In some cases, when the MCU is not functioning properly, to rule out illegal instruction causes due to accidental modification of program code, you can choose to attach to the problematic target MCU and use the export memory function in the debug interface’s memory window to read out its Flash content, and then compare it with the original project compilation results:
The specific method is as follows:
Click the export memory function icon in the Memory window:
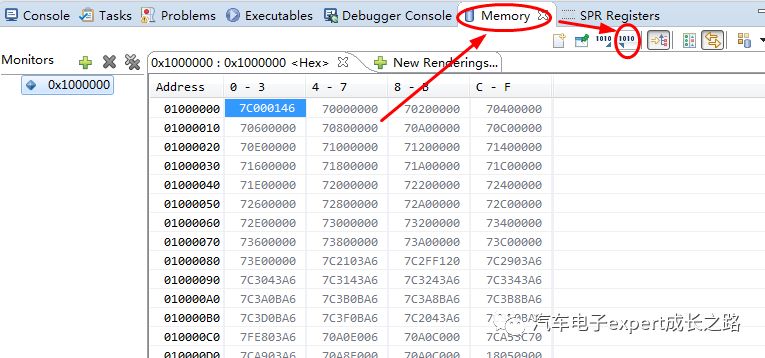
In the opened export memory window, select the file format to save (Format, supports S19 file/SRecord, BIN file/RAW binary, and text file/Plain text), starting address (Start address), ending address (End Address), and save path and file name (File name) to proceed:
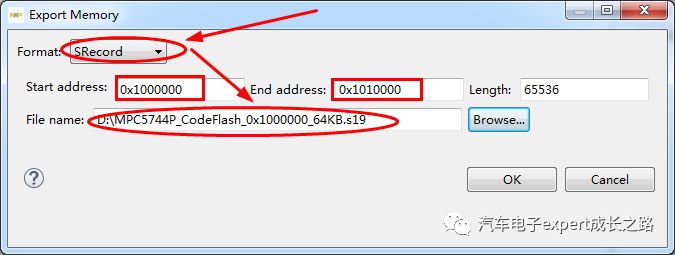
Click OK to export the content from Flash:
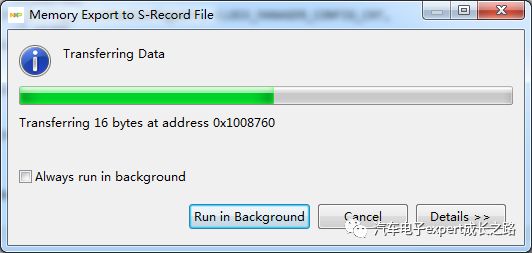
Tips: This method can export all legal address contents that can be viewed in the memory window, including Code/Data Flash, EEE, SRAM, and peripheral register values;
9. How to efficiently set and manage application debugging breakpoints?
In the Breakpoints window of the S32DS IDE debug interface, all breakpoints of the current debugging application project are listed. You can quickly enable (check), disable (uncheck), or remove all breakpoints in this window, and click on a specific breakpoint to quickly jump to the corresponding C source file location:
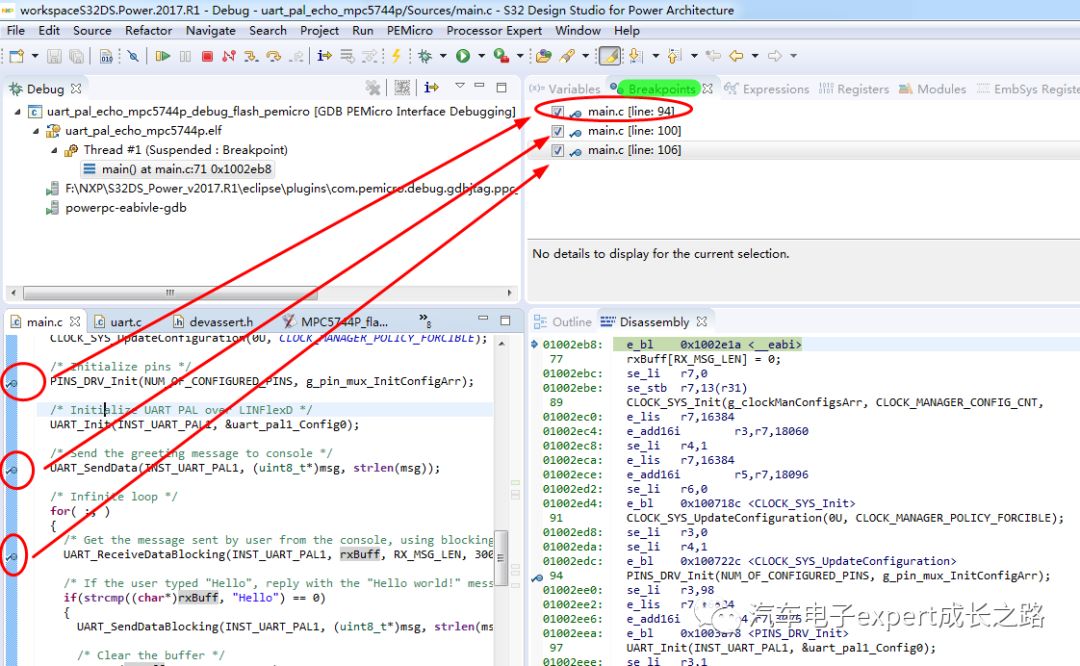
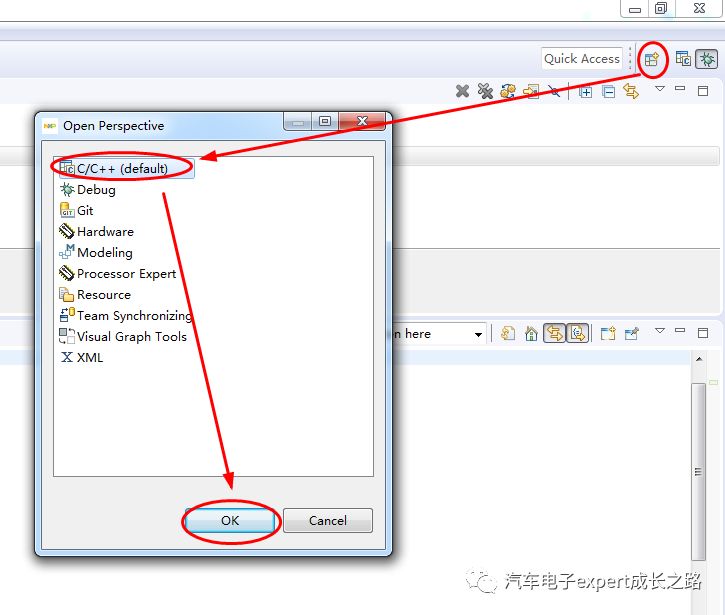
Since the debug interface does not have a Project Explorer window, it is inconvenient to switch and view files. Therefore, if you want to set a breakpoint in a specific C source file, you can click the shortcut icon shown below to open Open Perspective, allowing you to switch between the C/C++ view and the Debug view:
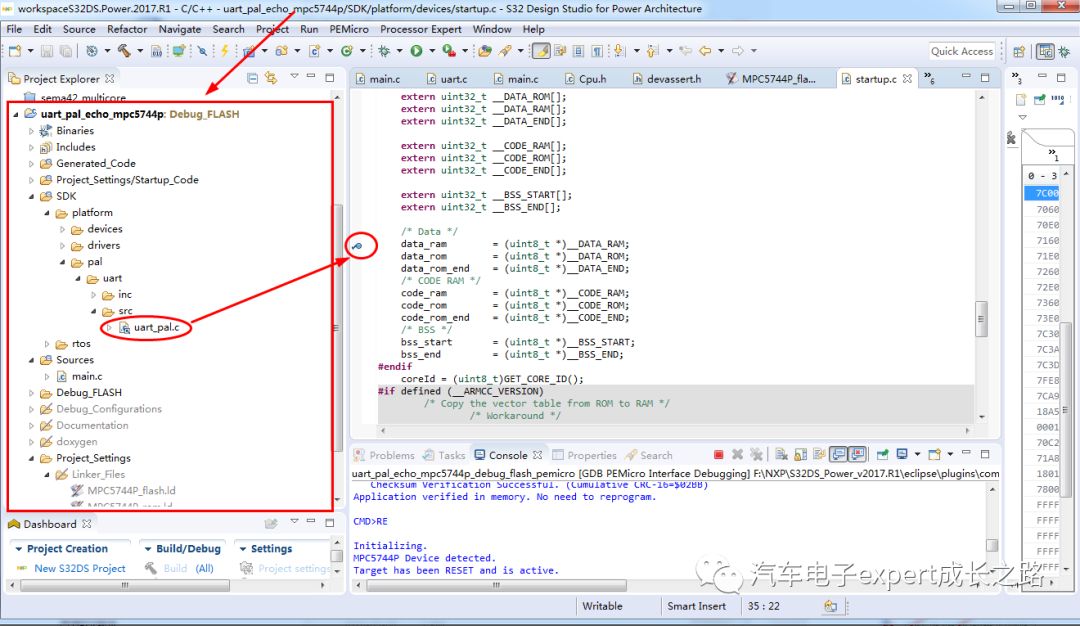
In the Project Explorer window of the C/C++ view, you can easily find the project source files. Click on the leftmost side of the line of code where you want to set a breakpoint to set it. Once the breakpoint is successfully set, a small checkmark will indicate it. Then switch back to the Debug debugging interface:
Tips: Sometimes you may encounter situations where breakpoints cannot be set at certain code locations. The reasons may include the following two points:
-
1. The number of breakpoints set in the project exceeds the maximum supported hardware breakpoint count (S32K14xx supports a maximum of 4, the KEA series supports a maximum of 2, and the MPC57xx series supports a maximum of 4 per core). It is recommended to clear unnecessary breakpoints in a timely manner;
-
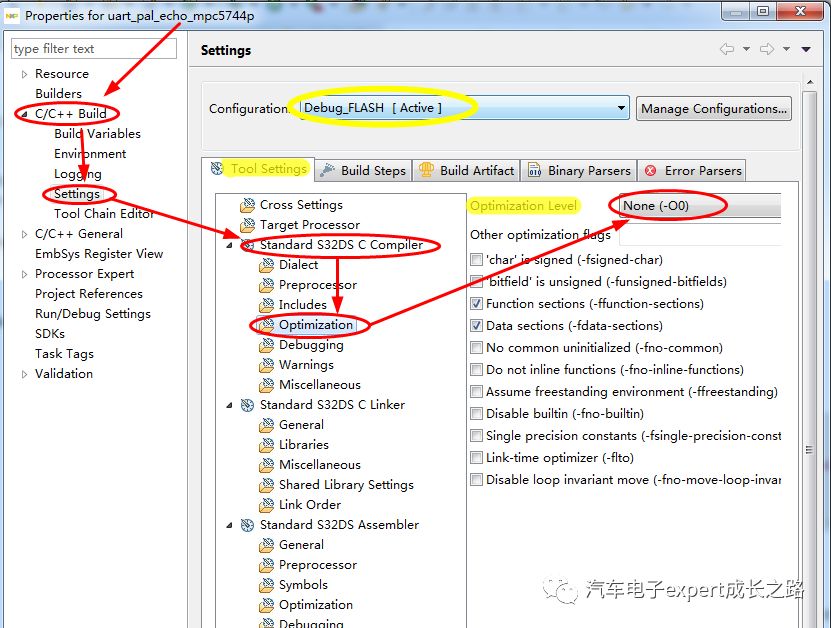
2. The line of code has been optimized away by the compiler. To ensure flexibility and reliability in setting breakpoints during debugging, it is recommended to configure the compiler optimization option for the project’s debug compilation target to the lowest optimization level (-0, no optimization):
10. How to view global variables?
In the S32DS IDE debug interface, there are two methods to view global variables:
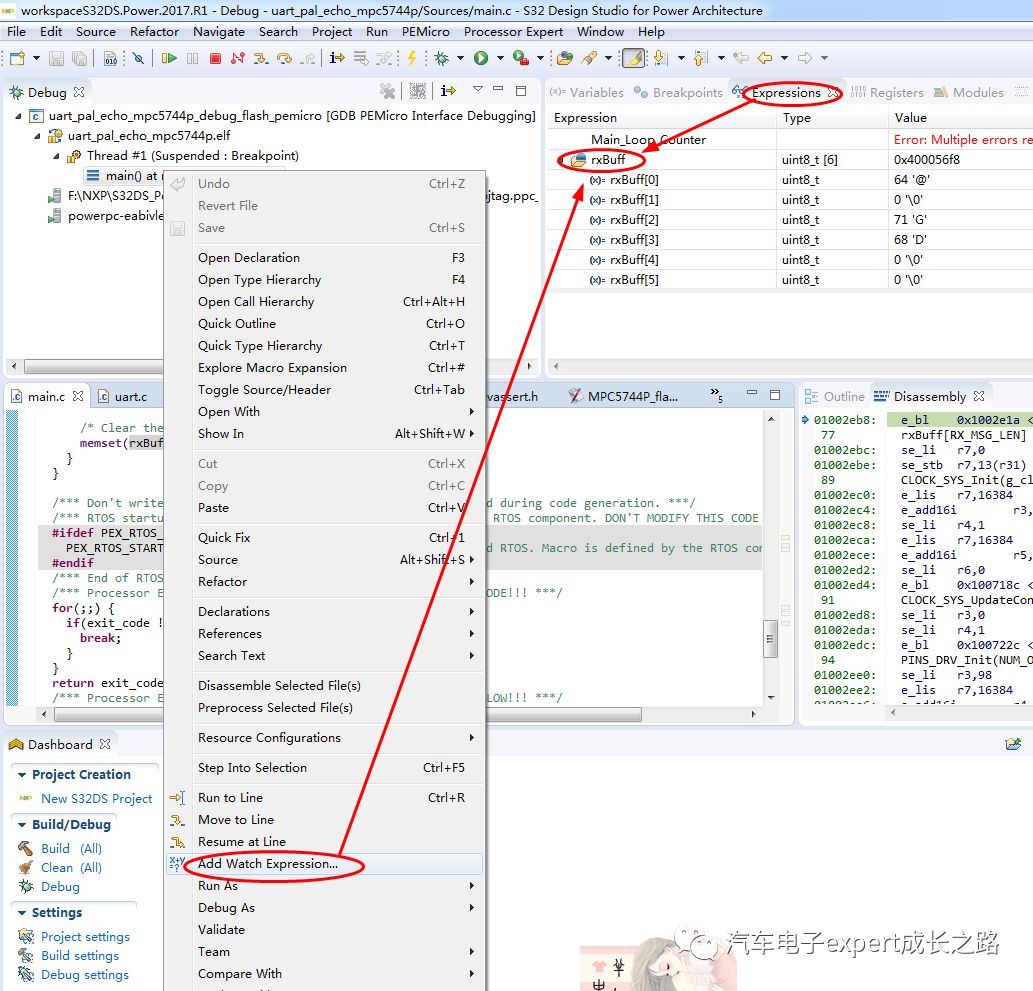
Method 1: In the C source code, select the global variable you want to view, right-click –> Add Watch Expression.. to open the global variable viewing window (Expressions) and add the corresponding global variable:
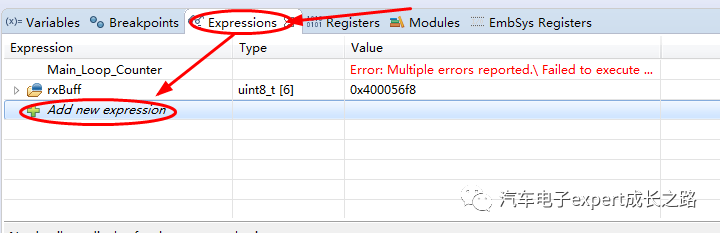
Method 2: Users can also add variables in the global variable viewing window (Expressions) by clicking Add new expression:
11. How to dynamically monitor variable changes during debugging?
Dynamically monitoring variables requires that during debugging, when clicking to let the CPU run at full speed, the dynamic changes of variables can be observed. Currently, only S32DS for ARM v2.0 and higher versions of the IDE support this through the Real Time Expressions plugin provided by PEMicro.
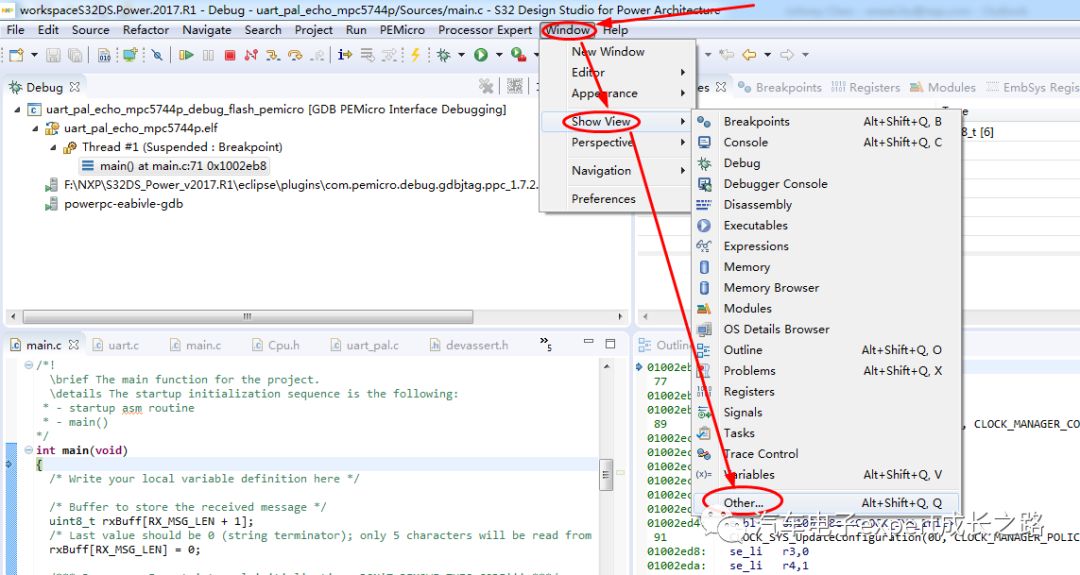
This can be opened by selecting the menu Windows –> Show View –> Others..:
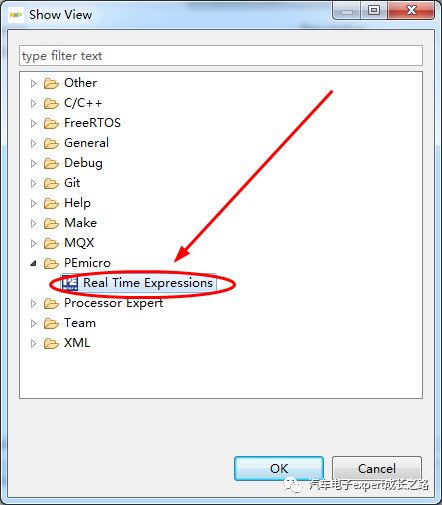
In the opened Show View window, select PEMicro –> Real Time Expressions to open:
In the Real Time Expressions window, you can add variables (both local and global) that you want to view in real-time by clicking Add new expression. Then click the real-time update switch icon in the upper right corner of the Real Time Expressions window to run the debug application at full speed, and you can view the variable changes in real-time:
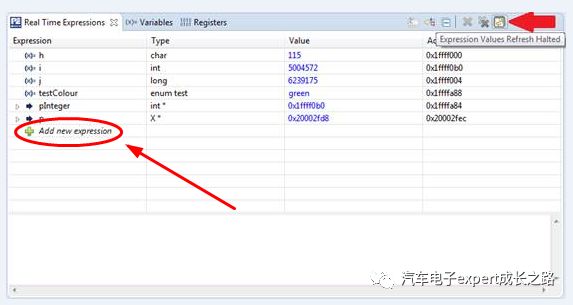
When the real-time update switch icon in the upper right corner of the Real Time Expressions window is not selected (pressed), the variable values will not update while the program runs at full speed, and will only update when a breakpoint is encountered and the program stops.
12. How to find the help documentation for S32DS IDE?
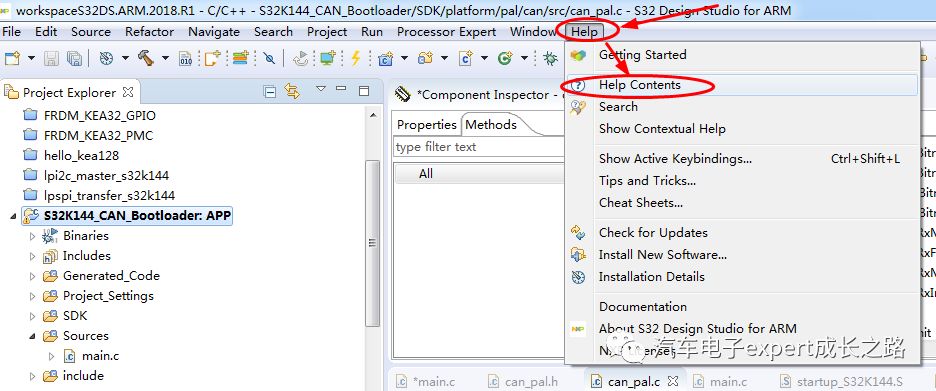
In fact, all NXP MCU software development IDEs (including the previous Freescale CodeWarrior IDE, S32DS for ARM/Power/Vision IDE) integrate rich help documentation for reference and learning. The method to start is as follows:
Click the menu Help –> Help Contents to launch the S32DS IDE help documentation browser:
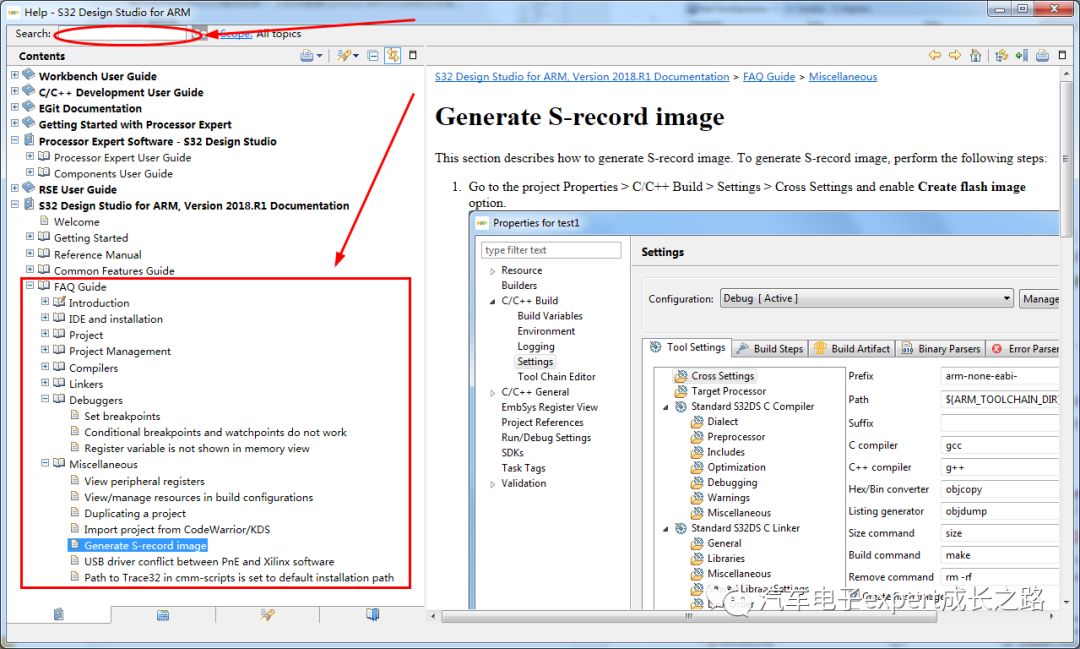
In the S32DS IDE help documentation browser, you can quickly search for relevant issues and technical help documentation by searching keywords or browsing different topic directories, which is very convenient and easy to use. I strongly recommend everyone to use it:
Conclusion
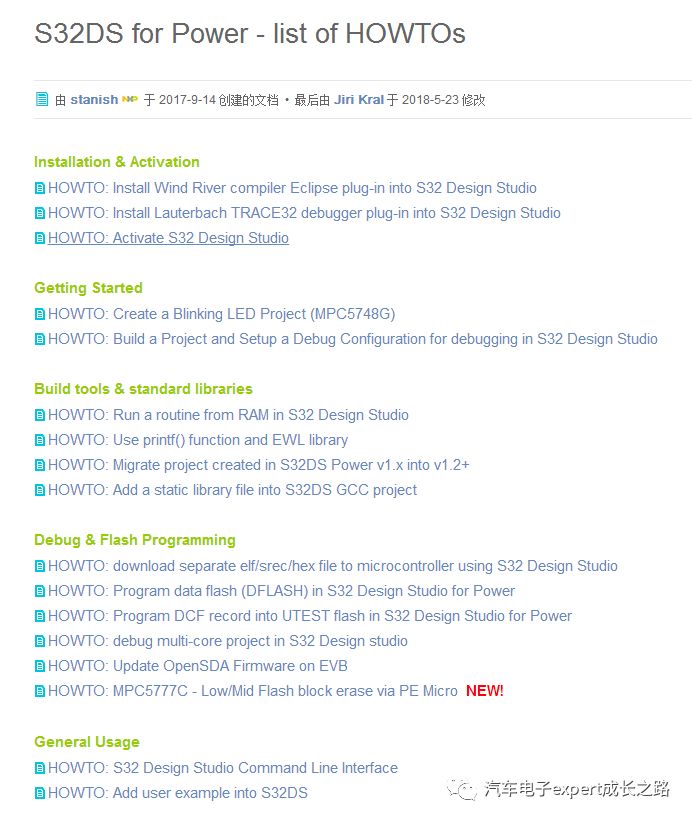
The above is a summary of some issues I encountered while using S32DS IDE and common questions frequently asked by users regarding debugging application projects in S32DS IDE. For more FAQs about S32DS IDE usage, I strongly recommend browsing the relevant posts in the official NXP community:
-
S32DS for Power community link:
https://community.nxp.com/docs/DOC-335301;
-
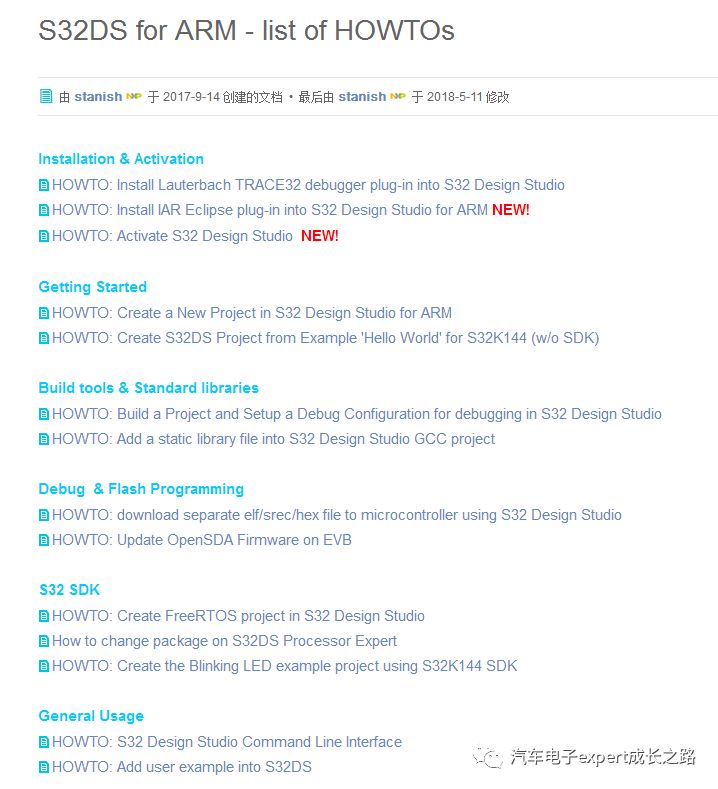
S32DS for ARM community link:
https://community.nxp.com/docs/DOC-335302;
-
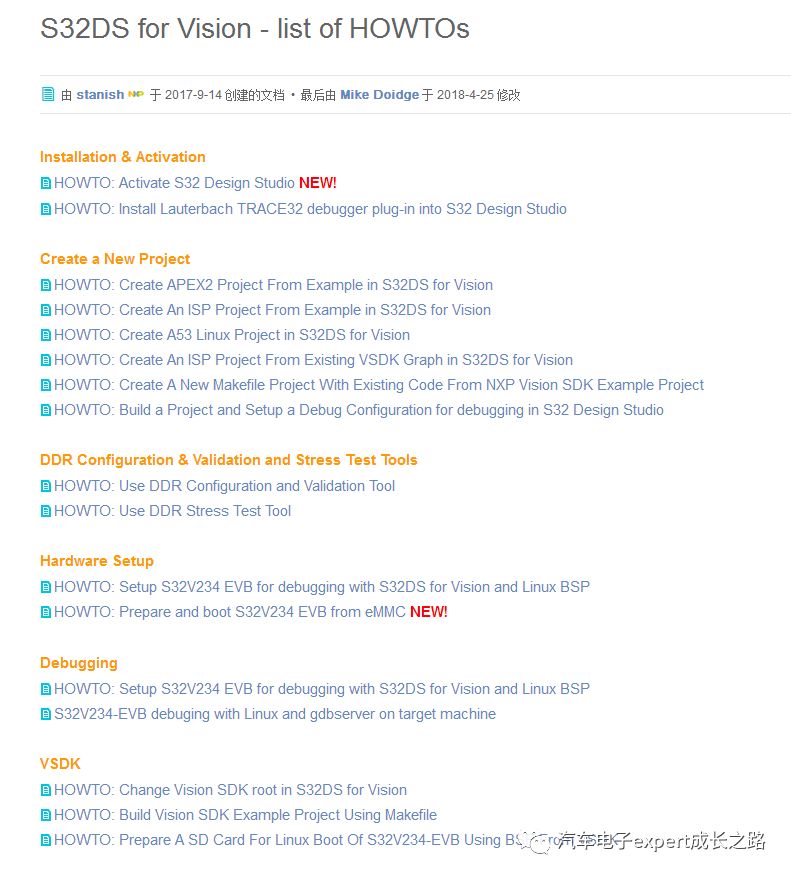
S32DS for Vision community link:
https://community.nxp.com/docs/DOC-335300;
Tips: In the NXP community’s S32DS section, there is a strong team of professional engineers to answer technical questions related to S32DS IDE usage. Perhaps the problem you encounter has already been encountered and solved by someone else. This community is open to users worldwide, and the questions and answers are updated 24 hours a day, so many questions and answers are in English. Please pay attention and stay informed!
Tips: By registering an account on the NXP official website and logging into the community, you can subscribe to email notifications for questions in a specific technical section after following it, making it easier to track related technical issues and community dynamics.
That concludes today’s sharing. I hope it is useful to everyone.
Links to previously published original high-quality embedded system technology articles on this public account are as follows. You are welcome to refer to and share them (you can directly click the article titles below to jump to read):
-
1. Automotive Electronics ECU Bootloader Development Series
Detailed Points on Automotive Electronics ECU Bootloader Development
Detailed Development of BootLoader for MPC574xP Series MCU Based on CAN Bus Communication
Independent NVM Driver Safe Bootloader Development for S12(X) Series MCU Based on CAN Bus Communication
Full Analysis of the Startup Process of Qorivva MPC56xx Series MCU (Based on CW IDE Application Project — EAB I, Link Files, Startup Files, and Map Files)
“Automotive Electronics ECU BootLoader Development” Series Related Articles Link and Resource Summary
-
2. Discussion on Embedded MCU Development Series
Discussion on Three Common Misunderstandings in Embedded MCU Development
Discussion on the Heap and Stack of Application Projects in Embedded MCU Software Development
Discussion on Interrupt Priority and Interrupt Nesting in Embedded MCU Software Development
Discussion on Code Style and Code Optimization in Embedded MCU Software Development
Discussion on the Startup Process in Embedded MCU Software Development (From Reset Vector to Preparation Work Before Main Function)
Discussion on the Startup Process in Embedded MCU Software Development (Implementing RAM Custom Initialization in CodeWarrior 5.1)
Detailed Explanation of Far and Near Function Pointer Calls in Embedded Software Development for S12(X) Series MCU (S12G128 CW 5.x Project)
Discussion on Three Writing Methods of Interrupt ISR in S12(X) Series MCU in CodeWarrior 5.1 IDE
Discussion on the Power e200 Core Register Functions and Core Debugging Techniques for Qorivva MPC56/57xx Series MCU
Discussion on the Minimum System Circuit of MCU in Embedded Hardware Design
-
3. Peripheral Usage Tips Series
S12(X) Series MCU On-Chip Memory Resources and Paging Access Mechanism Explained (Part 1)
S12(X) Series MCU On-Chip Memory Resources and Paging Access Mechanism Explained (Part 2)
S12(X) Series MCU Encryption (Secure) Principles and Decryption (Unsecure) Methods
Detailed Explanation of Flash Encryption and Decryption Principles and Engineering Implementation Methods for Qorivva MPC56xx Series MCU
Using Cyclone Offline Programmer for On-Chip NVM Programming of S12(X) and MagniV S12Z Series MCU
S32K1xx Series MCU Usage Tips — Function Introduction and Software Development and Hardware Design FAQ
S32K1xx Series MCU Usage Tips — Solving the Issue of Continuous Reset Unable to Connect to Debugger After Flash Encryption
Peripheral Usage Tips for Qorivva MPC56xx_57xx Series MCU Exception (IVORx) and IRQ Interrupt Handling Explained
Peripheral Usage Tips for Qorivva MPC56xx/57xx Series MCU Mode Control and Switching (On-Chip Peripheral Resource Enablement and Power Control)
Peripheral Usage Tips for S12G Series MCU Reset Process Before Startup Explained (COP Watchdog Reset and Clock Monitoring Reset Interrupt Identification and Handling)
Peripheral Usage Tips for MPC57xx Series MCU C55 Flash Module Explained and Its SSD (Standard Software Driver) Usage
Peripheral Usage Tips for MSCAN Receive ID Filter Settings
Peripheral Usage Tips for TIM Timer Usage FAQ and Experience
Peripheral Usage Tips for Configuring and Using SWT Watchdog Timer for Automotive Grade MCU MPC574xP Series
-
4. S32DS Usage Tips Series
S32DS Usage Tips — Detailed Explanation of Link Files and Startup Process for S32DS for Power V1.2
S32DS Usage Tips — Common Issues in SDK Usage (FAQ)
S32DS Usage Tips on Differences in GNU Toolchain Between Different Versions of S32DS for Power and Peripheral Register Bit Field Access Issues Summary
S32DS Usage Tips on Upgrading Application Projects from S32DS for Power v1.1 to v1.2 and Resolving Runaway Issues
S32DS Usage Tips — Migration and Upgrade Methods and Precautions from S32DS for ARM v1.3 to S32DS for ARM V2.0
S32DS Usage Tips — Project Property Configuration (Compilation Options and C Compiler, Assembler, and Linker Settings)
S32DS Usage Tips — How to Compile and Call Static Libraries
S32DS Usage Tips — How to Create New Build Targets in the Same S32DS Project to Compile Static Libraries and Applications Simultaneously
S32DS Usage Tips — How to Configure and Enable the Attach Function to Locate Software Program Bugs and Complete Joint Debugging of Bootloader and Application Projects
S32DS Usage Tips — Using Flash from file to download S19 or elf files
-
5. CodeWarrior IDE Usage Tips Series
CodeWarrior IDE Usage Tips for Bug Localization Techniques — Hotsync and Attach Debugging
CodeWarrior IDE Usage Tips for New Application Project Options, Debug Advanced Options, and Download Process Control Script Explanation for Qorivva MPC56xx
CodeWarrior IDE Usage Tips for prm Link File Explanation (Custom Memory Partitioning and Custom RAM Data Initialization and Running Functions in RAM)
CodeWarrior IDE Usage Tips — Full Analysis of Application Project Map Files for Qorivva MPC56xx (CW 2.10/10.x)
CodeWarrior IDE Usage Tips for Map File Explanation
CodeWarrior IDE Version Selection and License Function (feature) and Price, Authorization Form Differences, Activation Methods, and Installation Usage
CodeWarrior IDE Usage Tips — How to Compile and Call Static Libraries
CodeWarrior and S32DS IDE Usage Tips on How to Retain Defined but Unused Global Constants and Variables in Application Projects (for Parameter Calibration)
CodeWarrior IDE Usage Tips on How to Specify Storage Addresses for Assembly Code Functions, Global Variables, and Constants via prm Files
CodeWarrior IDE Usage Tips on Using the Burner Tool (Implementing Conversion Between Different Types of Memory Addresses and Outputting NVM Programming Format Files)
CodeWarrior IDE Usage Tips — Detailed Methods and Steps for Using the Burner to Convert elf Files to Generate HEX and BIN Files
CodeWarrior IDE Usage Tips for Reading On-Chip NVM Command Scripts for S12(X) Series MCU Using Hiwave (CW 5.x IDE)
6. Automotive ECU Parameter Calibration Series
Automotive ECU Parameter Calibration for Configuring e200 Series CPU Core MMU to Achieve Online Real-Time Calibration of Qorivva MPC56xx_57xx Series MCU Parameters
Original writing is not easy. If you find this article helpful for your work and study, you are welcome to support and encourage me — I will continue to write and bring you more exciting original articles.
Tips: Readers using Android phones can directly click the reward link at the end of the article to support; readers using iPhones can use WeChat to long-press the following QR code to support the author as Apple has disabled the WeChat reward function.
Thank you!

If you like the articles from this public account, please click the public account at the beginning of the article to follow or WeChat directly long-press to scan the QR code below to follow. You can also add friends in WeChat –>Public Account –> enter “Automotive Electronics Expert Growth Path” to search –> click to follow. If you have any opinions or suggestions on this article, please feel free to leave a message.
Your attention, likes, and shares are the greatest affirmation of my hard work!

Hu Enwei
May 24, 2018, in Chongqing