All input files used in this article can be downloaded here: http://sobereva.com/attach/443/file.rar. The .bat, .txt, and .vmd files used in this article can be found in the examples\drawESP directory of the latest version of Multiwfn, which will be introduced here.
The following three batch files for Windows must be placed in the directory where Multiwfn is located before plotting:ESPiso.bat: Used to generate cube files for electron density and electrostatic potential, namely density[sequence number].cub and ESP[sequence number].cubESPpt.bat: Used to generate pdb files for molecular structure and surface vertices, namely mol[sequence number].pdb and vtx[sequence number].pdbESPext.bat: Based on ESPpt.bat, it will additionally generate a pdb file for the extreme points of the molecular surface electrostatic potential (surfanalysis.pdb)
ESPiso.txt, ESPpt.txt, and ESPext.txt are utilized by the above three .bat files, with each line recording the commands to be input in Multiwfn at each step. Readers must place them in the directory where Multiwfn is located before plotting.
Before running the above batch files to call Multiwfn for calculations, readers should rename the fch file of the molecule to be calculated as 1.fch and place it in the current directory. By double-clicking the batch file, Multiwfn will automatically be called to calculate the 1.fch file in the current directory and obtain the files needed for plotting, and the result files will be automatically copied to the VMD directory. Before using the batch files, users must edit the .bat files to change the default VMD directory D:\study\VMD193 to the actual VMD directory on their machine. If the VMD path contains spaces, the path must be enclosed in double quotes, such as “D:\study\VMD 193”.
If there are also 2.fch, 3.fch, and 4.fch in the current directory, these batch files will also calculate them and produce the corresponding result files, which will be automatically copied to the VMD directory for drawing the Van der Waals surface penetration map.
The operation principle of the ESPiso.bat batch script is explained in detail in the article “Detailed Discussion on Command Line Operation and Batch Operation Methods of Multiwfn” (http://sobereva.com/612), which is highly recommended for interested readers.
The following three .vmd files are VMD plotting scripts, and readers must copy them to the VMD directory before using VMD for plotting.ESPiso.vmd and ESPiso2.vmd: ESPiso2.vmd is used to read density1.cub, ESP1.cub, density2.cub, ESP2.cub… in the VMD directory to plot the electrostatic potential contour map. Readers can edit this file to modify the default color scale limits and set how many file sequences to read, with the comments starting with # in the file being very clear. The difference between ESPiso.vmd and ESPiso2.vmd is that the former is only used for plotting a single molecule, and some plotting settings are different.ESPpt.vmd and ESPpt2.vmd: ESPpt2.vmd is used to read mol1.pdb, vtx1.pdb, mol2.pdb, vtx2.pdb… in the VMD directory to plot the electrostatic potential colored molecular surface vertex map. Readers can edit this file to modify the default color scale limits, point sizes, and how many file sequences to consider. The difference between ESPpt.vmd and ESPpt2.vmd is that the former is only used for plotting a single molecule, and some plotting settings are different.ESPext.vmd: Used to read surfanalysis.pdb in the VMD directory, plotting the extreme points of the molecular surface electrostatic potential as spheres, with the default colors being customizable.
Finally, to make the commands entered for plotting shorter, readers should open the vmd.rc file in the VMD directory (for the Windows version of VMD) with a text editor and add the following content at the end:proc iso {} {source ESPiso.vmd}proc iso2 {} {source ESPiso2.vmd}proc pt {} {source ESPpt.vmd}proc pt2 {} {source ESPpt2.vmd}proc ext {} {source ESPext.vmd}After this, in the VMD text window, simply entering pt will be equivalent to entering source ESPpt.vmd to execute this plotting script. Note that before running these commands, it is best if the user has not performed any other operations in VMD; otherwise, they should restart VMD, or they may not see the expected results.
To summarize, the tasks users need to perform before plotting include:(1) Copy the .txt and .bat files from the examples\drawESP directory to the directory where the Multiwfn executable is located(2) Change the VMD path in the .bat files to the actual path(3) Copy the .vmd files from the examples\drawESP directory to the VMD path(4) Add the above proc statements in vmd.rc
After configuring according to the above instructions, you can start working on the following examples. If you cannot successfully reproduce the figures in this article, it indicates that either you did not read the configuration instructions word for word, or you did not follow the operational steps below carefully. If VMD displays other systems that were previously plotted when plotting a certain system, you should delete the corresponding pdb or cube files of the other systems in the VMD directory. If the transparent contour surfaces displayed below look strange and unattractive, it may be due to incompatibility between the graphics card driver and VMD, preventing GLSL from being opened; try updating the driver or using another machine.
3 Example of Plotting the Electrostatic Potential Map of a Single Molecule
Taking acetamide as an example, we will plot two different styles of molecular surface electrostatic potential maps, which are parallel to each other; you can choose whichever display effect you prefer. Copy CH3CONH2.fch from the examples directory of Multiwfn to the directory where the Multiwfn executable is located and rename it to 1.fch.
First, we will present the molecular Van der Waals surface electrostatic potential distribution using the surface vertex coloring method. Double-click ESPpt.bat, and it will quickly finish the calculation. Then start VMD and enter pt in the text window to immediately see the following image:
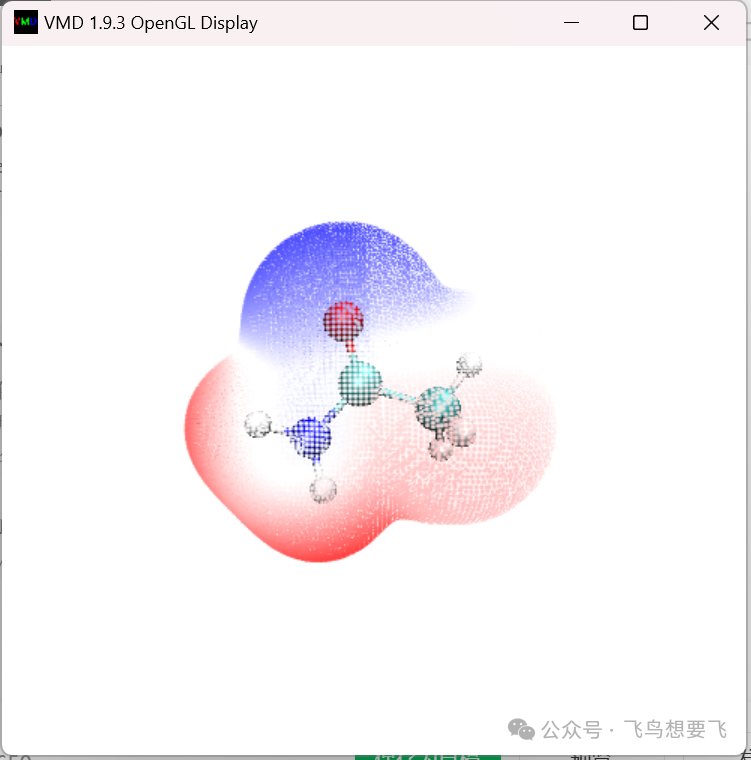
The default color scale in the ESPpt.vmd script is -50 kcal/mol to 50 kcal/mol, corresponding to a color transition of “blue-white-red”. If you want to directly modify display settings in the VMD interface, such as point size, color scale range, etc., refer to article 196.
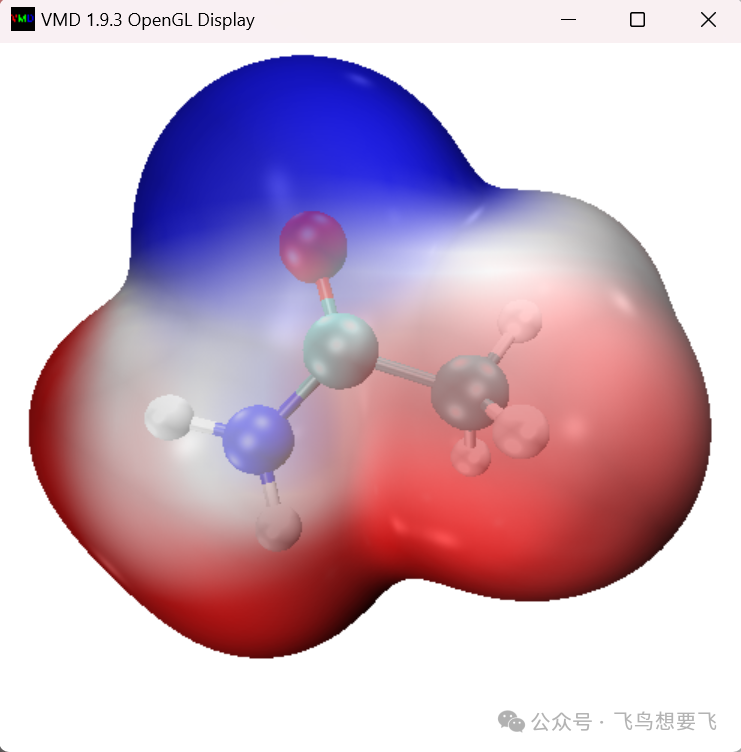
Next, we will present the molecular Van der Waals surface electrostatic potential distribution using the electron density contour coloring method. Double-click ESPiso.bat, and it will also finish quickly. Start VMD (if VMD was already open before, close it and restart), then directly enter iso in the VMD text window (do not run the pt command first!), and the image you see will be very close to the following image. For better display effects, the author used the built-in Tachyon renderer of VMD; the steps are explained in the article “Key Points and Common Issues When Performing RDG Analysis with Multiwfn and VMD” (http://sobereva.com/291), and the resulting image has a shinier appearance and anti-aliasing effect compared to what is directly seen in the graphics window.