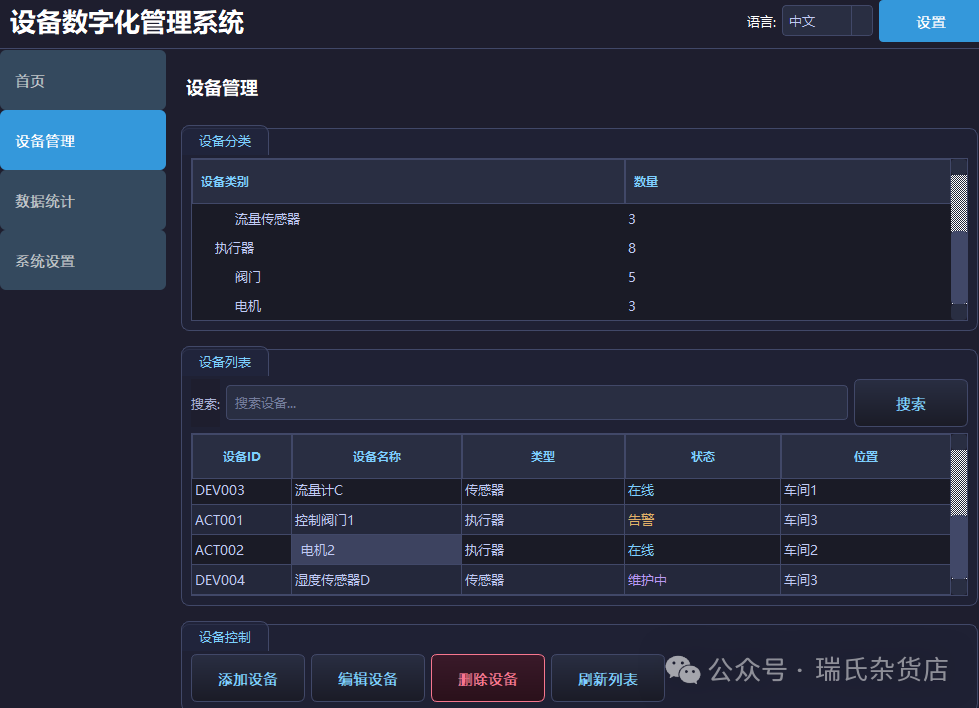
To implement the Device Digital Management System (Data Report Module) using Qt C++, the design must be broken down from the perspectives of interface architecture, technology selection, functional modules, code structure, and interaction logic. Combined with the previous general scaffolding for development, the following is a detailed implementation plan:
1. Core Modules
 2. Interface Architecture and Component Decomposition
The interface is divided into left navigation bar, top toolbar, and central content area (including data report page), with the components and technical implementations of each area as follows:
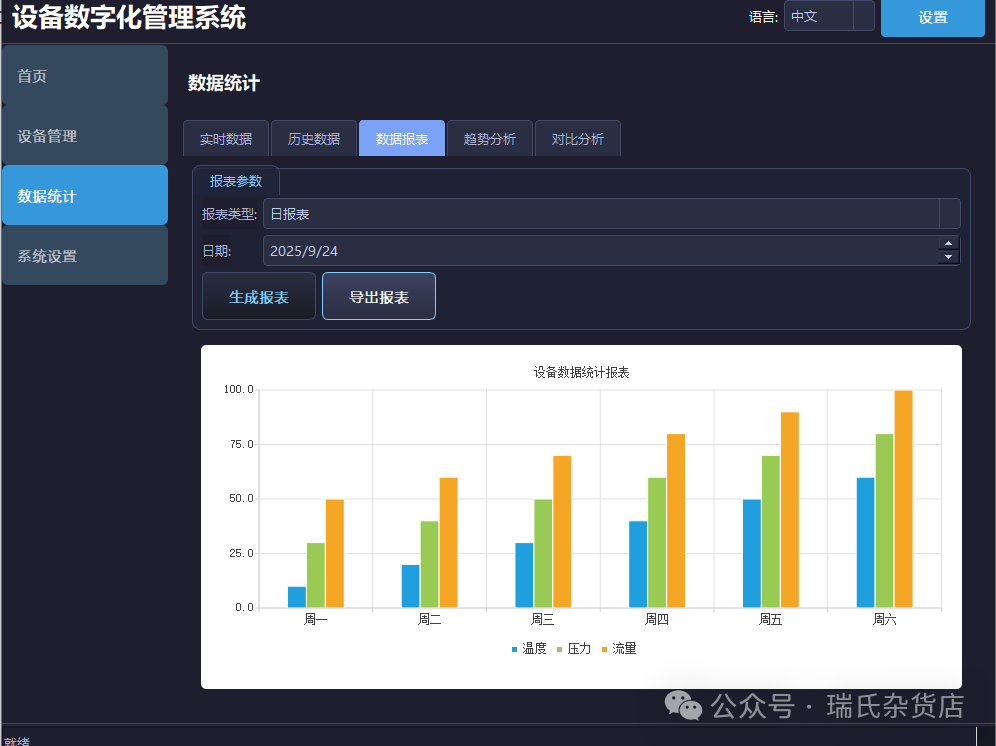
Central Content Area (Taking “Data Report Page” as an example)
-
Report Parameter Panel:
<span>QWidget</span>+<span>QFormLayout</span>(including report type dropdown<span>QComboBox</span>, date picker<span>QDateEdit</span>, generate button<span>QPushButton</span>, export button<span>QPushButton</span>). -
Chart Display Area:
<span>QChartView</span>embedded with<span>QChart</span>, displaying multi-series bar charts (X-axis: Monday to Saturday; Y-axis: values; series: temperature, pressure, flow).
3. Core Function Implementation Process
1. Interface Initialization (Main Window Construction)
// mainwindow.cpp
MainWindow::MainWindow(QWidget *parent) : QMainWindow(parent) {
// 1. Left Navigation Bar (QListWidget)
    QListWidget *navBar = new QListWidget(this);
    navBar->addItem("Home");
    navBar->addItem("Device Management");
    navBar->addItem("Data Statistics");
    navBar->addItem("System Settings");
connect(navBar, &QListWidget::itemClicked, this, &MainWindow::onNavItemClick); // Click to switch pages

// 2. Top Toolbar (QHBoxLayout)
    QWidget *topBar = new QWidget(this);
    QHBoxLayout *topLayout = new QHBoxLayout(topBar);
    QLabel *titleLbl = new QLabel("Device Digital Management System", topBar);
    QComboBox *langCombo = new QComboBox(topBar);
    langCombo->addItems({"中文", "English"});
    QPushButton *settingsBtn = new QPushButton("Settings", topBar);
    topLayout->addWidget(titleLbl, 1, Qt::AlignLeft);
    topLayout->addWidget(langCombo, 0, Qt::AlignCenter);
    topLayout->addWidget(settingsBtn, 0, Qt::AlignRight);
connect(langCombo, &QComboBox::currentTextChanged, this, &MainWindow::changeLanguage); // Language switch

// 3. Central Stacked Window (QStackedWidget)
    QStackedWidget *stackedWidget = new QStackedWidget(this);
    DataReportPage *dataReportPage = new DataReportPage(this); // Data report page
    stackedWidget->addWidget(dataReportPage);
// Other pages (e.g., real-time data page, historical data page)...

// 4. Main Layout Assembly
    QWidget *centralWidget = new QWidget(this);
    QHBoxLayout *mainLayout = new QHBoxLayout(centralWidget);
    mainLayout->setContentsMargins(0, 0, 0, 0);
    mainLayout->addWidget(navBar, 1);          // Navigation bar occupies 1
    QVBoxLayout *rightLayout = new QVBoxLayout();
    rightLayout->addWidget(topBar);
    rightLayout->addWidget(stackedWidget, 4);  // Central area occupies 4
    mainLayout->addLayout(rightLayout, 4);
setCentralWidget(centralWidget);
}
2. Data Report Page (<span>DataReportPage</span> Class)
Responsible for report parameter interaction, chart rendering, data export, with the core logic as follows:
(1) Interface Layout
// datareportpage.cpp
DataReportPage::DataReportPage(QWidget *parent) : QWidget(parent) {
// Report parameter layout (QFormLayout)
    reportTypeCombo = new QComboBox(this);   // Report type (daily/monthly report)
    reportTypeCombo->addItems({"Daily Report", "Monthly Report"});
    dateEdit = new QDateEdit(QDate::currentDate(), this); // Date selection
    generateBtn = new QPushButton("Generate Report", this);     // Generate button
    exportBtn = new QPushButton("Export Report", this);       // Export button

connect(generateBtn, &QPushButton::clicked, this, &DataReportPage::onGenerateReport);
connect(exportBtn, &QPushButton::clicked, this, &DataReportPage::onExportReport);

    QFormLayout *paramLayout = new QFormLayout();
    paramLayout->addRow("Report Type:", reportTypeCombo);
    paramLayout->addRow("Date:", dateEdit);
    QHBoxLayout *btnLayout = new QHBoxLayout();
    btnLayout->addStretch();
    btnLayout->addWidget(generateBtn);
    btnLayout->addWidget(exportBtn);
    paramLayout->addRow(btnLayout);

// Chart area (QChartView)
    chartView = new QChartView(this);
    dataModel = new DataModel(this);         // Data model (simulation/database)
    chartManager = new ChartManager(chartView->chart()); // Chart manager

// Page layout assembly
    QVBoxLayout *pageLayout = new QVBoxLayout(this);
    pageLayout->addLayout(paramLayout);
    pageLayout->addWidget(chartView, 1); // Chart occupies remaining space

onGenerateReport(); // Load default data initially
}
(2) Generate Report (Data Retrieval + Chart Update)
void DataReportPage::onGenerateReport() {
    QString reportType = reportTypeCombo->currentText();
    QDate date = dateEdit->date();

// Retrieve temperature, pressure, and flow data from data model (simulation/database)
    QList<qreal> tempData = dataModel->getTemperatureData(date, reportType);
    QList<qreal> pressData = dataModel->getPressureData(date, reportType);
    QList<qreal> flowData = dataModel->getFlowData(date, reportType);

// Chart update: X-axis (Monday to Saturday), series (temperature/pressure/flow)
    QStringList categories {"Monday", "Tuesday", "Wednesday", "Thursday", "Friday", "Saturday"};
    QStringList seriesNames {"Temperature", "Pressure", "Flow"};
    chartManager->updateBarChart(categories, {tempData, pressData, flowData}, seriesNames);
}
(3) Export Report (Chart/Data Persistence)
void DataReportPage::onExportReport() {
    QString filePath = QFileDialog::getSaveFileName(
this, "Export Report", "", "PNG Image (*.png);;CSV File (*.csv)"
    );
if (filePath.isEmpty()) return;

if (filePath.endsWith(".png")) {
// Export chart as PNG image
        chartView->chart()->saveToImage(filePath);
    } elseif (filePath.endsWith(".csv")) {
// Export data as CSV (example: only temperature data, need to extend for pressure/flow)
        QFile file(filePath);
if (file.open(QIODevice::WriteOnly)) {
QTextStream out(&file);
            out << "Date,Temperature\n";
// Assume writing data by date (need to combine with business logic)
            out << QDate::currentDate().toString("yyyy-MM-dd") << ","
                << dataModel->getTemperatureData(QDate::currentDate(), "Daily Report").join(",") << "\n";
            file.close();
        }
    }
}
3. Data Model (<span>DataModel</span> Class)
Encapsulates data retrieval logic, supporting simulated data or later expansion to SQLite/MySQL database queries.
// datamodel.cpp
QList<qreal> DataModel::getTemperatureData(const QDate &date, const QString &reportType) {
// Simulated data: Temperature from Monday to Saturday (actual needs to be replaced with database queries)
return {10.5, 12.3, 15.2, 14.8, 16.5, 18.0};
}
QList<qreal> DataModel::getPressureData(const QDate &date, const QString &reportType) {
return {20.1, 22.5, 25.0, 23.8, 26.2, 28.5};
}
QList<qreal> DataModel::getFlowData(const QDate &date, const QString &reportType) {
return {30.2, 32.5, 35.8, 33.6, 37.0, 39.5};
}
4. Chart Management (<span>ChartManager</span> Class)
Encapsulates <span>QChart</span> configuration (axes, legends, series updates), implementing dynamic rendering of multi-series bar charts.
// chartmanager.cpp
ChartManager::ChartManager(QChart *chart) : m_chart(chart) {
m_chart->setTitle("Device Data Statistics Report");
m_chart->legend()->setAlignment(Qt::AlignBottom); // Legend at the bottom
m_chart->createDefaultAxes(); // Automatically generate axes
m_chart->axisY()->setRange(0, 100); // Y-axis range 0-100
}
void ChartManager::updateBarChart(const QStringList &categories,
const QList<QList<qreal>> &seriesData,
const QStringList &seriesNames) {
m_chart->removeAllSeries(); // Clear old series
QBarSeries *barSeries = new QBarSeries(m_chart);
for (int i = 0; i < seriesData.size(); ++i) {
QBarSet *set = new QBarSet(seriesNames[i]);
*set << seriesData[i]; // Fill data
barSeries->append(set);
}
m_chart->addSeries(barSeries); // Add new series
m_chart->setAxisX(new QBarCategoryAxis(), barSeries); // X-axis as categories (Monday to Saturday)
m_chart->axisX()->setCategories(categories);
m_chart->axisY()->setLabelFormat("%.1f"); // Y-axis value format (1 decimal place)
}
4. Style Beautification (QSS Example)
Implement dark theme, component interaction styles (e.g., navigation bar selected highlight):
/* Main window background */
QMainWindow {
background-color: #1E1E1E;
}

/* Navigation bar */
QListWidget {
background-color: #2D2D2D;
color: #FFFFFF;
border: none;
}
QListWidget::item {
padding: 10px;
border-bottom: 1px solid #3A3A3A;
}
QListWidget::item:selected {
background-color: #3A3A3A;
color: #00A0E9; /* Selected item highlight color */
}

/* Top toolbar */
QWidget#topBar {
background-color: #1E1E1E;
color: #FFFFFF;
}
/* Button styles */
QPushButton {
background-color: #3A3A3A;
color: #FFFFFF;
border: 1px solid #4A4A4A;
padding: 5px 10px;
border-radius: 4px;
}
QPushButton:hover {
background-color: #4A4A4A; /* Hover highlight */
}

/* Chart area */
QChartView {
background-color: #FFFFFF;
border: 1px solid #CCCCCC;
}
5. Scalability and Optimization Directions
-
Data Source Expansion: Change
<span>DataModel</span>to connect to SQLite/MySQL databases, implementing real data queries through the<span>Qt SQL</span>module. -
Chart Type Expansion: Add methods for line charts, pie charts, etc., in
<span>ChartManager</span>to support chart needs for “trend analysis” and “comparison analysis” pages. -
Multi-language Support: Use
<span>QTranslator</span>to load<span>.qm</span>translation files, allowing interface text to switch via the language dropdown. -
Performance Optimization: Enable progressive rendering of charts when dealing with large data volumes (
<span>QChart::setAnimationOptions(QChart::NoAnimation)</span>).
This plan implements the core functionality of the data report for the device digital management system based on Qt Widgets + Charts, balancing interface aesthetics and code maintainability, while reserving interfaces for future expansions (such as databases, multi-language support, and more chart types).