Hello everyone, I am Hua Jie. Today I want to share a practical quantitative strategy for short-term trading in A-shares, which does not use conventional MACD or RSI, but instead employs Fuzzy Control.
Many beginners feel overwhelmed by quantitative strategies, but the core logic is quite simple: multiple indicators scoring, fuzzy judgment, and then making buy/sell decisions. I assure you that by the end of this article, even those with no background can run it in Python.
1. Why Use Fuzzy Control?
The biggest headache in short-term trading is unreliable signals. MACD golden crosses and dead crosses, RSI overbought and oversold, all turn into false signals in a volatile market.
The advantages of fuzzy control are:
- No longer limited to just “buy/sell” extreme signals
- Multiple indicators can be combined into a comprehensive score
- Signals have weights, making short-term trading more flexible
In other words, it helps you solve the awkwardness of quantitative indicators being “black or white” 😂.
2. Strategy Design Ideas
I will design a three inputs and one output short-term fuzzy control system:
Input Indicators:
- Technical Momentum: Here I chose RSI, but you can use others as well
- Trend Strength: Deviation rate between short-term and long-term moving averages
- Volume Amplification Factor: Current volume / Average volume over the past 5 days
Output Indicator:
-
Trading Signal Strength: Range -1 to 1
- -1 → Strong Sell
- 0 → Hold
- 1 → Strong Buy
3. Fuzzy Set Division
We set fuzzy sets for each indicator, which is quite intuitive:
RSI (0-100) Generally, we divide RSI into oversold and overbought zones at 30 and 70, these two thresholds indicate that market sentiment has reached extremes, significantly increasing the probability of a price trend reversal. Of course, you can also try changing it to 20 and 80.
- Low (0-30)
- Medium (30-70)
- High (70-100)
Volume Multiplication Factor (0-3 times)
The volume multiplication factor can be derived from historical volume statistics (for example: taking the historical maximum and minimum values to divide), or it can be hardcoded, like the division method below.
- Low Volume (0-0.8)
- Normal (0.8-1.5)
- High Volume (1.5-3)
Trend Strength (Deviation Rate -5% ~ +5%) The division of trend strength can be hardcoded or dynamically calculated, depending on your understanding of the strategy.
- Downtrend (<-2%)
- Neutral (-2%~2%)
- Uptrend (>2%)
Trading Signal Output
- Sell (-1)
- Hold (0)
- Buy (1)
4. Fuzzy Rule Base
The core logic of the rules is “if… then…”, here are a few examples:
- RSI low + Volume high + Trend up → Strong Buy
- RSI medium + Volume normal + Trend up → Moderate Buy
- RSI high + Volume low + Trend down → Strong Sell
- RSI low + Volume low + Trend down → Hold
Through these rules, we can obtain a fuzzy score, and then use thresholds to determine buying and selling:
- > 0.5 → Buy
- <-0.5 → Sell
- -0.5 to 0.5 → Hold
5. Python Implementation Example
To implement the fuzzy calculations mentioned above, we must get to know the scikit-fuzzy library.
1. What is scikit-fuzzy?
scikit-fuzzy (abbreviated as skfuzzy) is a fuzzy logic toolkit based on Python, built on top of NumPy and SciPy. Its goal is to provide a complete set of algorithms and tools related to fuzzy logic, allowing researchers and engineers to implement fuzzy reasoning and fuzzy control more conveniently in their projects.
In summary: 👉 A toolkit for fuzzy logic reasoning and fuzzy control.
2. What can it do?
Main features include:
-
Membership Functions provide commonly used fuzzy membership functions, such as triangular, trapezoidal, Gaussian functions, etc., used to define fuzzy sets. In the upcoming examples, we will use the triangular function to define fuzzy sets.
-
Fuzzy Operations support union, intersection, and complement operations of fuzzy sets.
-
Fuzzy Inference System (FIS) can construct a rule-based fuzzy inference system to simulate human fuzzy decision-making.
-
Clustering Algorithms includes the fuzzy C-means (FCM) clustering algorithm, widely used in pattern recognition, image processing, etc.
3. Application Scenarios
-
Control Systems: For example, automatic temperature adjustment in air conditioning, fuzzy control in autonomous driving.
-
Data Mining and Clustering: Such as fuzzy C-means clustering applied in customer segmentation, image segmentation.
-
Decision Support: Fuzzy decision modeling in complex situations, such as risk assessment.
-
Quantitative Trading and Investment Strategies:
- Fuzzy Indicator Construction: Traditional technical indicators may be “buy/sell”, fuzzy logic can convert indicators into fuzzy signals like “strong buy/buy/neutral/sell/strong sell”, making strategies smoother and more aligned with market non-linear characteristics.
- Fuzzy Combination Optimization: Investment portfolio weights can be allocated using fuzzy membership degrees instead of simple equal or fixed ratios, making the portfolio more flexible and tolerant of market fluctuations.
- Risk Management: Using fuzzy logic to assess volatility, maximum drawdown, and other indicators, incorporating uncertainty and fuzziness into the decision-making process to reduce risks in extreme market conditions.
- Quantitative Signal Fusion: When fusing multiple strategies and indicators, fuzzy logic can handle the “fuzzy conflicts” of different signals, resulting in a more reasonable comprehensive operational signal.
4. A Simple Example
First, install <span>scikit-fuzzy</span> (a must-do step for beginners):
pip install scikit-fuzzy
If you encounter an error saying No module named networkx, execute the following command
pip install networkx
“
Tip: If you are using Jupyter Notebook, you can write in the code block:
!pip install scikit-fuzzy networkx
After installation, you can directly run the example code below:
import numpy as np
import pandas as pd
import skfuzzy as fuzz
from skfuzzy import control as ctrl
from xtquant import xtdata
import talib
import mplfinance as mpf
import matplotlib.pyplot as plt

def fuzzy_short_signal(df, short_ma=5, long_ma=20, rsi_period=14):
    """
    Fuzzy control-based short-term trading signal (dynamically adjusting volume, trend range)
    df: pandas.DataFrame, containing ['open','high','low','close','volume','amount']
    short_ma: short-term moving average
    long_ma: long-term moving average
    rsi_period: RSI calculation period
    Returns: df, adds 'signal' column (-1 sell, 0 hold, 1 buy)
    """
    df = df.copy()

    # Calculate RSI
    df['rsi'] = talib.RSI(df['close'].values, timeperiod=rsi_period)

    # Calculate short-term/long-term moving average deviation rate
    df['ma_short'] = df['close'].rolling(short_ma).mean()
    df['ma_long'] = df['close'].rolling(long_ma).mean()
    df['trend'] = (df['ma_short'] - df['ma_long']) / df['ma_long'] * 100

    # Volume multiplication factor
    df['vol_mean5'] = df['volume'].rolling(5).mean()
    df['vol_ratio'] = df['volume'] / df['vol_mean5']

    # Remove empty data
    df = df.dropna()

    # Dynamic value range
    vol_min, vol_max = df['vol_ratio'].min(), df['vol_ratio'].max()
    trend_min, trend_max = df['trend'].min(), df['trend'].max()

    # Set up fuzzy system
    rsi = ctrl.Antecedent(np.arange(0, 101, 1), 'rsi')
    volume = ctrl.Antecedent(np.linspace(vol_min, vol_max, 100), 'volume')
    trend = ctrl.Antecedent(np.linspace(trend_min, trend_max, 100), 'trend')
    signal = ctrl.Consequent(np.arange(-1, 1.1, 0.1), 'signal')

    # Fuzzy sets
    rsi['low'] = fuzz.trimf(rsi.universe, [0, 0, 30])
    rsi['mid'] = fuzz.trimf(rsi.universe, [20, 50, 80])
    rsi['high'] = fuzz.trimf(rsi.universe, [70, 100, 100])

    volume['low'] = fuzz.trimf(volume.universe, [vol_min, vol_min, (vol_min+vol_max)/3])
    volume['mid'] = fuzz.trimf(volume.universe, [vol_min, (vol_min+vol_max)/2, vol_max])
    volume['high'] = fuzz.trimf(volume.universe, [(vol_min+vol_max)/2, vol_max, vol_max])

    trend['down'] = fuzz.trimf(trend.universe, [trend_min, trend_min, (trend_min+trend_max)/3])
    trend['flat'] = fuzz.trimf(trend.universe, [trend_min, 0, trend_max])
    trend['up'] = fuzz.trimf(trend.universe, [(trend_min+trend_max)/2, trend_max, trend_max])

    signal['sell'] = fuzz.trimf(signal.universe, [-1, -1, 0])
    signal['hold'] = fuzz.trimf(signal.universe, [-0.2, 0, 0.2])
    signal['buy'] = fuzz.trimf(signal.universe, [0, 1, 1])

    # Rules
    rules = [
        ctrl.Rule(rsi['low'] & volume['high'] & trend['up'], signal['buy']),
        ctrl.Rule(rsi['mid'] & volume['mid'] & trend['up'], signal['buy']),
        ctrl.Rule(rsi['high'] & volume['low'] & trend['down'], signal['sell']),
        ctrl.Rule(rsi['low'] & volume['low'] & trend['down'], signal['hold']),
        ctrl.Rule(rsi['high'] & volume['high'] & trend['up'], signal['buy']),
    ]

    system = ctrl.ControlSystem(rules)
    sim = ctrl.ControlSystemSimulation(system)

    # Calculate daily signals
    signals = []
    for idx, row in df.iterrows():
        if np.isnan(row['rsi']) or np.isnan(row['trend']) or np.isnan(row['vol_ratio']):
            signals.append(0)  # Insufficient data, hold
            continue
        sim.input['rsi'] = row['rsi']
        sim.input['volume'] = np.clip(row['vol_ratio'], vol_min, vol_max)
        sim.input['trend'] = np.clip(row['trend'], trend_min, trend_max)
        sim.compute()
        try:
            sim.compute()
        except Exception as e:
            print(f"[Fuzzy DEBUG] sim.compute() failed, index {idx}, error:", e)
            signals.append(9)
            continue  # Or continue/skip this row, depending on your business needs


        val = sim.output.get('signal')
        if val is None:
            signals.append(9)
            print("[Fuzzy WARNING] Current row did not generate 'signal' output, possibly due to rule not triggering or Consequent name being incorrect")
            continue

        val = sim.output['signal']
        # Threshold determination
        if val > 0.5:
            signals.append(1)
        elif val < -0.5:
            signals.append(-1)
        else:
            signals.append(0)
    df['signal'] = signals
    return df

def plot_bs(df):
    # Define trend color points (mark above the K line)
    add_plot = []
    trend_markers = {
        "buy": (1, "red", "^"),
        "sell": (-1, "green", "v"),
        "hold": (0, "grey", "o"),
    }

    for trend_label, (signal_val,color, marker) in trend_markers.items():
        if signal_val in df['signal'].values:  # Check if the signal exists
            y = np.where(df['signal'] == signal_val, df['low']*0.99, np.nan)
            add_plot.append(
                mpf.make_addplot(
                    y,
                    scatter=True,
                    markersize=20,
                    marker=marker,
                    color=color,
                    label=trend_label
                )
            )


    # Add score curve
    add_plot.append(mpf.make_addplot(df['rsi'], panel=1, color='orange',label="rsi"))
    add_plot.append(mpf.make_addplot(df['vol_ratio'], panel=1, color='purple', label="Volume Ratio"))
    # ========== Solve Chinese garbled text ==========
    plt.rcParams['font.sans-serif'] = ['SimHei']   # Black body, supports Chinese
    plt.rcParams['axes.unicode_minus'] = False     # Solve negative sign display issue
    mc = mpf.make_marketcolors(
        up='red',       # Rising K line red
        down='green',   # Falling K line green
        edge='inherit',
        wick='inherit',
        volume='inherit',
    )

    s = mpf.make_mpf_style(
        base_mpf_style='yahoo',
        marketcolors=mc,
        rc={'font.family': 'SimHei'}  # Ensure mplfinance can also use Chinese
    )
    # Draw K line
    mpf.plot(
        df,
        type='candle',
        mav=(5,20,),
        volume=True,
        style=s,
        addplot=add_plot,
        figscale=1.2,
        figratio=(16,9),
        title=f"Trend Scoring Chart"
    )

df = get_hq(code='000819.SZ',period='1d',start_time='20220101',end_time='')
df_signal = fuzzy_short_signal(df)
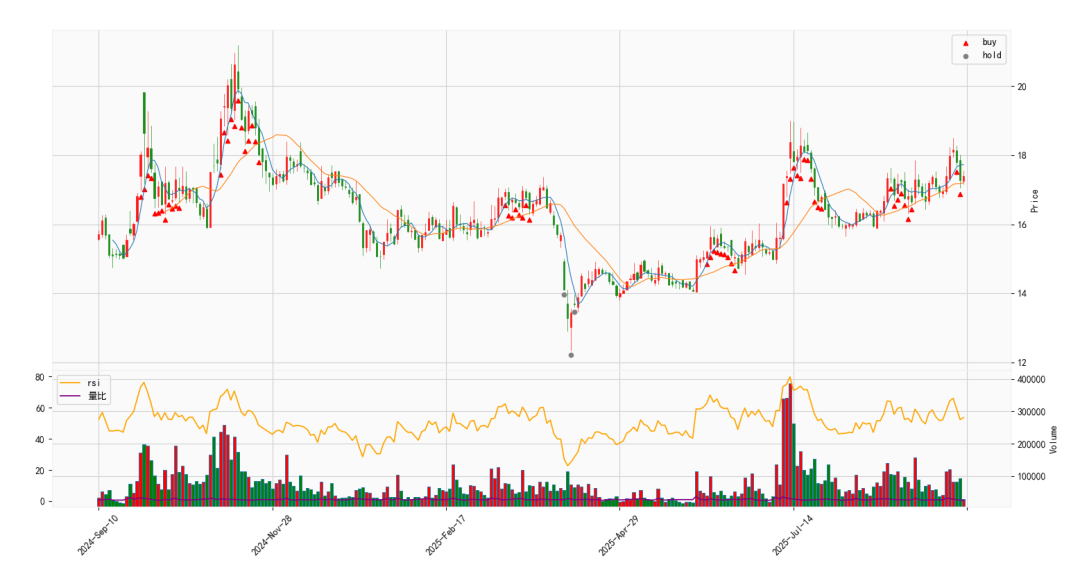
The above code is just an example, mainly to help everyone understand this new quantitative model, and is not suitable for direct use in actual trading. 💡 Next, I will overlay the results based on this signal onto the K-line chart, so that everyone can more intuitively observe the relationship between signals and price trends.
Conclusion:
Fuzzy control is a very practical signal processing method in short-term trading, which avoids extreme buying and selling while integrating multiple indicator information. For short-term quantitative strategies in A-shares, it is an innovative method worth trying.
The complete code has been placed in the knowledge circle, feel free to take it.
There are two versions:1️⃣ The basic version introduced in this article (can be used directly by copying);2️⃣ The advanced version based on rolling window calculations (recommended), closer to practical use.
Those with certain capabilities can also customize their own fuzzy strategy model based on this foundation, achieving a more personalized quantitative strategy.
Circle Benefits
1. Zero-based Python learning course2. Python automation office course3. Quantitative strategies shared on the public account4. Quantitative tools shared on the public account5. Exclusive WeChat group in the knowledge circle6. Common Python pitfalls7. Guidance from Hua Jie for beginners in quantitative trading

Selected Articles from the Past
A complete guide for beginners in quantitative trading, just follow along
Install real-time market data on your DeepSeek to help you trade stocks
A single article to thoroughly understand the RSI indicator in quantitative trading, with practical strategies + source code, recommended for collection
A method for selecting stocks based on breakout patterns, making money not relying on luck but on patterns and probabilities!
MiniQMT + Backtrader: The “golden partner” in the civilian stock quantitative field, forever a legend!
Ten thousand words of content: Using neural networks to predict the stock market, this time it’s really explained thoroughly, Python + neural network practical process (with source code)
Is opening a supermarket in A-shares reliable? (with source code)
Understand the five most commonly used moving averages in quantitative trading in one article, with source code, recommended for collection
A bull market is not something you wait for; it’s something you sense in advance: Hua Jie teaches you to create your own sentiment indicator for A-shares
From 0 to 1, build a quantitative framework that even beginners can run [illustrated tutorial]
Why do indices rise while you lose money? The market breadth indicator that 80% of people overlook is revealed, implemented in Python (with source code)
Do you have no time to trade stocks? Why not try this overnight ultra-short strategy (with: Python quantitative source code)
Is it a reversal or an illusion? The mysterious indicator of Wall Street geniuses: Python practical magic nine turns (with code) is a must-see for quantitative beginners
Follow the trend or reverse? Use ADX to determine trend strength, Python tutorial takes you through the entire process
The core strategy of one-in-two board hitting: A full-link practical guide from quality first board to two consecutive boards
About Hua Jie
Hua Jie focuses on Python quantitative and stock strategy research, while also sharing basic Python knowledge, with practical and down-to-earth content, adept at interpreting the market with code and enhancing cognition through strategies, full of practical insights..
👇Follow+Star Hua Jie’s public account to see the articles as soon as possible👇
If this article helps you, please click “Recommend” to support Hua Jie
— End —
The strategies mentioned in the article are for academic exchange onlyBacktesting results do not represent future performanceThe market has risks, and decisions should be made cautiously