In the Dr.EV App, many car owners will notice that three sets of data related to range are presented on the homepage. On the surface, they all relate to battery power and driving distance, but they actually correspond to different calculation logics and physical meanings. To help everyone better understand the differences and relationships between these three types of range data, this article will conduct an in-depth analysis of Usable SOC, Rated Range, and Projected Range, and in conjunction with the principles of Tesla’s Battery Management System (BMS), provide a comprehensive understanding of how these data are derived and what they mean for daily driving and battery management.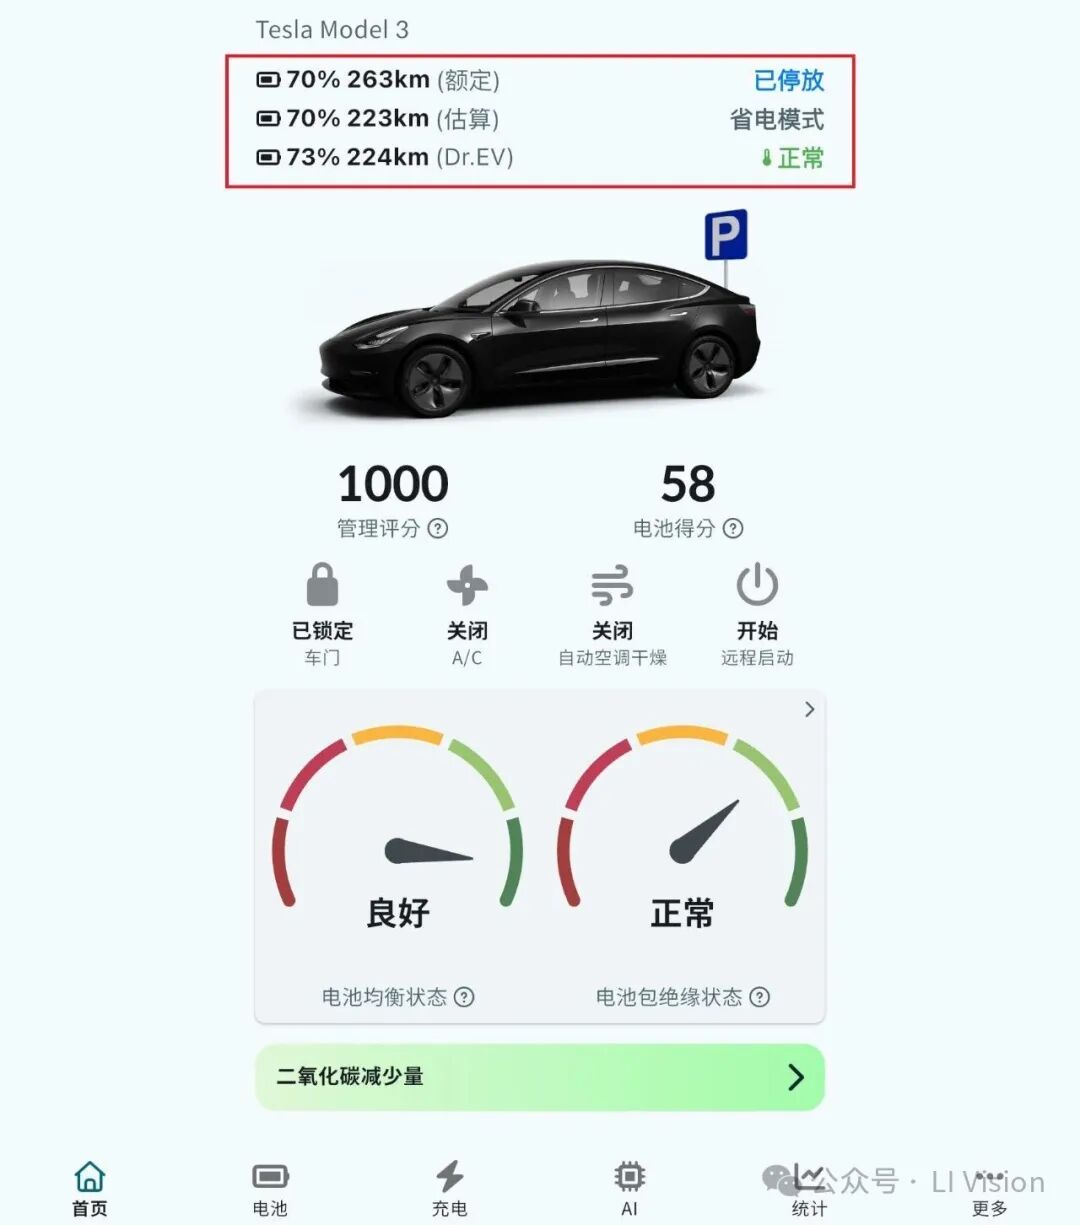
1. Usable SOC: The Battery Percentage You See Is Not the Total Battery Power
Definition Usable SOC (Usable State of Charge) is the battery percentage displayed on the vehicle’s screen, representing the energy currently available for immediate driving. It does not include the buffer reserved by the vehicle to protect battery life.
-
Therefore, the 0% ≠ truly empty, but means ‘almost depleted’, still retaining a very small safety margin;
-
This approach provides drivers with a usable energy reference, avoiding misleading hidden buffers.
2. How Battery Degradation Reflects on SOC
Principle The Battery Management System (BMS) always calculates SOC based on current capacity (rather than the capacity when new). As the battery degrades, the actual usable kWh (the amount of energy stored) decreases, meaning that even if it shows 100%, the range will decline.
Example A new Model 3 Long Range can reach about 310 miles when fully charged. After several years, it only shows 285 miles when fully charged, which corresponds to a capacity decrease of about 8%. This is why SOC ‘always shows 100%’, but the full charge range changes with battery health.
3. The Impact of Temperature on Usable SOC: Why There Is a ‘Blue Snowflake’
In cold environments, some energy will be temporarily locked and unavailable, forming the blue area in the battery icon.
-
Blue lower edge: The immediately available energy (Usable SOC);
-
Blue upper edge: The total SOC including frozen energy.
As driving, charging, or pre-conditioning warms up the battery, the frozen energy is gradually ‘unlocked’, and the range increases in real-time. Therefore, the SOC in cold conditions will be adjusted downwards until the battery warms up.
4. How BMS Calculates Usable SOC
Estimation Method: BMS calculates using coulomb counting and voltage measurement.
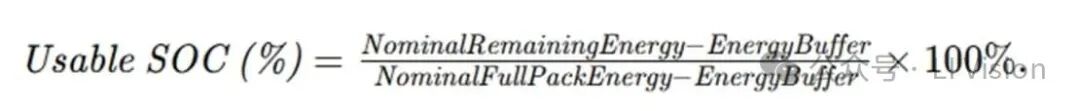
Approximate Formula:
-
Usable SOC: The battery percentage displayed by the vehicle.
-
Nominal Remaining: The current remaining energy estimated by the BMS.
-
Nominal Full Pack: The total energy estimated by the BMS when the battery is at 100%.
-
Buffer: The energy reserved by the system, which is unavailable and used to protect the battery.
Example If the BMS determines the total energy of the battery to be 70 kWh, with a reserved buffer of 3 kWh:
-
The usable capacity is 67 kWh;
-
When the remaining (including buffer) is 33.5 kWh, the displayed SOC is approximately 50%.
This method ensures that ‘0% = almost empty’, avoiding misleading drivers with hidden energy.
5. Rated SOC and Rated Range: The ‘Benchmark’ Under EPA Conditions
Definition Rated Range is the usable energy converted into the range under EPA conditions, serving as a fixed reference value.
Testing Method
-
55% city conditions (low-speed stop-and-go) + 45% highway conditions (maximum 60 mph, average 48 mph);
-
The highway portion also incurs about 30% energy consumption penalty to approximate actual highway and air conditioning usage.
Real-World Differences
-
The EPA rated range is more like a comparison benchmark, allowing for horizontal reference between different models;
-
In real highway driving (65–70 mph), cold or hot climates, or frequent air conditioning use, the range is often lower than the rated value.
6. Projected Range: A ‘Real-Time Answer’ Closer to Current Road Conditions
The Tesla vehicle’s Energy Chart and navigation predictions provide more contextualized range estimates.
Calculation Logic Projected Range = Remaining Usable Energy ÷ Recent Average Energy Consumption
-
You can choose the past 5/15/30 miles (or 10/25/50 km) as the reference window.
-
The longer the average window, the more stable the prediction.
Example
-
Remaining 50 kWh, recent average 200 Wh/mi → Projected Range ≈ 250 miles;
-
If the recent average is 300 Wh/mi → the same amount of energy can only run ≈ 167 miles.
Influencing Factors
-
Driving habits: speed, acceleration, following distance;
-
Road conditions and terrain: range prediction is lower after climbing, and increases when going downhill;
-
Air conditioning/heating: winter heating significantly increases energy consumption, reducing range accordingly;
-
Battery temperature: high energy consumption and limited regeneration at low temperatures → prediction values drop and then rise.
Navigation Support When navigation is enabled, the system also considers altitude, speed limits, and climate load, making predictions more aligned with actual travel.
7. Enhanced Interpretation by Dr.EV
-
Active Degradation Correction: Combining SOH (State of Health) to adjust SOC in real-time, making the display more closely reflect current true capacity.
-
Mileage Estimation: Integrating real-world efficiency, combining recent driving efficiency with real-time health data to provide more grounded mileage estimates during changes in temperature, terrain, and air conditioning. Dr.EV can also identify ‘abnormal energy consumption/abnormal degradation’ signals by combining historical curves, assisting owners in optimizing charging limits, pre-conditioning timing, and driving strategies.