
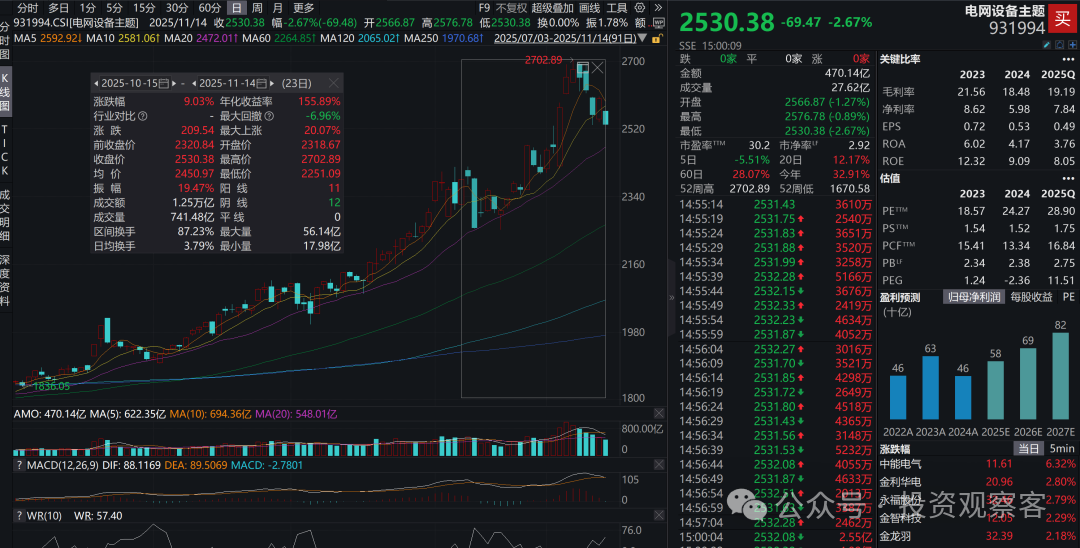
From mid-October to mid-November 2025, the Wind Power Grid Equipment Index (931994.CSI) rose by 9.03%, outperforming the CSI 300 (+2.11%). Is the market at its peak? Unlike typical research reports, I focus more on two catalytic factors that are closer to orders and profits: “Preemptive grid capacity – the red zones directly halt record-keeping, and the grid must invest in upgrades” and “Power equipment going overseas 2.0 – Chinese technology + overseas wallets, with orders and gross margins rising together.”
By reading this, you will gain: a concise conclusion in plain language + a table to understand valuations + a core target list, capturing the key points in three minutes, and enjoy your weekend.。
1. Macroeconomic Environment: Policies Entering a “High-Density” Release Period
1. Central Level
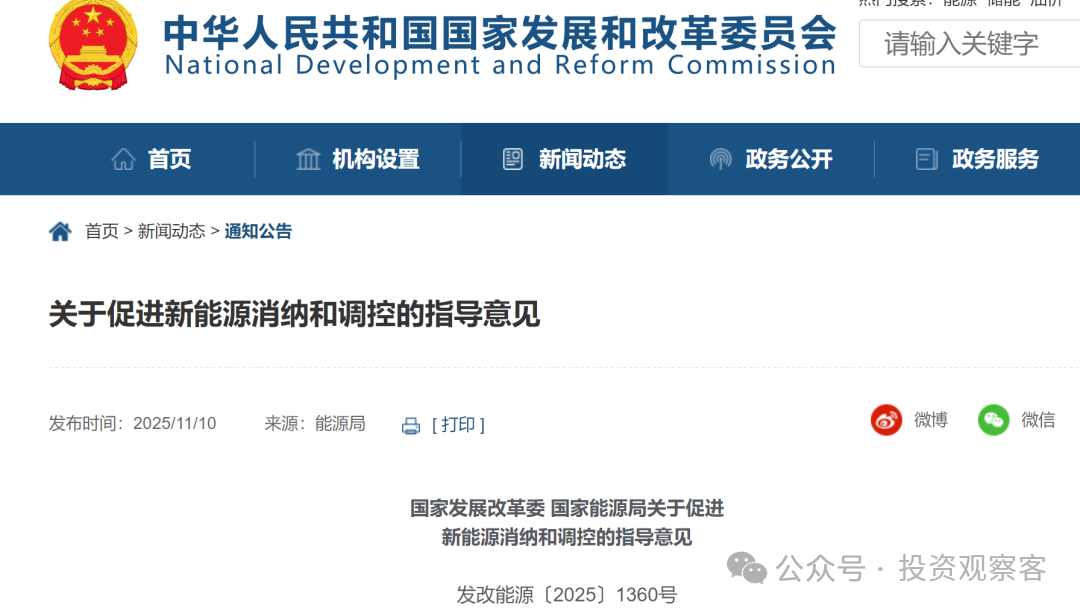
The National Development and Reform Commission (NDRC) has for the first time included “an annual increase of 200 million kilowatts of renewable energy consumption” in its quantitative KPIs. Ultra-high voltage, distribution networks, and energy storage have become “must-answer questions,” establishing a responsibility assessment for consumption that binds local governments and grid companies together.
2. Local Level
Shanxi, Shandong, and Gansu have approved 65 GW of large wind and solar bases in one go, all requiring “preemptive verification of grid capacity” – projects cannot commence without grid upgrades.
3. Financial Aspect
It is estimated that the combined capital expenditure of the State Grid and Southern Grid will reach approximately 825 billion yuan in 2025, an increase of 8.6% year-on-year, setting a new record; according to the payment rhythm of grid investment “first equipment, then civil construction,” the peak payment for equipment will fall in Q4 2025 to Q2 2026.
2. Industry Prosperity: Demand Recovery, End of Inventory Reduction
1. Demand Side
① Total amount is not an issue: From January to September 2025, grid investment reached 368.2 billion yuan, a year-on-year increase of 9.94%, and is expected to exceed 500 billion yuan for the year;
② Structural differentiation: The bidding volume for ultra-high voltage equipment increased by 55% year-on-year, distribution network equipment by 38%, and energy storage support exceeded 15%, while traditional high-voltage cables and towers saw growth rates below 3%, showing a “K-shaped differentiation.”
2. Supply Side (End of Inventory Reduction)
① Capacity Utilization: Leading transformer and GIS manufacturers have a capacity utilization rate of 85%-92%, up more than 20 percentage points from the low point in 2022; mainstream companies have a production scheduling cycle of 6-9 months, with some converter transformer production lines scheduled until 2026.
② Inventory: The turnover days for high-voltage equipment inventory are 45-55 days, lower than the normal range of 70-90 days from 2018-2020, indicating that the industry is at the end of passive inventory reduction.
3. Prices and Profitability
① Bidding Prices: The average winning bid price for the first three batches of ultra-high voltage equipment from the State Grid in 2025 increased by 3%-5% compared to 2024, ending a four-year trend of price declines.
② Cost Side: Copper, aluminum, and oriented silicon steel prices have risen by 1.3%, 4.5%, and 6.0% respectively since early October, but leading companies have locked in gross margins through “raw material hedging + floating price clauses,” with the average gross margin in Q3 2025 for the sector at 23.7%, only down 0.4 percentage points quarter-on-quarter, better than market expectations.
3: Special Attention ①

 : Preemptive Capacity = Order Gate
(1) Why “must invest”
1. Provinces like Shandong, Shanxi, and Gansu have directly linked “available capacity = 0” with halting record-keeping; without upgrades, cash flow on the power supply side is blocked;
2. For grid companies, halting record-keeping → grid connection fees → income from transmission and distribution tariffs are also affected, turning investment motivation from “optional” to “not investing means losing the market”;
3. The policy provides the only way out: the grid must present “enhancement measures” and commit to a timeline; record-keeping can only be restarted after capacity is released – effectively shifting the investment responsibility back to the grid.
(2) Where to invest? “4+1” Incremental Package
|
Incremental Package |
Typical Investment per Station/Area |
Driven Equipment Categories |
Market Space from 2025-2027 (Forecast) |
|
1. Distribution Transformer Expansion, Line Enlargement |
150,000-250,000 yuan/station |
Transformers, Medium Voltage Cables, Pole Switches |
300,000 distribution stations nationwide need upgrades, corresponding to150-200 billion yuan |
|
2. Station Energy Storage/Flexible DC Interconnection |
0.8-1.2 yuan/Wh (50kW/100kWh package) |
PCS, Batteries, EMS, Isolation Transformers |
With 5kW/100kWh energy storage,90-120 billion yuan |
|
3. Smart Switches + Sensors |
30,000-50,000 yuan/station |
DTU/FTU, Fault Indicators, Smart Circuit Breakers |
Penetration rate from 65% to 90%,40-50 billion yuan |
|
4. Reactive Power Compensation and Voltage Regulation |
10,000-20,000 yuan/MVar |
SVG, APF, Capacitor Banks |
Distributed high penetration areas30-40 billion yuan |
|
5. System Level (External Transmission & Inertia) |
Single Circuit Ultra-High Voltage 20-30 billion yuan |
Converter Transformers, GIS, Control Protection, Phase Shifters |
15-18 new lines from 2025-2027,over 400 billion yuan (indirectly related to capacity) |
Note: Items 1-4 are directly triggered by “unlocking red zones,” with visible demand and quick order fulfillment; Item 5 is system-level consumption, with the pace depending on the approval of new ultra-high voltage projects, but the approval logic is also based on “utilization rate and capacity” calculations.
(3) Changes in Investment Entities: Grid Capital is No Longer the Sole Payer
1. Grid Assets – counted in transmission and distribution tariffs, with locked returns, willing to invest without hesitation;
2. Social Capital – encourages “grid leasing + capacity fees” or “third-party investment + profit sharing,” with Shanxi and Shandong piloting to include energy storage capacity fees in regional transmission and distribution tariff balancing pools;
3. Co-construction by Power Generation Enterprises – for yellow zones, allows power generation companies to self-build energy storage at 5%-15% of the connection capacity, treated as unified scheduling on the grid side.
(4) Quantitative Impact
From 2025-2027, the grid side (including third parties) is expected to add an average of 250-300 billion yuan annually, with 50-60% falling on distribution networks, bringing equipment manufacturers’ order visibility up to 2027.
In summary: the “red zones” are not a full stop, but the ignition key for the next capital cycle of grid equipment.
4: Special Attention ②

 : Power Equipment Going Overseas
(1) Total and Regional Breakdown
From January to September 2025, China’s power equipment export value reached 62.7 billion USD, a year-on-year increase of 36.3%, exceeding the average of electromechanical products by 12 percentage points; among them, transformers increased by 39%, high-voltage switches by 31%, and converter valves by 58%.
Regional breakdown: Europe (aging replacement) accounts for 28%, the Middle East (green hydrogen/new cities) 20%, Latin America (new energy bases) 15%, North America (IRA subsidies) 12%, and ASEAN (new energy quotas) 10%.
(2) Realization of Technical Premiums
-
±1100kV DC and 1000kV AC complete technology localization rate >95%, with overseas project gross margins 3-5 percentage points higher than domestic;
-
Amorphous alloy transformers, 300Wh/kg energy storage systems, and liquid-cooled PCS have formed differentiated pricing, with an average premium of 8-12%.
(3) Tracking Major Orders
Saudi NEOM New City 28.8 billion yuan (China XD Group won GIS + converter transformer bid)
Brazil Belo Monte III 9.2 billion yuan (State Grid NARI control protection + converter valve)
Germany Offshore Wind Power Flexible DC 1.2GW 5.4 billion yuan (TBEA’s share of converter transformer 60%)
California Energy Storage 1.5GWh 2.1 billion yuan (Sungrow PCS + battery system)
(4) Channel and Model Upgrades
From “single machine export” to “EPC + equipment” to “equipment + operation + financial” solutions, with an average order size increasing 2.5 times and payment cycles shortened by one-third.
(5) Competition and Risks
The EU plans to launch a “localization of supply chain” investigation, which may require 10-15% local manufacturing by 2026;
If production capacity in Mexico and Turkey is slow to materialize, North American orders may be diverted to South Korea/Japan.
(6) Quantitative Impact on Equipment Manufacturers
From 2025-2027, overseas annual demand is expected to equate to 900,000 MVA of transformers, 22 GW of converter valves, and 85 GW of energy storage PCS, which corresponds to 28%, 35%, and 42% of China’s 2024 production, respectively, with overseas orders growing at a compound annual growth rate of >25%, significantly higher than domestic orders.
5. Valuation: Is it Expensive?
(1) Historical Review
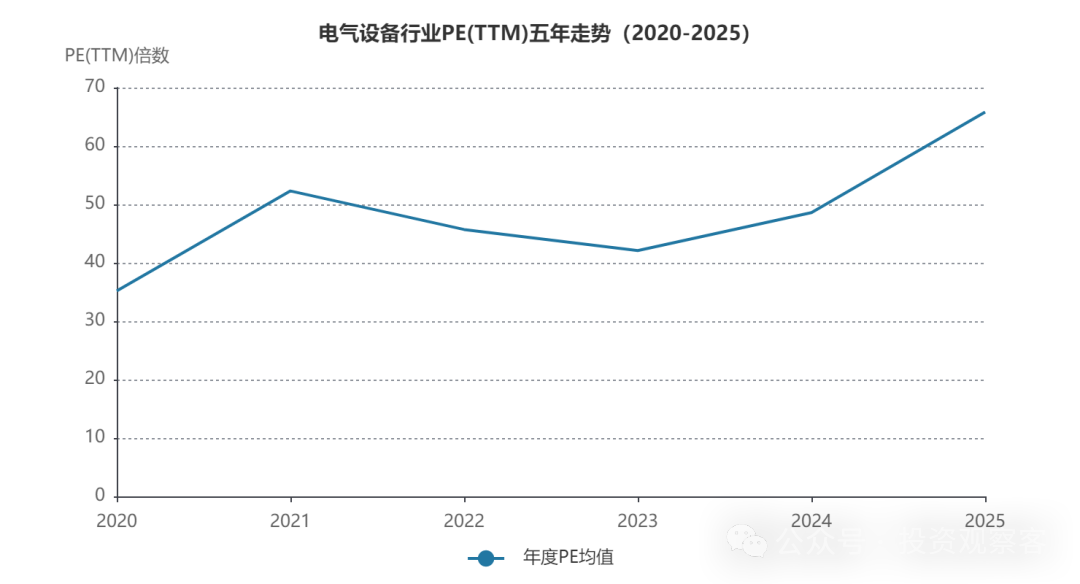
The electrical equipment industry has experienced significant fluctuations in valuation over the past five years.
-
From 2020 to 2021, driven by the renewable energy revolution and “dual carbon” goals, the industry PE-TTM rapidly rose from around 35 times to over 70 times by the end of 2021;
-
From 2022 to 2023, affected by global supply chain disruptions and rising raw material prices, valuations fell back to the range of 40-50 times;
-
Since 2024, with the acceleration of new power system construction and explosive overseas demand, valuations have entered an upward channel again, reaching a historical high of 65.78 times by November 2025.
It is worth noting that the central tendency of industry valuations has shown a systematic upward trend, with the average PE from 2016-2020 around 25 times, while from 2021-2025 it has risen to over 35 times.
(2) Is it Expensive Now?
From a historical percentile perspective, the current PE-TTM is at the 93rd percentile, and PB-LF is at the 51st percentile, which is expensive!
However, this combination of “high profit expectations and stable asset pricing” requires us to look at PEG.
From a segmented perspective, the valuation of new energy supporting equipment (energy storage, inverters, etc.) is the highest; ultra-high voltage and smart grid equipment valuations are relatively reasonable; while wind and solar complete equipment valuations are at historical lows.
|
Segment |
PE(TTM) |
Five-Year Percentile |
2025E Net Profit Growth Rate |
PEG |
Evaluation & Recommendation |
|
Ultra-High Voltage |
28.5x |
63% |
38.6% |
0.65 |
Reasonably Low, Best Value |
|
Smart Grid |
34.2x |
68% |
25.7% |
1.33 |
Reasonable, Select Leading Companies |
|
Energy Storage Supporting |
55-75x |
>75% |
58% |
0.9-1.0 |
High but Acceptable, Focus on High Overseas Proportion Targets |
|
Wind Power Complete Equipment |
22.1x |
25% |
10% |
2.2 |
Low Growth Trap, Wait and See |
|
Photovoltaic Complete Equipment |
24.8x |
28% |
12% |
2.1 |
Low Growth Trap, Wait and See, Wait for Clearance |
Data Source: Wind Consensus Expectations, as of November 14, 2025
Summary: Although the overall PE of the sector is 65.8x and at the 93rd percentile, the PEG of ultra-high voltage is <1, smart grid PEG is approximately 1.3, still within a reasonable range; energy storage growth is high, and PEG is close to 1, with valuations not overstretched.
6. Risk Factors
1. Leading companies have locked in 60-70% of copper and aluminum demand for 2026 through long-term contracts + futures hedging, extreme price increases of 10% will have a gross margin impact of ≤1.5 percentage points.
2. Delays in ultra-high voltage environmental assessments and land use may lead to order confirmation delays;
3. Energy storage price wars may see the system average price drop below 0.8 yuan/Wh in 2026.
7. Investment Strategy
In summary, the three fires of policy cycles + order fulfillment + technology going overseas are still burning, indicating long-term potential; although there has been a general rise, the PEG of ultra-high voltage and smart grid remains within a reasonable range. Recommended core + satellite combination:
Core:
Ultra-High Voltage: TBEA (PE 11x, PEG 0.6), China XD Group (PE 13x, large overseas orders)
Smart Grid: State Grid NARI (orders scheduled until 2027), Sifang Co. (25% market share in DTU);
Satellite:
Sungrow (83% overseas, global PCS leader), Kehua Data (domestic leader in PCS, PEG 0.7).
In summary: Preemptive grid capacity + overseas premiums, orders visible until 2027, ultra-high voltage PEG 0.65 is still at a discount, continue to overweight grid equipment.
(End of text)
Previous Power Research Achievements:
Investment Opportunities in the Power Equipment Sector Driven by AI Computing Power in the U.S.: A-Share Industry Chain
How Did the Chinese Achieve Freedom in Electricity Use?