
Patent Data on High-End Chip Technology of Listed Companies (1994-2025)
Acquisition Method is at the end of the post
Data Overview
CNPaperData
As high-end chips become the core of global technological competition and support the deep integration of the digital economy with the real economy, the patents for high-end chip technology held by listed companies have become a key measure of a company’s core innovation capability and industrial discourse power. These patents not only carry the results of technological breakthroughs in the chip field but also determine the level of autonomy and control within the relevant industrial chain. This data focuses on the precise quantification of the innovation strength of listed companies in high-end chips, comprehensively covering the core information of high-end chip technology patents of A-share listed companies in Shanghai and Shenzhen. Through standardized data screening, cleaning, and integration processes, it systematically collects the scale of high-end chip patents, the technical subfields, and the temporal distribution characteristics, filling the data gap in the evaluation chain of “high-end chip patent layout – core technological strength – industrial application value”. This provides reliable data support for regulatory authorities to optimize chip industry support policies, for universities to conduct research on high-end chip technology innovation, and for investors to explore the development potential of companies in the chip field.
This data focuses on listed companies and refers to the “Key Digital Technology Patent Classification System (2023)”. It uses the patent classification numbers from the “High-End Chip Technology Patent Classification System” to search and match each company’s annual patent applications, filtering out those classified as “high-end chips”. Ultimately, it compiles over 770,000 valid records, presenting the core details of high-end chip technology patents for each listed company by year, providing researchers with a standardized high-end chip patent dataset that can be directly used for empirical analysis.
Data Information
CNPaperData
-
Data Format: Excel
-
Data Scope: Nationwide
|
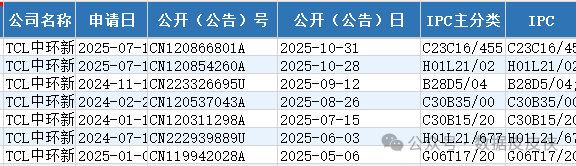
Company Name |
Application Date |
Publication (Announcement) Number |
Publication (Announcement) Date |
IPC Main Classification |
IPC |
|
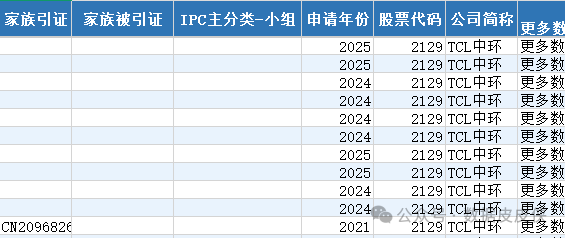
Family Citation |
Family Cited |
IPC Main Classification – Group |
Application Year |
Stock Code |
Company Abbreviation |
|
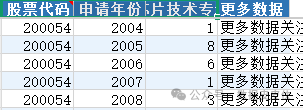
Stock Code |
Application Year |
Number of High-End Chip Technology Patents |
Research Topics
CNPaperData
Topic 1: Research on the Temporal Evolution and Innovation Hotspots of High-End Chip Technology Patents of A-Share Listed Companies from 1994 to 2025
Based on the three-dimensional information of “year – patent quantity – technical subfield”, using time series decomposition (HP filter, moving average), LDA topic modeling, and technology mapping analysis methods, this study systematically depicts the overall growth trend of high-end chip patent output from listed companies in China (such as the differences in patent growth before and after the implementation of the national chip strategy) and the evolution path of technological hotspots (such as the early focus on basic chip design technologies, mid-term shift to process optimization, and later extension towards AI chips and automotive-grade chips). It emphasizes the correlation with key policy nodes related to high-end chips (such as the “14th Five-Year Plan” for digital economy development and the introduction of integrated circuit industry support policies) and technological breakthrough events, identifying the core factors driving fluctuations in patent output, providing empirical evidence for assessing the innovation stage of companies in high-end chips and predicting future technological layout directions.
Topic 2: Analysis of Industry Heterogeneity and Core Driving Factors of High-End Chip Patent Layout of Listed Companies
Based on the 2012 industry classification standards of the China Securities Regulatory Commission, the sample is divided into key industries such as semiconductor manufacturing, electronic information, artificial intelligence, and automotive electronics. By quantifying the imbalance of high-end chip patent output between industries using the Theil index and variance coefficient, and conducting cross-analysis to compare the technological layout preferences of different industries (e.g., the semiconductor industry focuses on chip process patents, the AI industry emphasizes computing power chip patents, and the automotive electronics industry prioritizes reliability patents for automotive-grade chips). Further integration of corporate financial data (R&D investment intensity, proportion of core technical personnel) and industry data (market competition level, technological synergy effects) using a two-way fixed effects panel regression model explores the driving effects of industry characteristics, government subsidies, corporate scale, and technological cooperation models on high-end chip patent layout, providing references for enterprises in the same industry to formulate differentiated high-end chip innovation strategies.
Topic 3: Mechanism and Path Examination of the Impact of High-End Chip Technology Patents on the Capital Market Performance of Listed Companies
This study correlates the “number/quality of high-end chip patents” in this data with indicators from the CSMAR database such as “Tobin’s Q (company valuation)”, “stock price volatility”, and “financing efficiency”, constructing an analysis framework of “technological innovation – value creation – capital market response”. Using mediation effect models and moderation effect models, it examines the impact of high-end chip patents on capital market performance through three paths: “building core technological barriers”, “enhancing product iteration capabilities”, and “strengthening industrial chain discourse power”, while exploring the moderating effects of industry attributes (high-tech/traditional industries) and property rights (state-owned/non-state-owned). It also compares the effect differences of different types of high-end chip patents (design vs. manufacturing) to provide micro-evidence for investors to identify the innovation value of high-end chips and optimize patent layouts.
Topic 4: Evaluation of the Innovation Incentive Effects of High-End Chip Related Policies – Based on a Quasi-Natural Experiment of Patent Output of Listed Companies
This study uses the introduction of national or local high-end chip industry policies (such as “Policies for Promoting High-Quality Development of the Integrated Circuit Industry and Software Industry in the New Era” and “Action Plan for High-End Chip Industry Development in XX Province”) as a quasi-natural experiment. Combining the patent output data from this study, it employs a difference-in-differences (DID) model or regression discontinuity (RD) model to evaluate the net effects of policy implementation on corporate high-end chip patent output. The policy effects are measured from the dimensions of “quantity growth” and “quality improvement”, further conducting heterogeneity analysis to compare the incentive differences of policies in different regions (eastern coastal vs. central and western regions) and different scales of enterprises (leading enterprises vs. small and medium-sized innovative enterprises). Additionally, it uses mediation effect models to examine the internal mechanisms through which policies influence patent output via “reducing R&D financing constraints”, “guiding talent aggregation”, and “strengthening industry-university-research cooperation”, providing empirical support for improving high-end chip industry support policies.
Topic 5: Identification of the “Virtual-Real Matching” of High-End Chip Innovation of Listed Companies and Performance Differences – Based on Dual Perspectives of Patents and Disclosures
This study combines the “number of high-end chip patents (actual innovation)” from this data with the textual disclosure data related to high-end chips in the annual reports and prospectuses of listed companies (extracted through Python text mining) to construct a “disclosure-output matching degree” indicator: a high matching degree represents “substantive innovation”, while a low matching degree (high disclosure, low patents) represents “concept hype innovation”. Using propensity score matching (PSM) methods to eliminate sample selection bias, it compares the financial performance (ROE, net profit growth rate), market performance (market value growth rate, institutional investor attention), and long-term development capabilities (sustainability of R&D investment) of the two types of enterprises. Further, it uses the Logit model to identify the characteristics of “concept hype” enterprises (such as ownership structure, technical background of executives, urgency of financing needs), providing data support for regulatory authorities to combat “chip concept hype” and guide enterprises to engage in substantive innovation, as well as references for investors to avoid related risks.
Data Presentation
CNPaperData
Membership Benefits
CNPaperData
CNPaperData (abbreviated as CNPD) is a national high-tech enterprise based on large-scale data collection, cleaning, and mining, drawing on international databases such as Compustat, WRDS, and the professional standards of FT50 journals to create a research-oriented database for economic management and social sciences with Chinese characteristics. It covers research subjects such as listed companies, enterprises, provinces, cities, counties, universities, and individuals, encompassing various popular data in economics, law, finance, policy, technology, culture, health, environmental protection, and population. High-standard data supports high-quality publications! Data acquisition addresshttps://www.ppmandata.cn/trade/list

Acquisition Method
CNPaperData
Data Number 2163
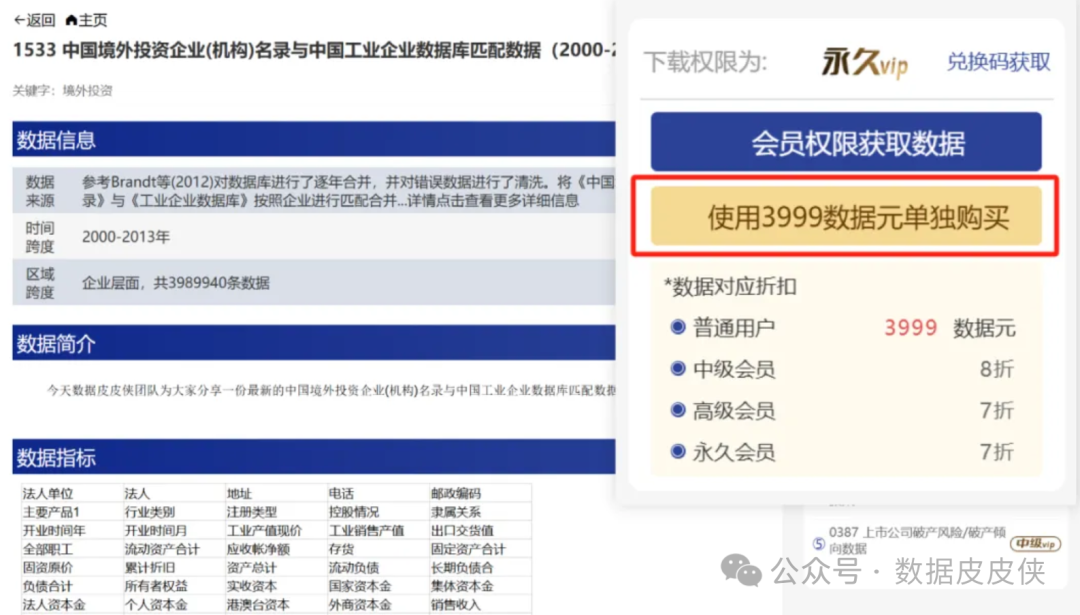
1.Permanent members can search the corresponding number on the official website for free download
2.Non-permanent members can purchase the data separately through the data element in the upper right corner of the webpage after searching for the corresponding number
For example, 1533:
Direct download link for data members:
www.ppmandata.cn