Hey, embedded friends, are you still logging with UART, watching the serial output scroll line by line, which is tedious and time-consuming? Have you ever thought: what if there was a visual tool that could help you instantly understand variable changes and function execution times, could the debugging experience be elevated? The answer is — MCUViewer!
Note MCUViewer is open-source only in version 1.1.0!
What is MCUViewer?
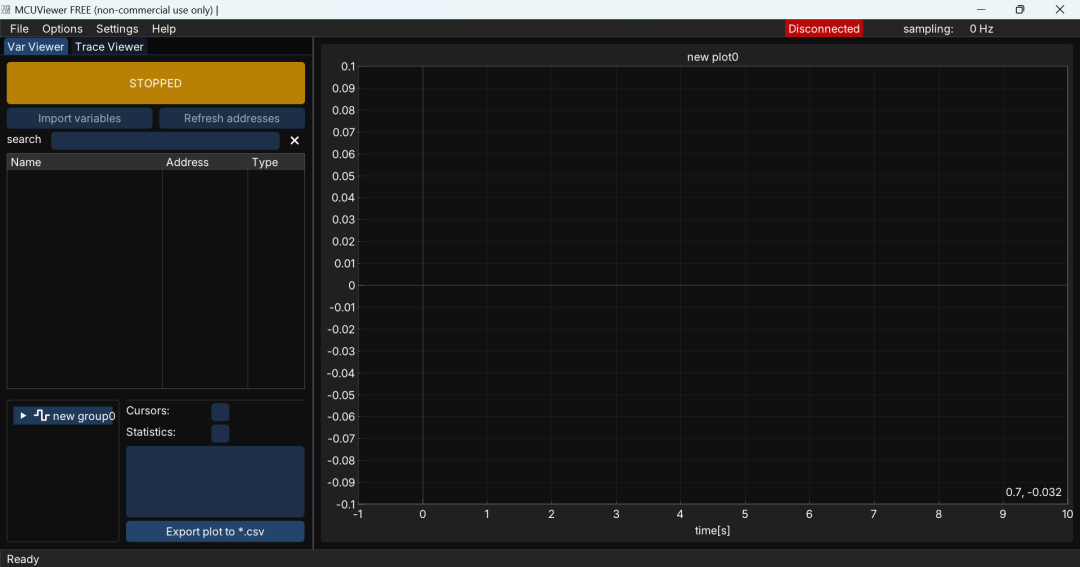
In simple terms, MCUViewer (formerly STMViewer) is a GUI-based debugging tool for microcontrollers, divided into two modules:
- • Variable Viewer reads the values of global variables in RAM in real-time, displaying them as curves or tables, with zero intrusion and zero overhead.
- • Trace Viewer visualizes high-frequency signals and function execution times using SWO (ITM) hardware trace output.
The only required hardware? An STLink or JLink, just connect and enjoy.
What pain points does it solve?
- 1. Serial printing is too slow
- 2. Adding
<span>printf</span>everywhere in the code is cumbersome - 3. STMStudio is no longer updated and only works on Windows + STM32
- 4. Cube Monitor has a complicated interface and high performance overhead
- 5. Unable to perform accurate and fast performance analysis in Release mode
MCUViewer uses pure SWD/SWO debugging, with high bus rates and no additional overhead, directly interfacing with ELF files, making global variable address operations straightforward, far better than UART serial.
Core Features Overview
| Module | Function | Applicable Scenarios |
| Variable Viewer | Real-time monitoring, plotting, and logging of global variables | Low-frequency data, temperature, voltage, current, etc. |
| Trace Viewer | SWO trace curves, function timing, and sampling | High-frequency signals, function execution times, sampling waveforms |
Installation & Quick Start
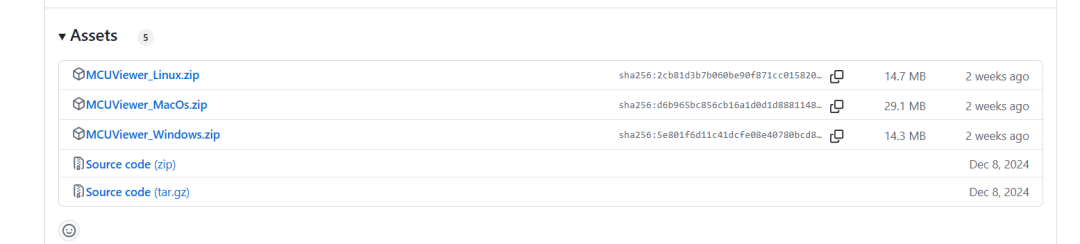
- 1. Download the installation package for your platform (.deb / .exe) and click “Next” all the way through
- 2. Linux users should ensure GDB ≥12.1 is installed and copy the udev rules
- 3. Open the software, go to Options → Acquisition Settings, select ELF, and import variables
- 4. Drag into the workspace, select STLink/JLink, download the program, and click “STOPPED” to start refreshing
Additional steps for Trace Viewer:
- • Enable SWO asynchronous mode in CubeMX
- • Embed ITM markers in the code:
ITM->PORT[0].u8 = 0xAA; // Enter foo(); ITM->PORT[0].u8 = 0xBB; // Exit - • Set a SystemCoreClock / Prescaler to ensure SWO speed does not exceed limits
Pros and Cons Comparison
| Advantages | Disadvantages | |
| MCUViewer | • Zero intrusion, real-time, cross-platform | • Only supports global variables (fixed addresses) |
| • Supports precise profiling in Release mode | • 64-bit type variables are not yet supported | |
| • Trace Viewer can handle bandwidths up to several MHz | • Requires hardware probe and manual SWO / Prescaler configuration | |
| STMStudio | • Quick to get started, officially produced | • No longer updated, only works on Win + STM32 |
| Cube Monitor | • Rich UI, suitable for creating dashboards | • High additional code overhead, not lightweight |
Conclusion
The greatest appeal of MCUViewer lies in its lightweight and efficient nature. You no longer have to stuff serial prints into your code just to see a curve, nor worry about losing precision after Release compilation; it directly relies on SWD/SWO and reads ELF files, providing you with the most “live” data. Whether for low-frequency variable debugging or high-frequency function tracing, or even for performance benchmarking, MCUViewer can save you a lot of effort, making your debugging cycle and mood significantly easier.
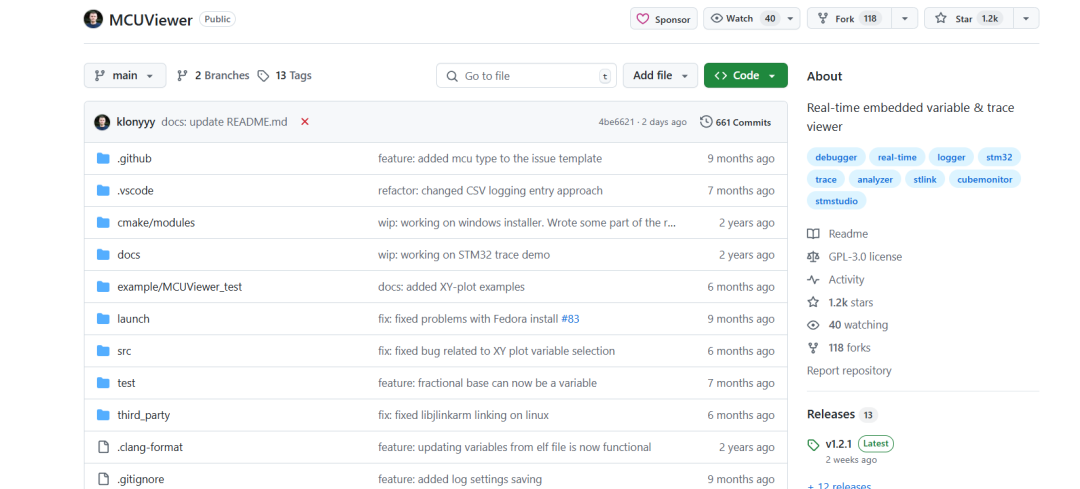
Project address: https://github.com/klonyyy/MCUViewer