1. Introduction
This article discusses the renowned GDB. We won’t mention its prestigious background; like its sibling GCC, it was born with a golden key and holds an irreplaceable position in the GNU family. Every embedded development engineer has likely used gdb to debug programs; if you haven’t, it only indicates your development experience hasn’t been challenging enough, and you still need to be beaten by bugs.
We all know that when using gcc to compile, we can use the -g option to embed more debugging information into the executable file. But what specific debugging information is embedded? How does this debugging information interact with the binary instructions? During debugging, how is context information from the function call stack retrieved from the debugging information?
To address these questions, the author has thoroughly described these fundamental issues in two articles for your enjoyment.
The first article is this one, which mainly introduces the underlying debugging principles of GDB. Let’s take a look at how GDB controls the execution order of the program being debugged.
The second article will analyze a compact yet comprehensive LUA language, covering everything from source code analysis to function call stacks, from instruction sets to modifications of the debugging library.
There is a lot of content, and reading this article may take some time. For your health, it’s not recommended to read this article while in a squatting position.
2. GDB Debugging Model
GDB debugging involves two programs: the gdb program and the program being debugged. Depending on whether these two programs run on the same computer, GDB’s debugging model can be divided into two types:
-
Local Debugging -
Remote Debugging
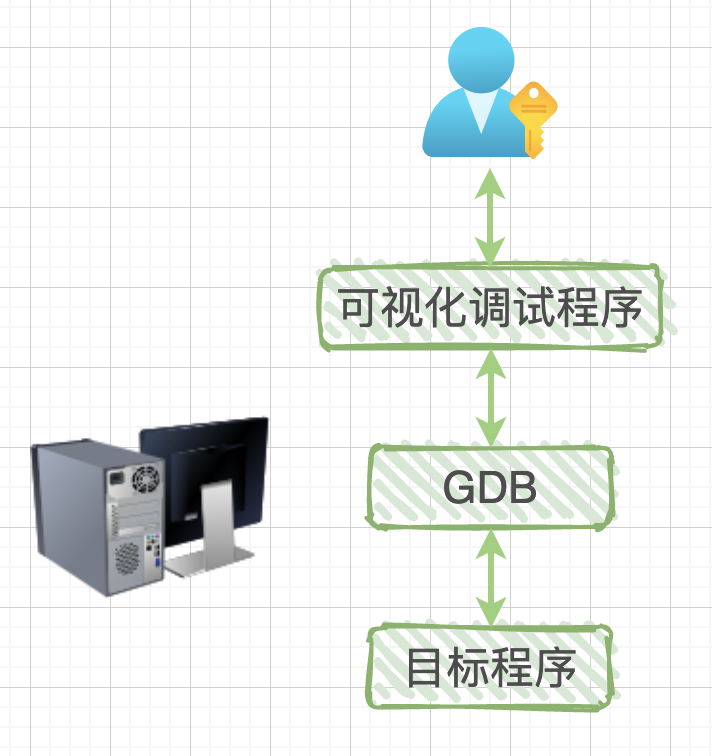
Local Debugging: The debugging program and the program being debugged run on the same computer.
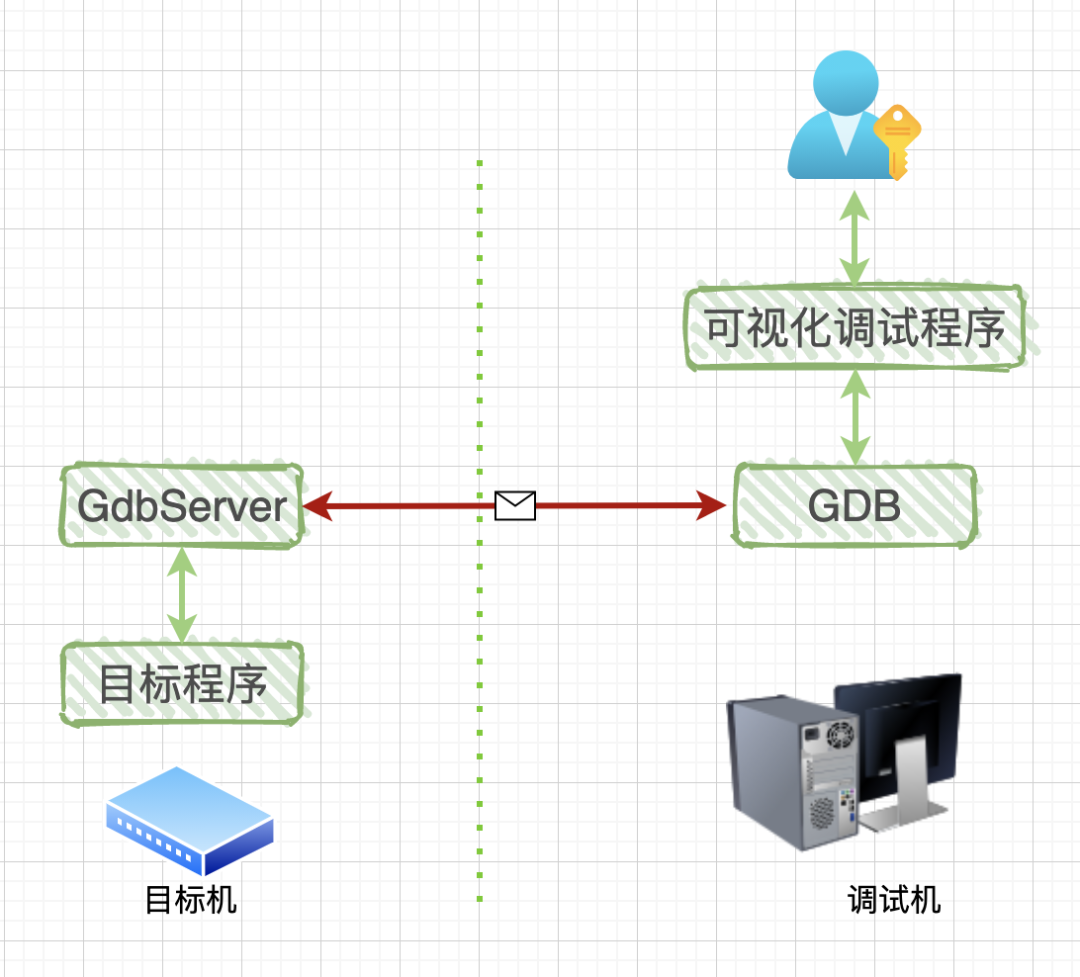
Remote Debugging: The debugging program runs on one computer, while the program being debugged runs on another computer.
The visual debugging program is not the focus; it is merely a shell that wraps GDB. We can either use a dark terminal window to manually input debugging commands or choose an Integrated Development Environment (IDE) that has embedded debugging, allowing us to use various buttons instead of manually entering debugging commands.
Compared to local debugging, remote debugging adds a GdbServer program, which runs on the target machine, which could be an x86 computer or an ARM board. The red line in the diagram indicates communication between GDB and GdbServer through a network or serial port. Since this is communication, a communication protocol is required: RSP protocol, which stands for GDB Remote Serial Protocol.
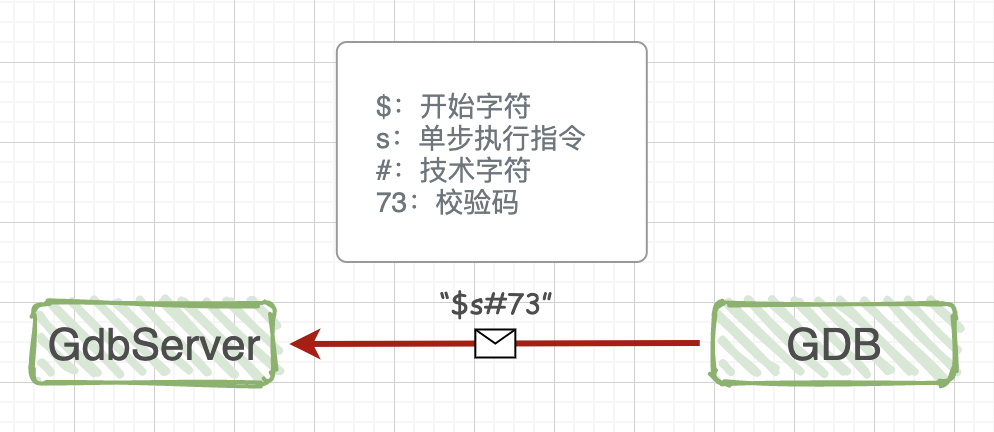
We don’t need to worry about the specific format and content of the communication protocol; we just need to know that they are strings with a fixed start character (‘$’) and end character (‘#’), followed by two hexadecimal ASCII characters as checksums. Understanding this much is sufficient. As for more details, if you are really bored, you can take a glance; these protocols, like various quirky regulations in society, are thought up by a bunch of experts in the restroom.
In the second article discussing LUA, we will implement a similar remote debugging prototype. The communication protocol is also a string, which simply simplifies the HTTP protocol for use, making it very clear and convenient.
3. GDB Debugging Commands
For completeness, here are some GDB debugging commands for a general understanding.
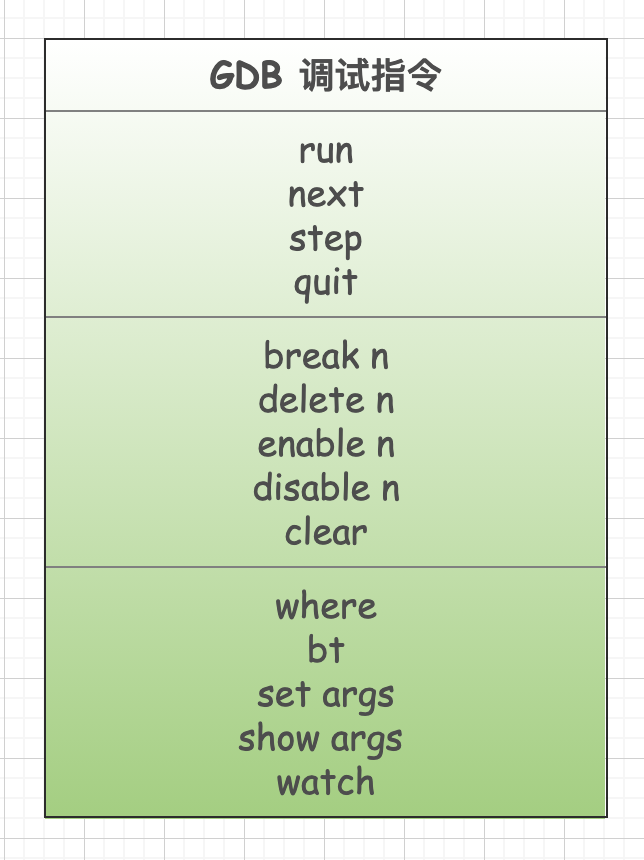
Additionally, not all commands are listed here; only commonly used ones that are relatively easy to understand are included. In the LUA explanation, we will select some of these commands for detailed comparison, including their underlying implementation mechanisms.
Each debugging command has many command options; for example, breakpoint-related options include: setting breakpoints, deleting breakpoints, conditional breakpoints, temporarily disabling/enabling, etc. The focus of this article is to understand the underlying debugging mechanism of gdb, so the usage methods of these application-level commands will not be listed here, as there are many resources available online.
4. Relationship Between GDB and the Program Being Debugged
For convenience, let’s write the simplest C program:
#include <stdio.h>
int main(int argc, char *argv[]){    int a = 1;    int b = 2;    int c = a + b;    printf("c = %d \n", c);    return 0;}
Compilation command:
$ gcc -g test.c -o test
We debug the executable program test by entering the command:
$ gdb ./test
The output is as follows:
In the last line, you can see the cursor blinking, indicating that the gdb program is waiting for us to issue debugging commands.
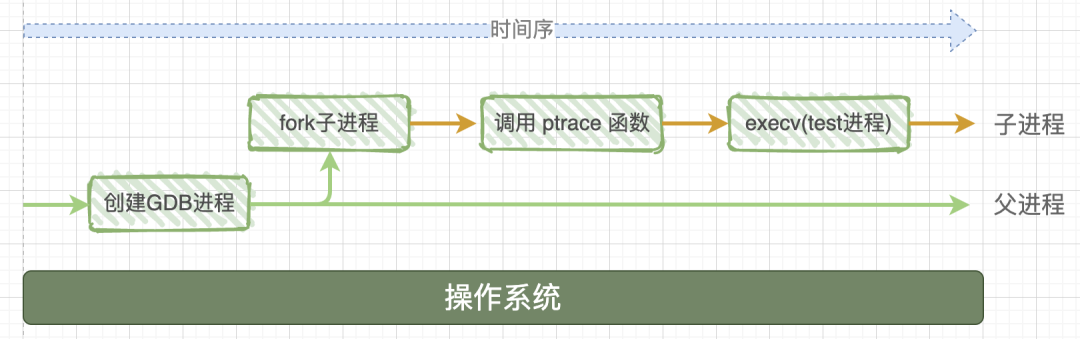
When the dark terminal window executes gdb ./test, many complex things happen in the operating system:
The system first starts the gdb process, which calls the system function fork() to create a child process. This child process does two things:
-
Calls the system function ptrace(PTRACE_TRACEME, [other parameters]); -
Executes the executable program test through exec, meaning the test program starts executing in this child process.
To add a note: sometimes the article refers to it as a program and sometimes as a process. “Program” describes a static concept, which is a bunch of data sitting on the hard drive, while “process” describes a dynamic process, where this program is read and loaded into memory, and there is a task control block (a data structure) in the operating system specifically used to manage this process.
After a long buildup, the main character finally makes its appearance: the system call function ptrace (the parameters will be explained later), which is precisely what gives gdb its powerful debugging capabilities. The function prototype is:
#include <sys/ptrace.h>
long ptrace(enum __ptrace_request request, pid_t pid, void *addr, void *data);
Let’s take a look at the brief introduction of this function in the man page:
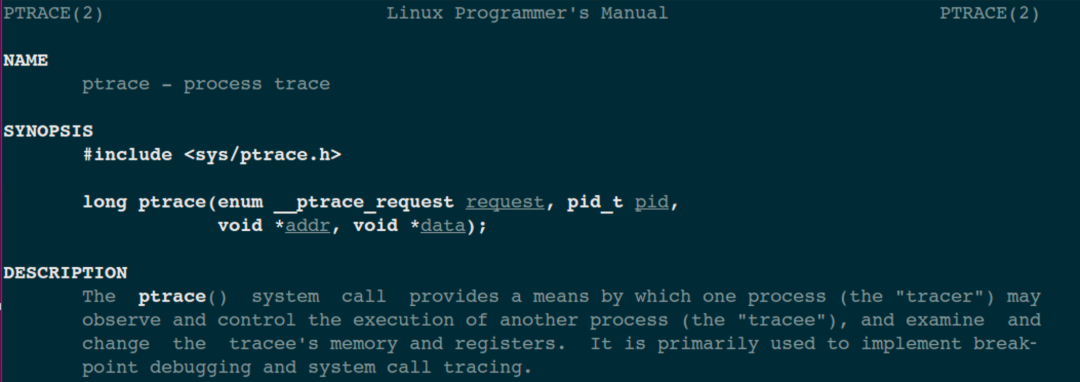
tracer is the debugging program, which can be understood as the gdb program; tracee is the program being debugged, corresponding to the target program test in the diagram. It is common to use -er and -ee to indicate active and passive relationships, for example: employer means the employer (boss), employee means the hired worker.
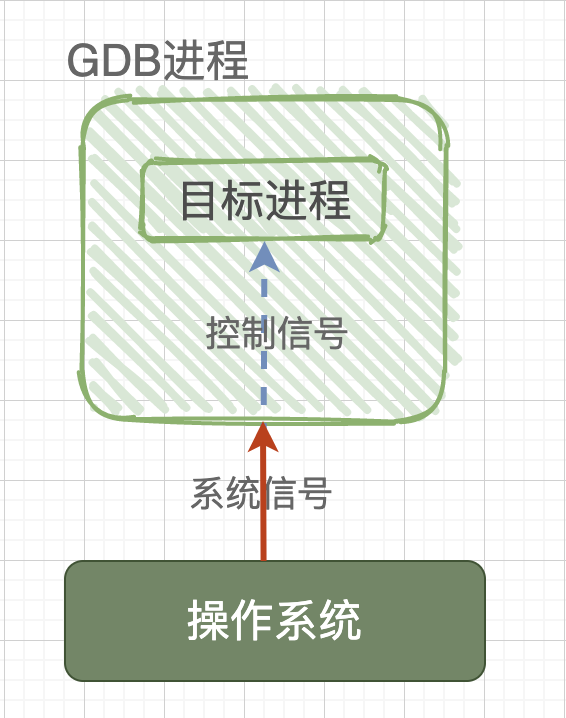
The ptrace system function is a system call provided by the Linux kernel for process tracing. Through it, one process (gdb) can read and write the instruction space, data space, stack, and register values of another process (test). Moreover, the gdb process takes over all signals sent to the test process, meaning that all signals sent by the system to the test process are received by the gdb process. Thus, the execution of the test process is controlled by gdb, achieving the purpose of debugging.
In other words, without gdb debugging, the operating system interacts directly with the target process; if gdb is used to debug the program, then the signals sent by the operating system to the target process will be intercepted by gdb. Gdb will decide whether to pass the currently intercepted signal to the target program while continuing to run the target program, allowing the target program to perform corresponding actions under the signals sent by gdb.
5. How GDB Debugs Already Executing Service Processes
Some might wonder: the program test being debugged starts executing from the beginning; can gdb debug a service process that is already executing? The answer is yes. This involves the first parameter of the ptrace system function, which is an enumeration type value, with two important ones: PTRACE_TRACEME and PTRACE_ATTACH.
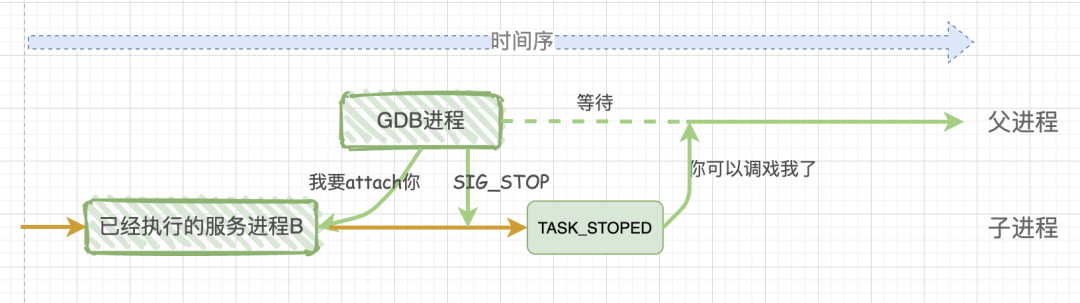
In the previous explanation, the child process used the parameter PTRACE_TRACEME when calling the ptrace system function. Note the orange text: it is the child process calling ptrace, equivalent to the child process telling the operating system: the gdb process is my parent; any signals you want to send to me should be sent directly to the gdb process!
If we want to debug an already executing process B, then the gdb parent process must call ptrace(PTRACE_ATTACH, [other parameters]). At this point, the gdb process will attach to the already executing process B, and gdb will adopt process B as its child process. The behavior of child process B is equivalent to having performed a PTRACE_TRACEME operation. At this point, the gdb process will send a SIGSTOP signal to child process B, which upon receiving the SIGSTOP signal will pause execution and enter the TASK_STOPED state, indicating it is ready to be debugged.
Therefore, whether debugging a new program or an already executing service program, through the ptrace system call, the final result is: the gdb program is the parent process, and the debugged program is the child process. All signals from the child process are intercepted by the parent process gdb, and the parent process gdb can view and modify the internal information of the child process, including: stack, registers, etc.
Regarding binding, there are a few restrictions to understand: self-binding is not allowed, multiple bindings to the same process are not allowed, and binding to process 1 is not allowed.
6. Peeking into How GDB Implements Breakpoint Instructions
The big principles have been explained; here we will peek into the internal debugging mechanism of gdb by using the set breakpoint (break) debugging command. Let’s use the previous code as an example and repost it:
#include <stdio.h>
int main(int argc, char *argv[]){    int a = 1;    int b = 2;    int c = a + b;    printf("c = %d \n", c);    return 0;}
Let’s look at the disassembled code produced by the compilation command:
gcc -S test.c; cat test.S)
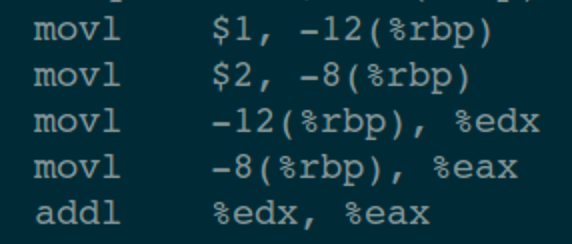
Only part of the disassembled code is posted here; as long as it illustrates the underlying principles, we achieve our goal.
As mentioned, after executing gdb ./test, gdb forks a child process. This child process first calls ptrace and then executes the test program, thus preparing the debugging environment.
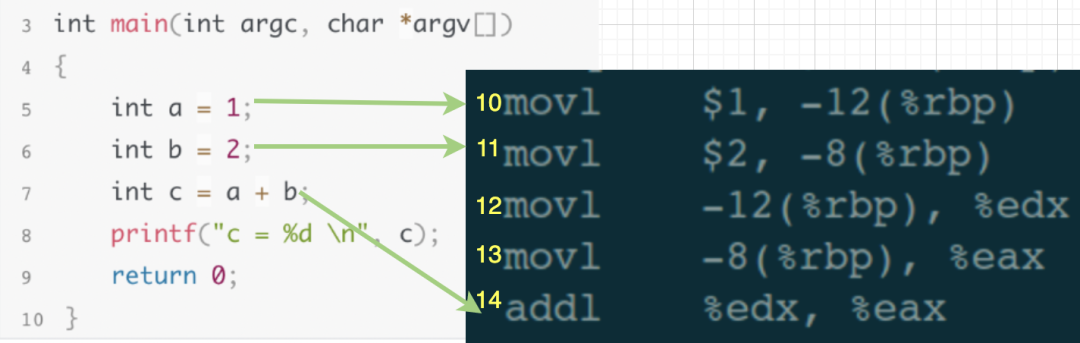
We will place the source code and assembly code together for easier understanding:
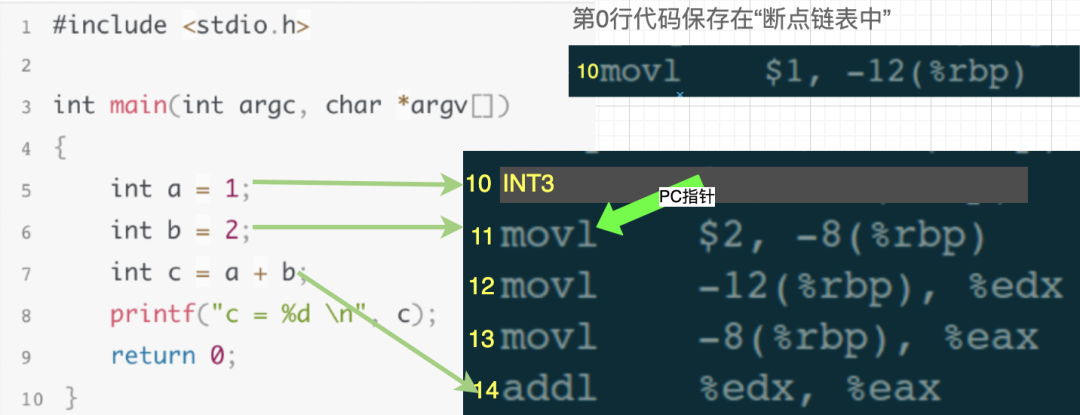
In the debugging window, input the command to set a breakpoint “break 5”. At this point, gdb does two things:
-
Stores the assembly code corresponding to the 10th line of the source code in the breakpoint linked list. -
Inserts the interrupt instruction INT3 at the 10th line of the assembly code, meaning: the 10th line in the assembly code is replaced with INT3.
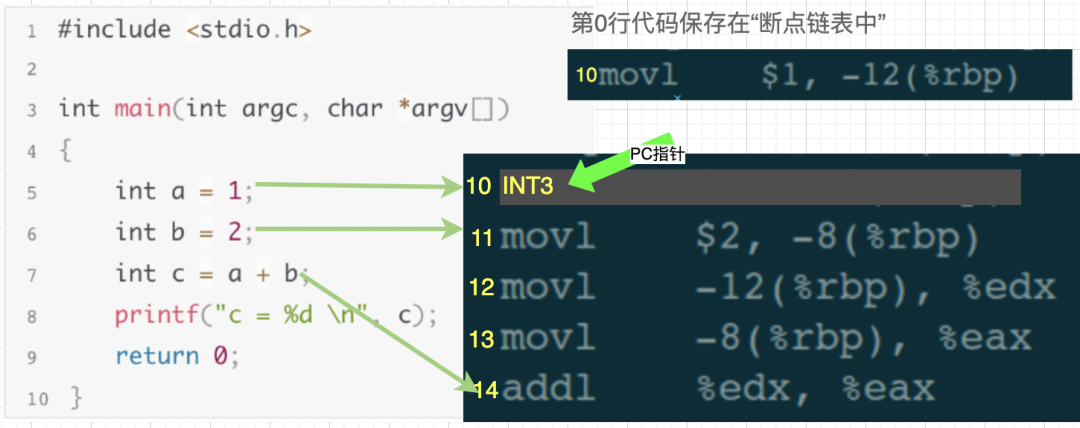
Then, in the debugging window, continue entering the execution command “run” (execute continuously until encountering a breakpoint and then pause). When the program counter (PC), an internal pointer pointing to the next line of code to be executed, executes the 10th line of assembly code and finds it is the INT3 instruction, the operating system sends a SIGTRAP signal to the test process.
At this moment, the 10th line of assembly code has been executed, and the PC pointer points to the 11th line.
As already mentioned, any signal sent to test by the operating system is intercepted by gdb. This means that gdb will first receive this SIGTRAP signal. Gdb discovers that the current assembly code being executed is the 10th line, so it checks the breakpoint linked list and finds the 10th line’s code stored there, indicating a breakpoint has been set at the 10th line. Gdb then performs two operations:
-
Replaces the INT3 in the 10th line of assembly code with the original code from the breakpoint linked list.
2. Moves the PC pointer back one step, meaning it sets it to point to the 10th line.
Then, gdb continues to wait for user debugging commands.
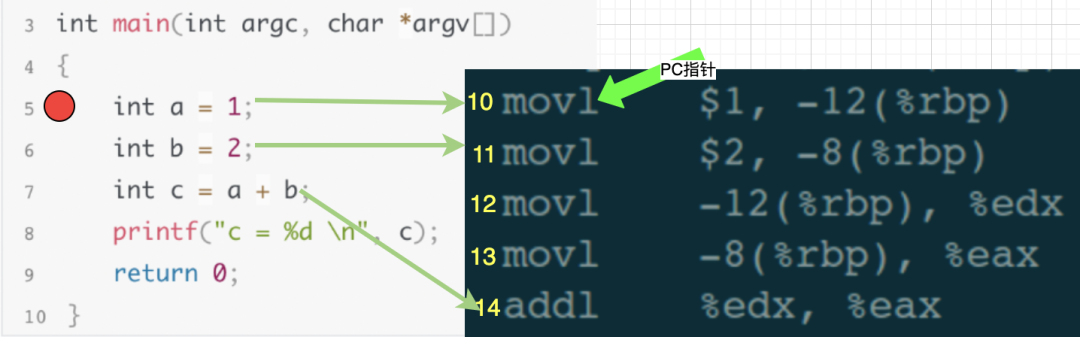
At this moment, it is equivalent to the next instruction to be executed being the 10th line in the assembly code, which corresponds to the 5th line in the source code. From the perspective of us, the debugger, the debugged program has paused at the 5th line breakpoint, allowing us to continue inputting other debugging commands to debug, such as viewing variable values, checking stack information, modifying local variable values, etc.
7. Peeking into How GDB Implements Next Step Instructions
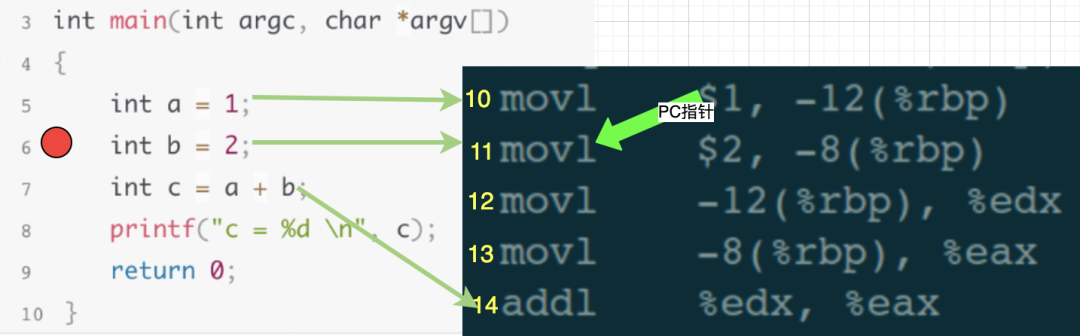
Using the same source code and assembly code as before, let’s assume the program is currently paused at the 6th line of the source code, which corresponds to the 11th line of the assembly code:
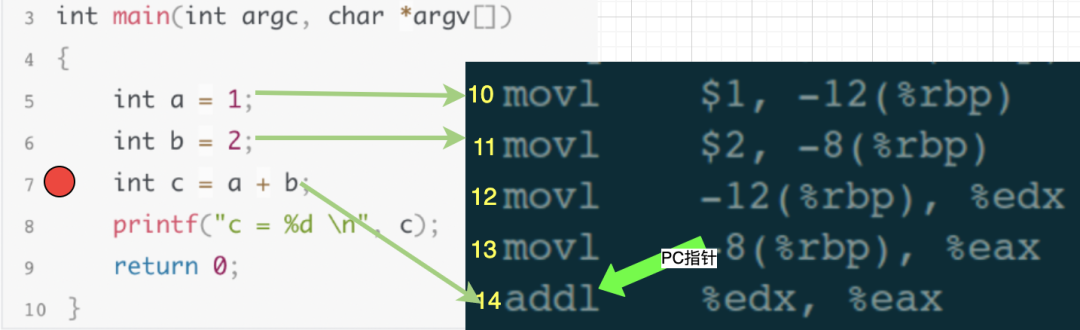
In the debugging window, input the single-step execution command next. Our goal is to execute one line of code, meaning to finish executing the 6th line of code in the source and then stop at the 7th line. When gdb receives the next execution command, it will calculate which assembly code corresponds to the 7th line of the source code, which should be the 14th line of the assembly code. Thus, gdb controls the assembly code’s PC pointer to execute until the 13th line finishes executing, stopping when the PC points to the 14th line, then continues waiting for user debugging commands.
8. Conclusion
Through the break and next debugging commands, we have understood how gdb processes debugging commands. Of course, gdb has many other debugging commands, including more complex stack information retrieval, variable value modification, etc. Interested readers can continue to delve deeper.
– EOF –
1. From 0 to 1: The Growth Journey of Monitoring and Alerting for Small and Medium Teams
2. A Performance Optimization of a Standalone System: It Turned Out to Be TCP’s Fault
3. After Hearing Me Explain GET and POST Principles, the Interviewer Served Me a Cup of Cappuccino
Did you gain something from reading this article? Please share it with more people.
We recommend following ‘Linux Enthusiasts’ to enhance your Linux skills.
Likes and views are the greatest support ❤️