
Click the blue text above to follow us



Gift for readers

👨💻 Conducting research involves a profound system of thought, requiring researchers to be logical, meticulous, and serious. However, effort alone is not enough; often leveraging resources is more important than hard work. Additionally, one must have innovative ideas and inspirations. It is recommended that readers browse in order to avoid suddenly falling into a dark maze without finding their way back. This article may not reveal all the answers to your questions, but if it can clarify some of the doubts rising in your mind, it may create a beautiful sunset of insights. If it brings you a storm in your spiritual world, then take the opportunity to brush off the dust that has settled on your ‘lying flat’ mindset.
Perhaps, after the rain, the sky will be clearer…….🔎🔎🔎



1 Overview

Simulation Study of Erbium-Doped Fiber Amplifier (EDFA) Analysis Model
Research
1. Introduction: The Erbium-Doped Fiber Amplifier (EDFA) is a key device in the field of optical communication, crucial for long-distance, high-capacity fiber optic communication systems. Based on the stimulated emission effect of erbium ions, it can effectively amplify optical signals, thereby extending the transmission distance of optical signals. This article will conduct a simulation study of the EDFA analysis model to gain a deeper understanding of its working principles and performance characteristics.
2. Basic Structure and Working Principle of EDFA
Basic Structure
The EDFA mainly consists of erbium-doped fiber, pump light source, optical coupler, and optical isolator. The erbium-doped fiber is the core part of the amplifier, where the doped erbium ions undergo energy level transitions under the action of pump light, thereby achieving optical signal amplification.
Working Principle
When an external optical signal passes through the erbium-doped fiber amplifier, the electrons in the erbium ions are excited to a high energy level. Subsequently, under the influence of spontaneous and stimulated emission, the electrons transition from the high energy level to the low energy level, releasing photons with the same frequency as the incident optical signal, thus achieving optical signal amplification.
3. Establishment of EDFA Analysis Model
To conduct a simulation study of the EDFA, it is necessary to establish its analysis model. This model should accurately describe the energy level transition process of erbium ions in the erbium-doped fiber, the interaction between pump light and signal light, and the optical signal amplification process.
Erbium Ion Energy Level Model
The outer layer electrons of erbium ions have a three-level structure, including the ground state energy level, metastable state energy level, and high energy level. Under the action of pump light, erbium ions transition from the ground state energy level to the high energy level, then quickly decay to the metastable state energy level. Under the influence of signal light, erbium ions transition back from the metastable state energy level to the ground state energy level, releasing photons to achieve optical signal amplification.
Interaction Model of Pump Light and Signal Light
Pump light and signal light are simultaneously injected into the erbium-doped fiber through the optical coupler. In the fiber, the pump light excites erbium ions to the high energy level, while the signal light interacts with erbium ions in the metastable state energy level, achieving optical signal amplification.
Optical Signal Amplification Model
The optical signal amplification process can be described by solving the optical power transfer equation in the erbium-doped fiber. This equation considers the stimulated emission, spontaneous emission, and fiber losses.
4. Simulation Study and Analysis
Gain Characteristics Analysis
By simulating the gain characteristics of the EDFA under different pump powers, erbium concentrations, and fiber lengths, we can gain insights into how these parameters affect amplifier performance. The simulation results indicate that the gain increases with the increase in pump power, but when the pump power exceeds a certain value, the gain increase becomes slow. Additionally, the gain is also related to erbium concentration and fiber length.
Noise Characteristics Analysis
The EDFA introduces noise while amplifying optical signals. By simulating the noise characteristics under different conditions, we can evaluate the noise performance of the amplifier. The simulation results show that the noise figure decreases with the increase in input optical power, but at high input power, the decrease in noise figure becomes slow.
Multi-Channel Amplification Characteristics Analysis
In WDM systems, the EDFA needs to amplify the optical signals of multiple channels simultaneously. By simulating the multi-channel amplification characteristics, we can evaluate the amplifier’s performance in amplifying multi-wavelength signals. The simulation results indicate that the EDFA exhibits good gain flatness and stability during multi-channel amplification.
5. Conclusion and Outlook
This article conducts a simulation study of the analysis model of the Erbium-Doped Fiber Amplifier (EDFA), providing a deeper understanding of its working principles and performance characteristics. The simulation results indicate that the EDFA has advantages such as high gain, low noise, and multi-channel amplification capability, making it suitable for long-distance, high-capacity fiber optic communication systems. In the future, we will further optimize the design of the EDFA to improve its performance and stability to meet broader application needs. At the same time, we will explore more new types of fiber amplifier technologies to promote the continuous development of optical communication technology.



2 Operating Results

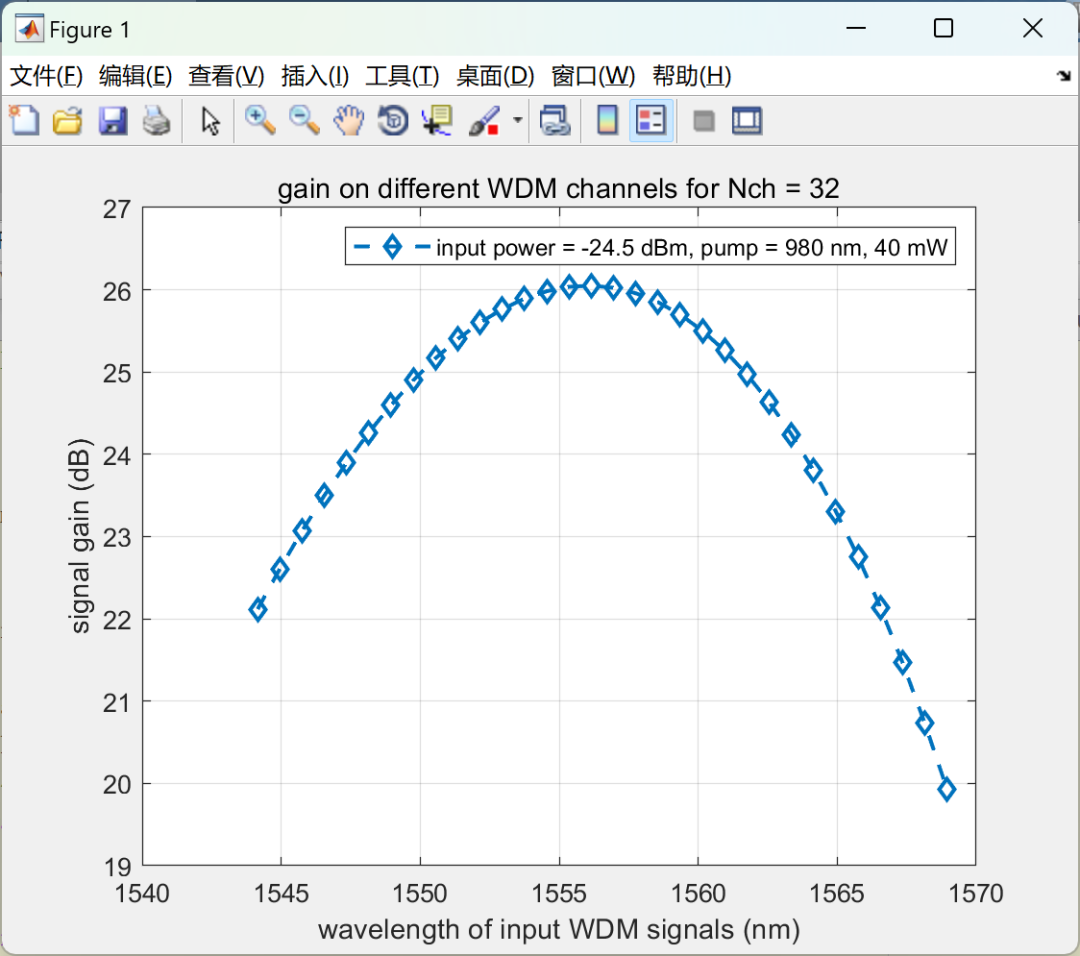
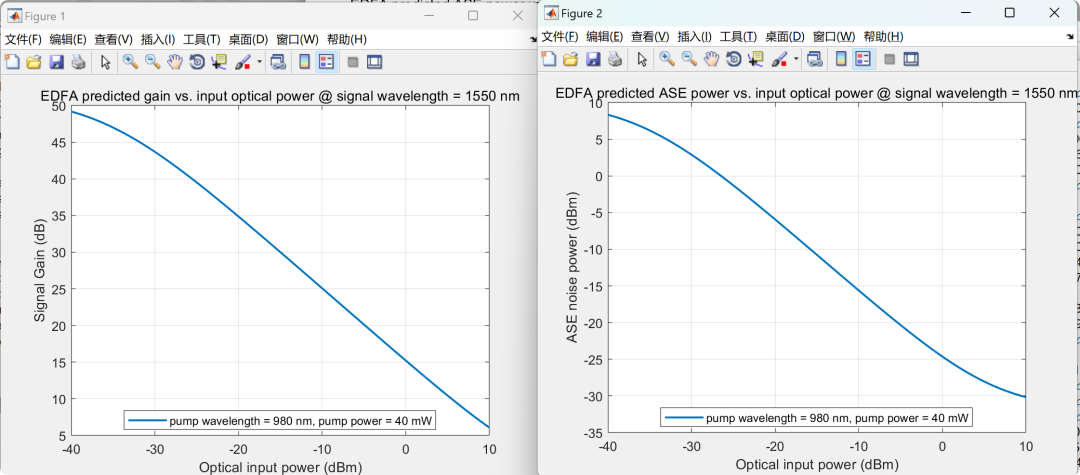
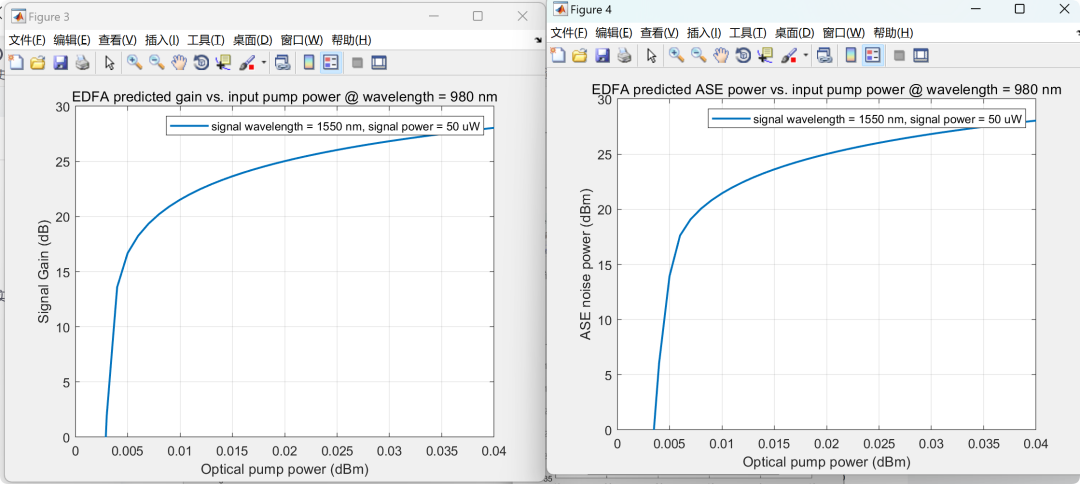
部分代码:

%% defining some material parameters
N = 32;                       % number of channels
del_L = 126.46e-6;           % path length difference of arrayed-waveguide (um)
del_x = 25e-6;               % spacing of input/output waveguides (um)
Lf = 9381e-6;                % focal length of focusing slab waveguide (um)
%m = 118;                     % diffraction order
%m = 1.173361254044390e+002;
Psig0_dBm = -5*ones(1,N);
m = det_m(Psig0_dBm,80);
s = 1.4529;                 % effective refractive index of slab waveguide
c = 1.4513;                 % effective refractive index of channel waveguide
cl = 3e8;                    % speed of light in vacuum (m/s)

%% calculation of center wavelength of all the channels
lambda0 = nc*del_L/m;        % centre wavelength (um)
i = (-N/2):1:(N/2-1);        % indices for input/output waveguides
j = (-N/2):1:(N/2-1);
theta_i = (i*del_x/Lf);      % diffraction angles in the input slab
theta_o = (j*del_x/Lf);      % diffraction angles in the output slab
channels = zeros(1,N);       % wavelengths for the channels ideally
ch_spcng = 0.8e-9;           % spacing of the consecutive channels (0.8 nm)
channels(1) = lambda0-(N/2)*ch_spcng;
for i = 1:1:N,
if(i == 1)        channels(i) = lambda0-(N/2)*ch_spcng;
else        channels(i) = channels(i-1)+ch_spcng;    end
end

%%Psig0_dBm = -24.5*ones(1,N);
% P_sig_dBm(1) = 10;
% P_sig_dBm(2) = -55;
% P_sig_dBm(8) = -15;
% P_sig_dBm(11) = 5;
Pase0_dBm = -50*ones(1,N);
lambda = channels;
% P_sig_dBm = 0;
% P_ase_dBm = -10;
% lambda_s = 1550e-9;
P_in_pump = 40e-3;

3 References

Some content in this article is sourced from the internet, and references will be noted. If there are any inaccuracies, please feel free to contact us for removal. (The content of the article is for reference only, and the actual results depend on the operating results)



4 MATLAB Code Implementation

For more resources and benefits for fans, MATLAB | Simulink | Python resources available