When it comes to learning embedded systems, there is undoubtedly a lot to learn and remember. Writing this down helps me reconstruct problems and receive guidance from peers.
1. What is GDB?
During our programming journey, we inevitably encounter program crashes, variable anomalies, and logical errors. This can be particularly frustrating for technical support workers or beginners just starting to learn programming, especially when a program “runs incorrectly but you don’t know where the error is.”
At this point, GDB (GNU Debugger) becomes your “magnifying glass” and “detective tool”!
GDB is an open-source debugger that helps us:
-
Step through the program
-
View variable values
-
Set breakpoints
-
Analyze why the program crashed (e.g., segmentation fault)
👉 In simpler terms: GDB can “pause” the program’s execution, allowing you to see what the program is “thinking”.
2. What can GDB do? Core Functionality Overview
| Function | Description |
|---|---|
| Set Breakpoints | Pause program execution at a specific line or function |
| Step Execution | Execute line by line to find logical errors |
| View Variable Values | Check current variable contents to see if they meet expectations |
| View Call Stack | Clarify how the current execution position was reached |
| Modify Variables | Temporarily change variable values during debugging to validate logic |
| Analyze Crash Information | Trace which line caused the program to crash |
3. Basic Steps to Use GDB (Example in C Language)
1. Prepare a simple C program
#include<stdio.h>int main(){ int a = 10; int b = 0; int c = a / b; // Division by 0 will cause a crash printf("Result is: %d\n", c); return 0;}2. Compile with the <span>-g</span> option (to generate debugging information)
gcc -g test.c -o test3. Start GDB for debugging
gdb ./testAfter entering GDB, you will see the prompt:
(gdb)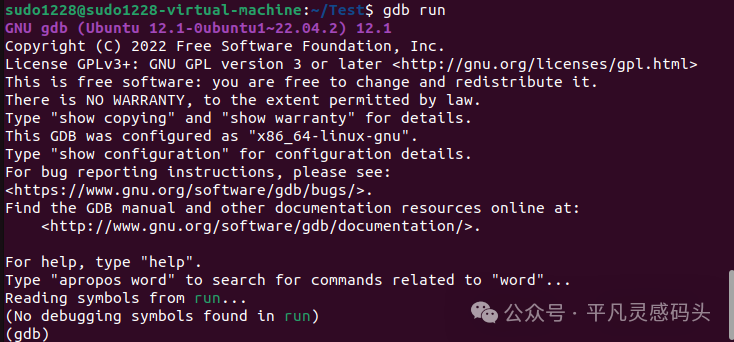
4. Common Commands Examples (Easy for Beginners)
| Command | Description |
|---|---|
<span>run</span> |
Run the program |
<span>break line_number/function_name</span> |
Set a breakpoint, e.g., <span>break 5</span>, <span>break main</span> |
<span>next</span> |
Execute the next line (without entering functions) |
<span>step</span> |
Step into the function for execution |
<span>print variable_name</span> |
View the value of a variable |
<span>backtrace</span> (abbreviated: bt) |
Print call stack information (used when the program crashes) |
<span>quit</span> |
Exit GDB |
🌟 Usage Demonstration: Investigating Program Crash Reasons
(gdb) runOutput:
Program received signal SIGFPE, Arithmetic exception.This indicates that the program encountered a “floating-point exception,” which is due to division by 0.
Next, enter:
(gdb) backtraceTo get the following information:
#0 main () attest.c:6This indicates that the problem occurred on line 6.
Continue to check the variables:
(gdb) print a$1 = 10(gdb) print b$2 = 0You will immediately understand that: <span>int c = a / b;</span> where <span>b == 0</span> is the culprit!