GDB‘s frontend, which allows debugging code in a graphical form within the terminal window (based onncurse), making it very convenient. Compared toGDB, it can significantly improve efficiency.This article will share the most basic usage of CGDB. If you are hearing about it for the first time, I strongly recommend you to try it out; you will definitely love it!
Example Code with Bugs
#include <unistd.h>
#include <stdlib.h>
#include <stdio.h>
#include <string.h>
#include <assert.h>

typedef struct USER_DATA{
	char data[32];
	unsigned short data_len;
	unsigned int flag;
}__attribute((packed))__;

const unsigned char * g_data =  "hello";

/*
Function: Load a piece of data
Param 1: data[OUT]: Buffer where the data is loaded
Param 2: len [OUT]: Actual length of the loaded data
Return: 0-success, else-failure
*/
static int get_data(unsigned char *data, unsigned int *len)
{
	assert(data && len);
	memcpy((void *)data, (void *)g_data, strlen(g_data));
	*len = strlen(g_data);
	return 0;
}

int main(int argc, char *argv[])
{
    // Create struct variable
	struct USER_DATA user_data;
	user_data.flag = 0xA5;

	// Load data into struct variable
	if (0 == get_data(user_data.data, &user_data.data_len))
	{
		printf("get_data ok! \n");
		printf("data_len = %d, data = %s \n", user_data.data_len, user_data.data);
		printf("user_data.flag = 0x%x \n", user_data.flag);  // Expected value: 0xA5
	}
	else
	{
		printf("get_data failed! \n");
	}
	return 0;
}
Before compiling, take a look at the code. Can you spot the bug in it?
Of course, during compilation, the compiler gives a warning about the risk. Since the example code is simple, it is easy to spot.
However, in a project, if you don’t like to eliminate compilation Warning messages, this bug can be quite hidden.
Compile test code: gcc -g test.c -o test
Since you need to use GDB for debugging, don’t forget to add the -g option.
GDB Debugging Operations
$ gdb ./test
(gdb) r   // Run it directly at full speed
(gdb) r
Starting program: /home/captain/demos_2022/cgdb/test
test start...
get_data ok!
data_len = 5, data = hello
user_data.flag = 0x0
[Inferior 1 (process 9933) exited normally]
Noticing that the value of user_data.flag is incorrect, I decided to set a breakpoint on the line before calling get_data, then start executing from the beginning:
View the line numbers:
(gdb) l main
18		*len = strlen(g_data);
19		return 0;
20	}
21
22	int main(int argc, char *argv[])
23	{
24		struct USER_DATA user_data;
25		user_data.flag = 0xA5;
26		if (0 == get_data(user_data.data, &user_data.data_len))
27		{
Set a breakpoint at line 25:
(gdb) b 25
Breakpoint 1 at 0x400771: file test.c, line 25.
Start running:
(gdb) r
Starting program: /home/captain/demos_2022/cgdb/test

Breakpoint 1, main (argc=1, argv=0x7fffffffdc58) at test.c:25
25		user_data.flag = 0xA5;
The execution stopped at the breakpoint, and the assignment statement has not yet been executed, so I execute it step by step:
(gdb) step
26		if (0 == get_data(user_data.data, &user_data.data_len))
At this point, print the value and address of the variable user_data.flag:
Since we will enter the called function later, this variable will become invisible, so we need to print it by address.
(gdb) print &user_data.flag
$1 = (unsigned int *) 0x7fffffffdb62
(gdb) print/x user_data.flag
$2 = 0xa5
At this point, the assignment is correct. Next, continue executing and enter the called function get_data():
(gdb) step
get_data (data=0x7fffffffdb40 "n\333\377\377\377\177", len=0x7fffffffdb60) at test.c:16
16		assert(data && len);
This function has a total of 4 lines of code. We execute it step by step and print the content of the user_data.flag variable each time.
Step to the next line memcpy, and check if the content at the address of user_data.flag is still: 0xa5:
(gdb) step
17		memcpy((void *)data, (void *)g_data, strlen(g_data));
(gdb) print/x *0x7fffffffdb62
$3 = 0xa5
Continue stepping (since we don’t need to follow the internals of memcpy and strlen, we use the next command) and print:
(gdb) next
18		*len = strlen(g_data);     // This line is about to be executed
(gdb) print/x *0x7fffffffdb62
$4 = 0xa5
(gdb) next
19		return 0;
(gdb) print/x *0x7fffffffdb62
$5 = 0x0
We’ve discovered the problem: after executing the statement *len = strlen(g_data), the content at the address of the variable user_data.flag has changed.
Upon careful inspection of the code, we can diagnose that the data type was used incorrectly.
Bug Fix: The last parameter of the get_data() function should correctly be a pointer of type unsigned short.
The problem is solved, but looking back at the gdb debugging process, it is still quite cumbersome: the debugging commands and code display are mixed together, requiring a lot of commands to type.
CGDB Debugging Operations
After starting CGDB, the terminal window is divided into two parts: the upper part is the code window, and the lower part is the debugging window.
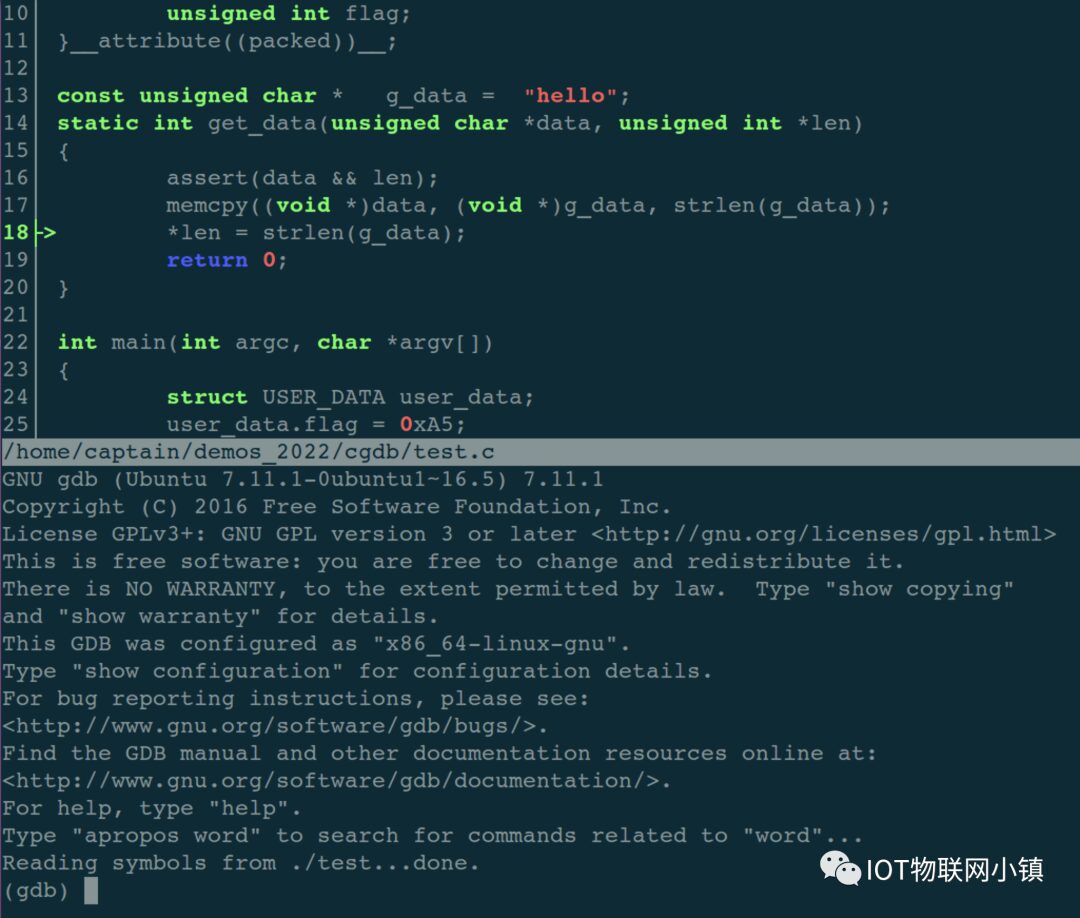
Press the ESC key to enter the code window, where you can scroll through the code up and down and perform a series of operations:
Spacebar: Set or cancel a breakpoint;
o: View the file where the code is located;
/ or ?: Search for strings in the code;
…
There are many convenient hotkeys:
-: Shrink the code window;
+: Expand the code window;
gg: Move the cursor to the top of the file;
GG: Move the cursor to the end of the file;
ctrl + b: Scroll up the code by one page;
ctrl + u: Scroll up the code by half a page;
ctrl + f: Scroll down the code by one page;
ctrl + d: Scroll down the code by half a page;
Press the i key to return to the debugging window, entering debugging mode, where the debugging commands are almost the same as GDB!
In other words: you can perform debugging operations while viewing the code in real time, greatly improving efficiency.
Let’s go through the debugging process of GDB again:
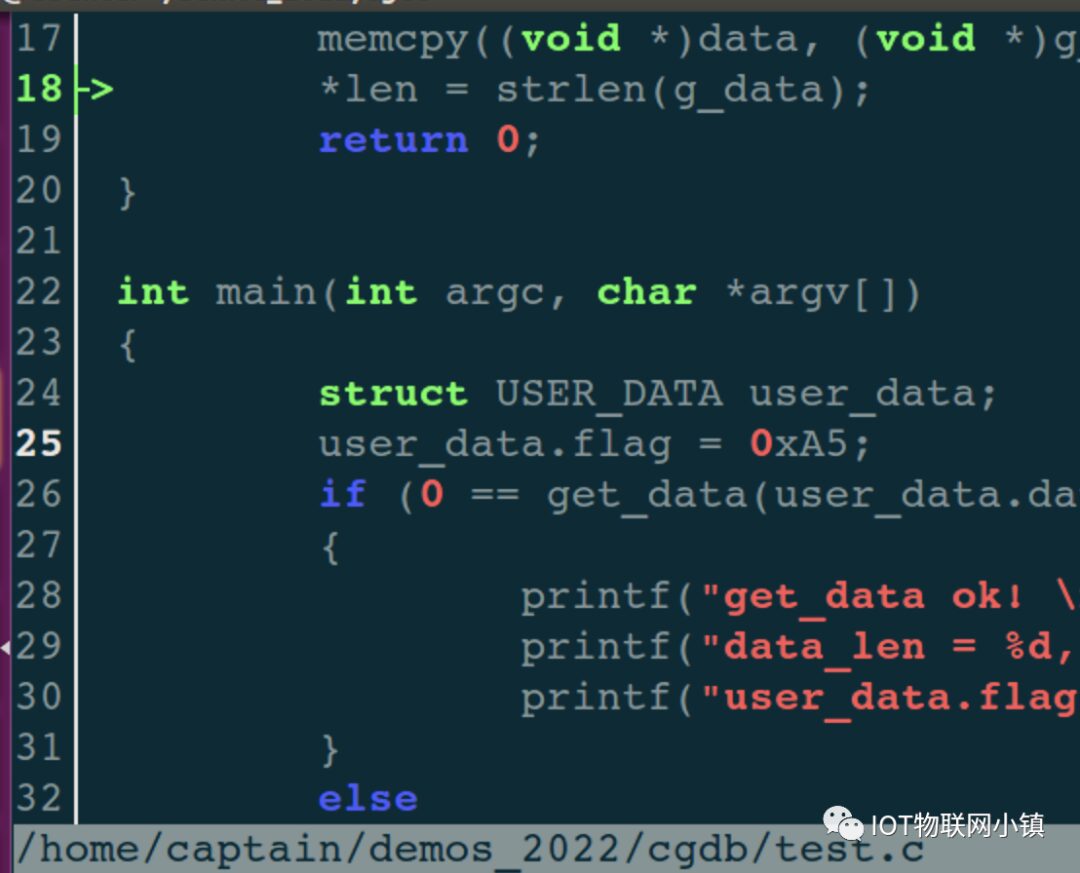
Press the ESC key to enter the code window. If the line number in front of the code is white, it indicates the current line.
Press the j key to move the highlighted current line down. When moving to line 25, as shown below:
Press the spacebar to set a breakpoint on this line, and the line number turns red:
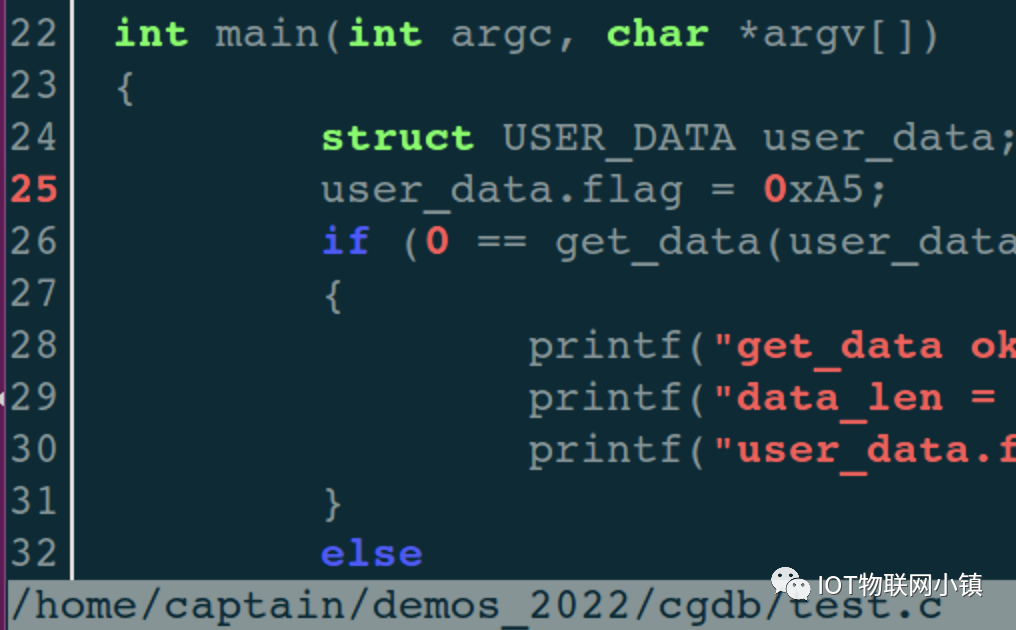
And the debugging window prints a line of information:
(gdb)
Breakpoint 1 at 0x400771: file test.c, line 25.
Press the i key to return to the debugging operation window, then enter the run command r, which will stop at line 25, as indicated by the green arrow below:
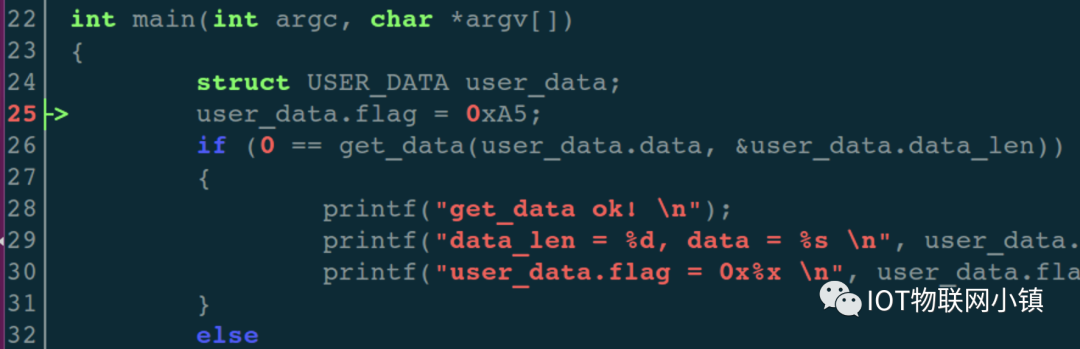
Of course, the debugging window will also print relevant information:
(gdb) r
Starting program: /home/captain/demos_2022/cgdb/test

Breakpoint 1, main (argc=1, argv=0x7fffffffdc58) at test.c:25
Step step to execute this assignment statement, and then print the value and address of user_data.flag:
(gdb) print/x user_data.flag
1: /x user_data.flag = 0xa5
(gdb) print &user_data.flag
2: &user_data.flag = (unsigned int *) 0x7fffffffdb62
At this point, the assignment statement executed correctly, and the printed value is also as expected.
Continue executing step commands to enter the get_data() function:
(gdb) step
get_data (data=0x7fffffffdb40 "n\333\377\377\377\177", len=0x7fffffffdb60) at test.c:16
At this point, the upper code window automatically enters the relevant code of get_data(), as shown below:
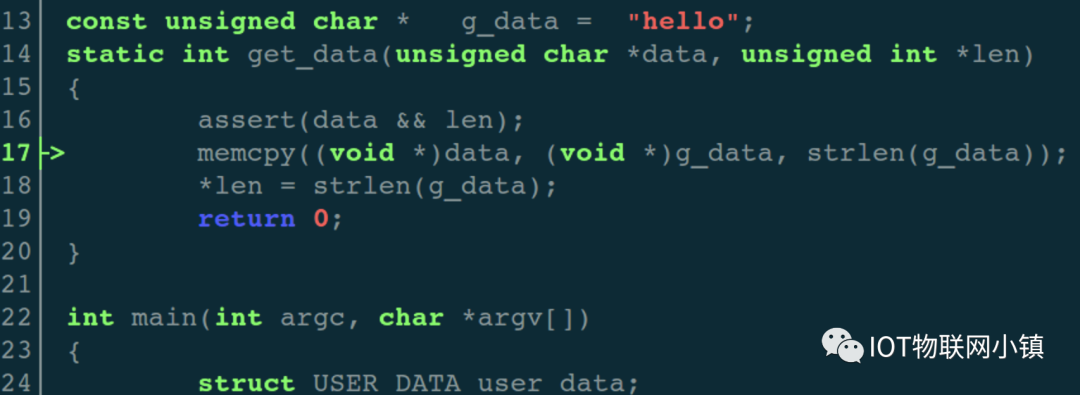
Continue stepping, and before executing the assignment statement *len = strlen(g_data); print the content at the address of the variable user_data.flag:
(gdb) print/x *0x7fffffffdb62
$2 = 0xa5
Correct! Then execute the assignment statement, and print again:
(gdb) next
(gdb) print/x *0x7fffffffdb62
$3 = 0x0
We found the problem: after executing the statement *len = strlen(g_data), the content at the address of the variable user_data.flag has changed.
Summary:
The operation process of CGDB is quite smooth, although I wrote it in detail, but in actual use, it is truly smooth, just like chocolate!
Since you have read this far, if you find it good, please give a quick 【like】 and 【view】!
Reposted from WeChat public account: IOT Internet of Things Town