In-depth understanding of gdbgui: A powerful graphical debugging toolDuring the software development process, debugging is an indispensable and important part. It helps developers identify errors in the program and ensures that the software runs stably. As a powerful graphical debugging tool, gdbgui is gradually gaining popularity among developers.
1. What is gdbguigdbgui is a graphical frontend developed based on gdb (GNU Debugger). gdb is a widely used debugger that helps developers inspect the internal state of a program while it is running, find and fix errors. However, the command-line operation of gdb may not be very user-friendly for some developers and has a high learning cost. The emergence of gdbgui effectively addresses this issue by providing an intuitive graphical user interface for gdb, making the debugging process simpler and more efficient.
2. Features of gdbgui
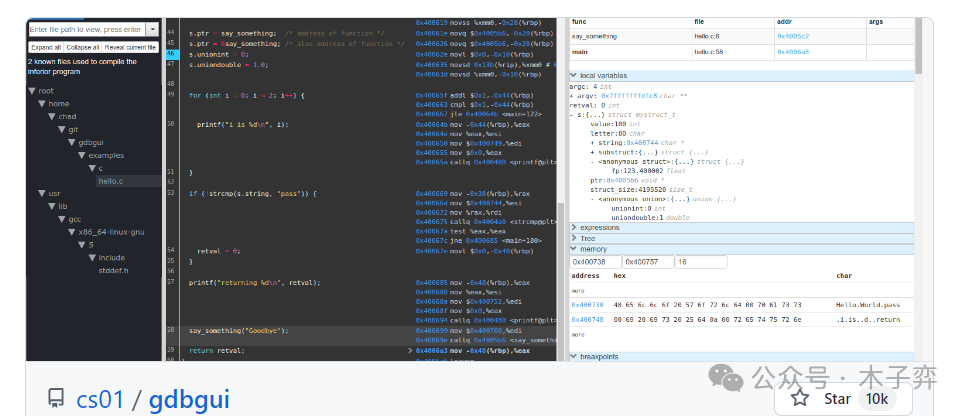
Intuitive Interface: gdbgui presents various information during the debugging process clearly through a simple and clear graphical interface. For example, during debugging, users can directly see key information such as variable values, function call stacks, and the execution position of the program on the interface, without needing to query through complex commands.
Breakpoint Management: Supports setting various types of breakpoints, such as line breakpoints, function breakpoints, and conditional breakpoints. Developers can set breakpoints at specific locations in the program based on their needs, allowing the program to pause when it reaches that point for detailed debugging analysis. Moreover, within the gdbgui interface, setting, deleting, and managing breakpoints is very convenient and can be done with simple mouse operations.
Debugging Control: Offers rich debugging control features, including step execution, continue execution, step into functions, and step out of functions. These features allow developers to precisely control the execution flow of the program, gradually checking for errors. For instance, when an exception occurs in the program, developers can use the step execution feature to check the code line by line to identify the problem.
Expression Evaluation: Allows users to evaluate expressions during the debugging process. Developers can input expressions in the interface, and gdbgui will calculate and display the results in real-time, which is very helpful for checking relationships between variables and validating program logic.
3. Installation and Usage of gdbgui
Installing gdbgui is relatively simple and can usually be done via the pip command. After installation, start gdbgui, which will launch a web service locally. Users can access the corresponding address through their browser to open the gdbgui graphical interface. When using, users only need to load the program they want to debug in the interface and set the debugging parameters to start debugging.
4. Advantages of gdbgui
Compared to traditional command-line debugging methods, gdbgui has significant advantages. It lowers the barrier to debugging, allowing more developers to easily get started. Its intuitive graphical interface greatly improves debugging efficiency and reduces time wasted due to incorrect command inputs. Additionally, gdbgui also performs excellently in terms of cross-platform compatibility, running stably on Windows, Linux, and macOS systems.
gdbgui provides developers with a more convenient and efficient debugging method, making it an indispensable tool in the software development process. Whether experienced developers or newcomers, everyone can benefit from gdbgui. With the continuous development of software development technology, gdbgui is expected to continue to improve and update, providing developers with a better debugging experience.