👇Join our tech exchange QQ group with remark 【Official Account】 for faster access

1. Program Release Modes
There are two modes for program release: debug mode and release mode.
1.1 Debug Mode
Purpose: Mainly used during the development and testing phases, allowing developers to more easily debug and trace errors in the program (bugs) to ensure that the software is free of major errors before release.
Features:
Minimal optimization during compilation to facilitate easier observation of the program’s state via debugging tools (like GDB), including variable values, function call stacks, etc.
Includes detailed debugging information (like symbol tables), which is crucial for understanding program behavior and locating issues.
May include additional checks at runtime, such as array boundary checks and null pointer checks, to help catch potential errors.
Typically slower execution speed due to lack of optimization and additional debugging information.
1.2 Release Mode
Purpose: Used for deploying software to a production environment, aiming to provide a stable and efficient running experience for end users.
Features
Various optimizations are performed during compilation, such as code reordering, loop unrolling, and inline functions, to improve execution speed and efficiency.
Does not include debugging information (like symbol tables), to reduce the size of the executable file and improve loading speed.
Removes all runtime checks (like array boundary checks and null pointer checks) to decrease runtime overhead.
Undergoes strict code checks and testing to ensure program stability and security.
Typically faster execution speed due to optimizations and the removal of unnecessary checks.
2. Default Release Mode
The binary programs generated by Linux gcc/g++ are in release mode by default, which cannot be debugged. To use gdb for debugging, the -g option must be added when generating the binary program from the source code.
How can we prove the above conclusion?
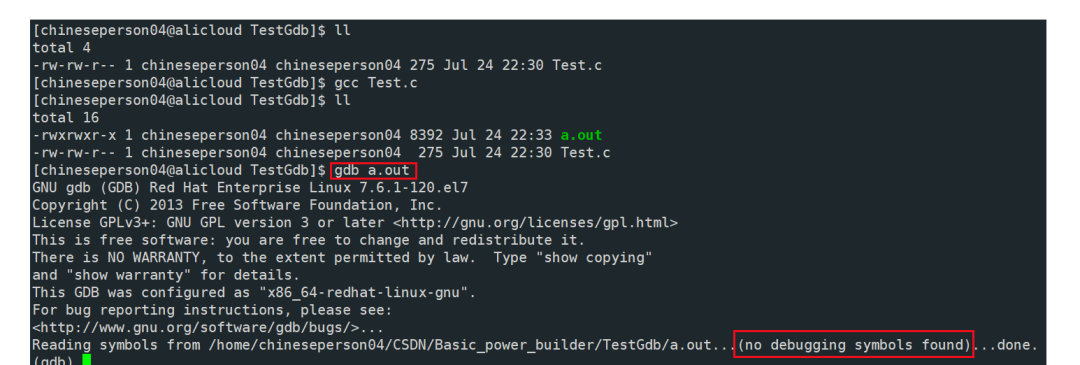
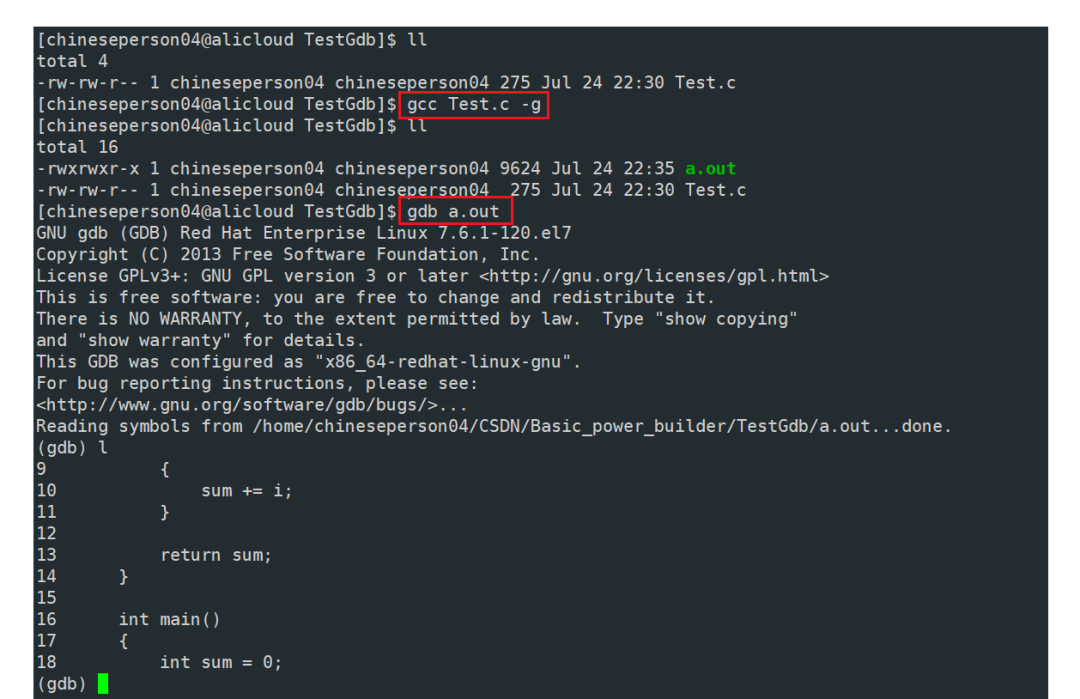
First, compile the Test.c file into an executable program a.out without any options and then debug a.out with gdb. We will find no debugging information. Then, compile Test.c with the -g option to generate the executable program a.out and debug a.out with gdb, and we will notice the absence of the previous warning.
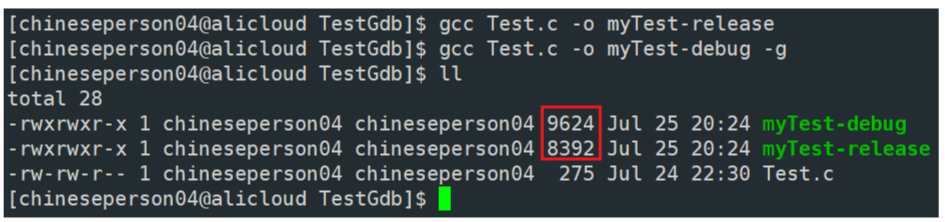
By using gcc with and without the -g option to generate executable programs for release and debug versions respectively, we find that the debug version is larger than the release version because the debug version includes debugging information.
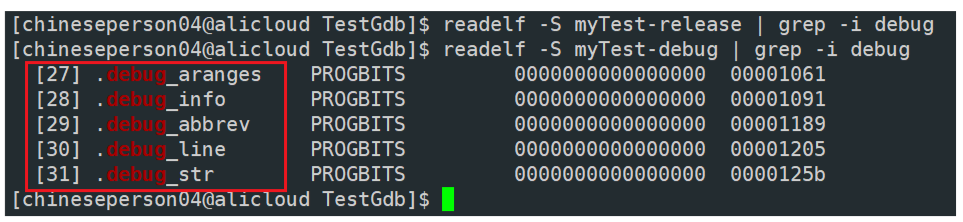
The executable program format we create in Linux is Executable and Linkable Format (ELF format). In Linux, readelf is a tool used to display ELF file information, and we can use the readelf command to filter out debugging information through piping.
We find that there is no debugging information in the release version, while the debug version contains debugging information.
3. Using GDB
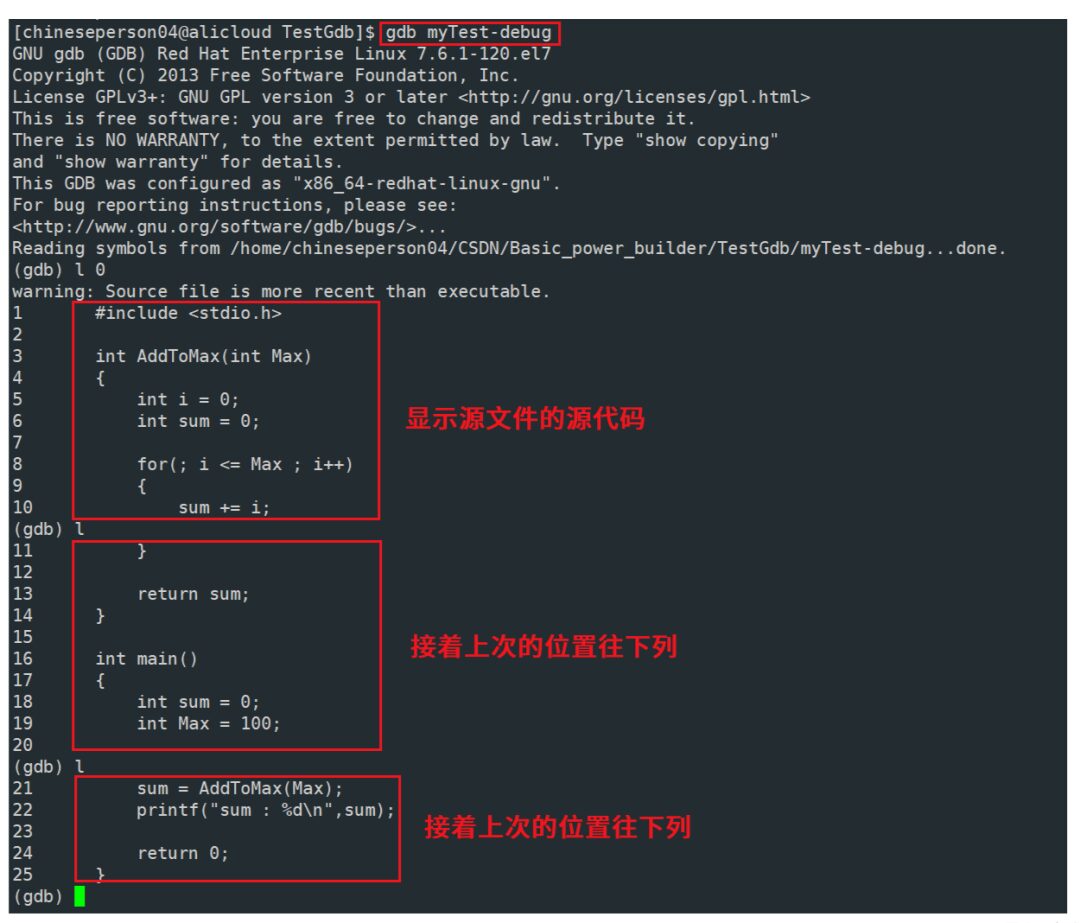
gdb filename: Enter Debugging
list/l line number: Displays source code from the input line, continuing from the last position downwards, displaying 10 lines at a time. If no line number is input, gdb will start displaying source code based on context.
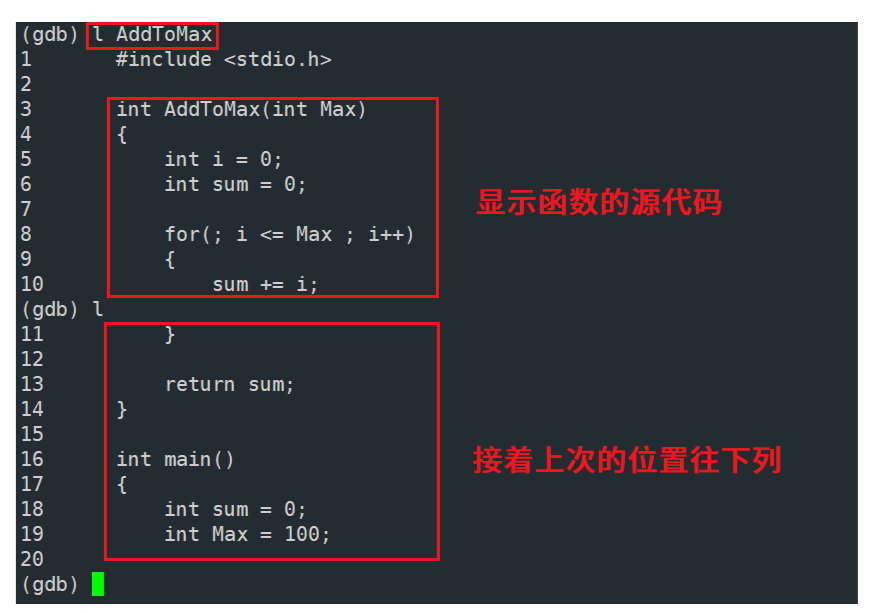
list/l function name: Displays the source code of the function.
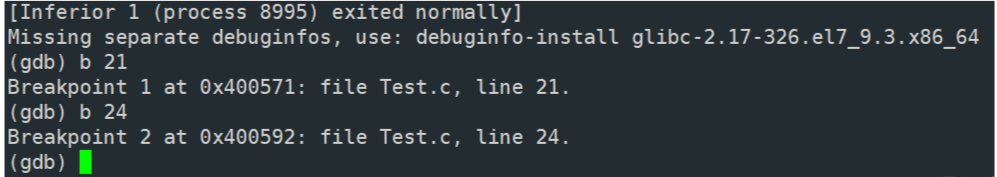
break(b) line number: Set a breakpoint at a specific line
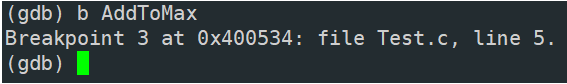
break function name: Set a breakpoint at the beginning of a function
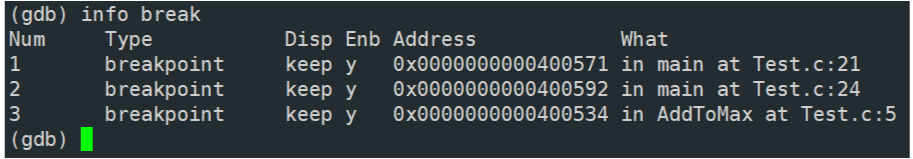
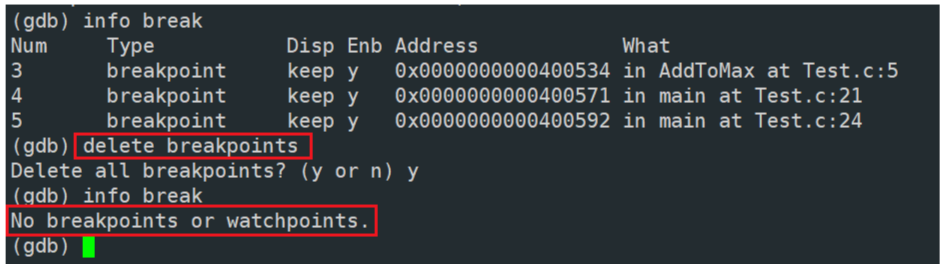
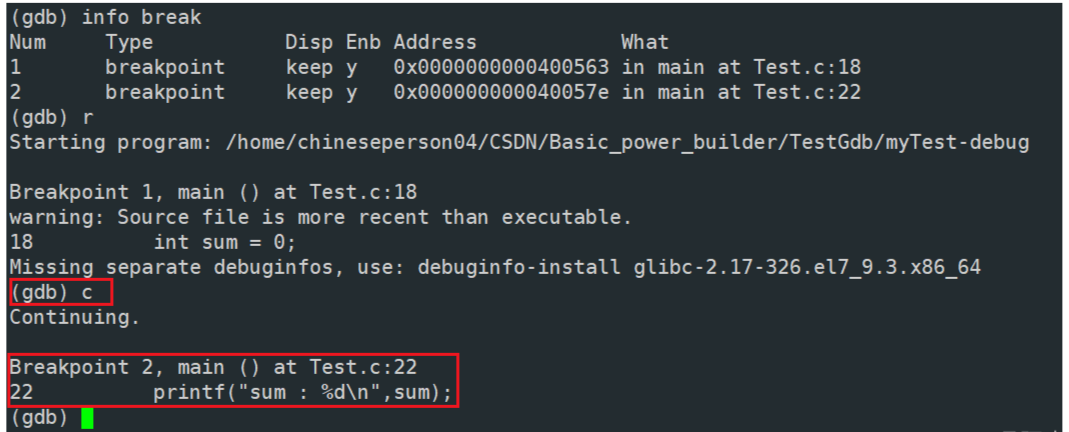
info(i) break(or breakpoints): View breakpoint information.
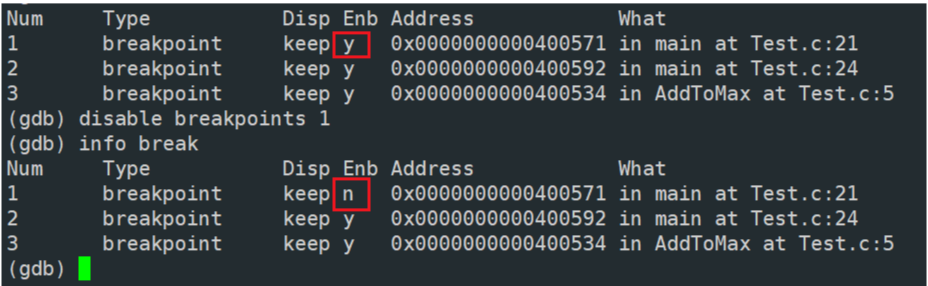
disable breakpoints n: Disable breakpoint number n
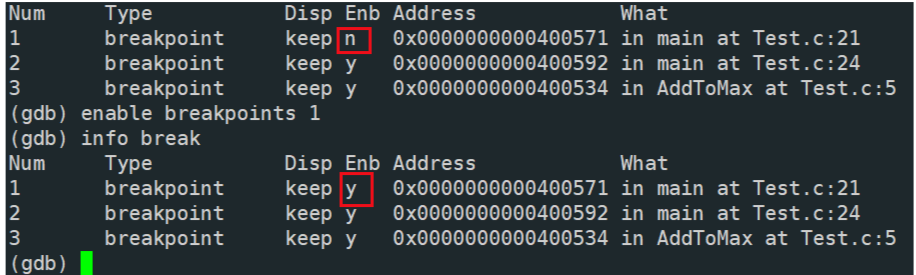
enable breakpoints n: Enable breakpoint number n
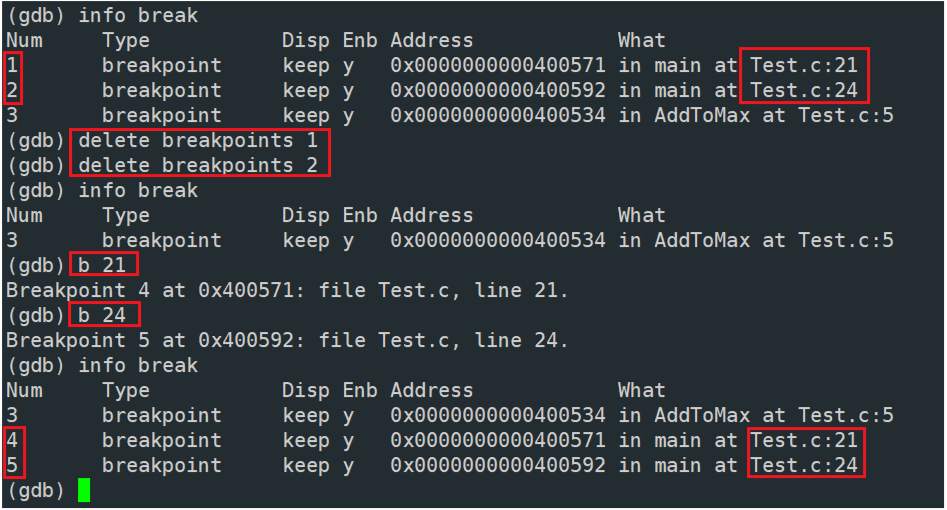
delete(d) breakpoints n: Delete breakpoint number n; the breakpoint numbers increase linearly and will not decrease even if earlier breakpoints are deleted.
delete(d) breakpoints: Delete all breakpoints
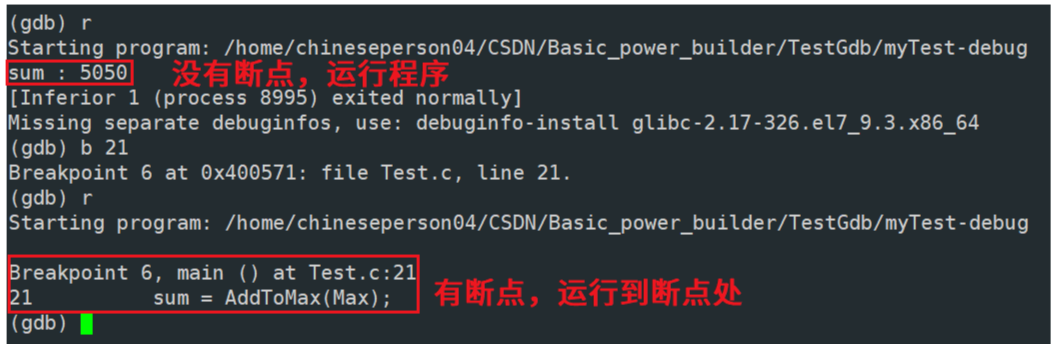
r or run: Run the program when there are no breakpoints, or run up to the breakpoint when breakpoints are present.
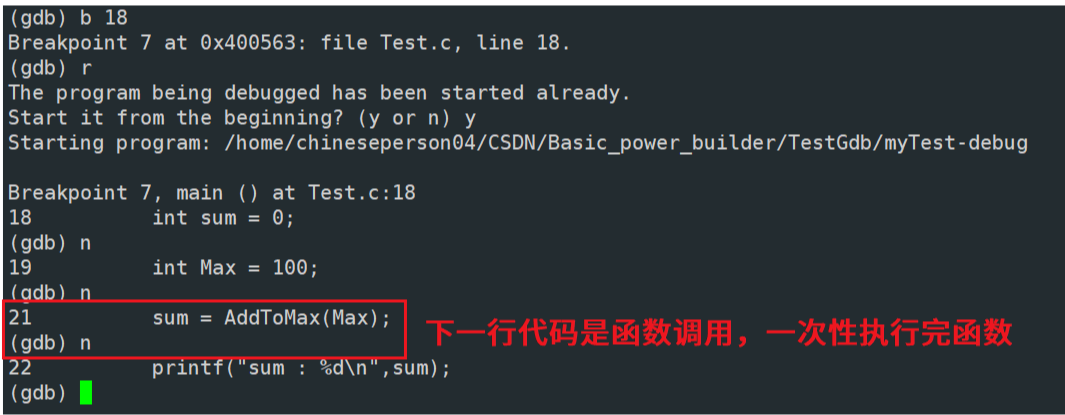
n or next: Step debugging, when using the n command for step debugging, gdb executes the next line of code. If the next line is a function call, it displays the result of the function call at once but does not step into the function line by line.
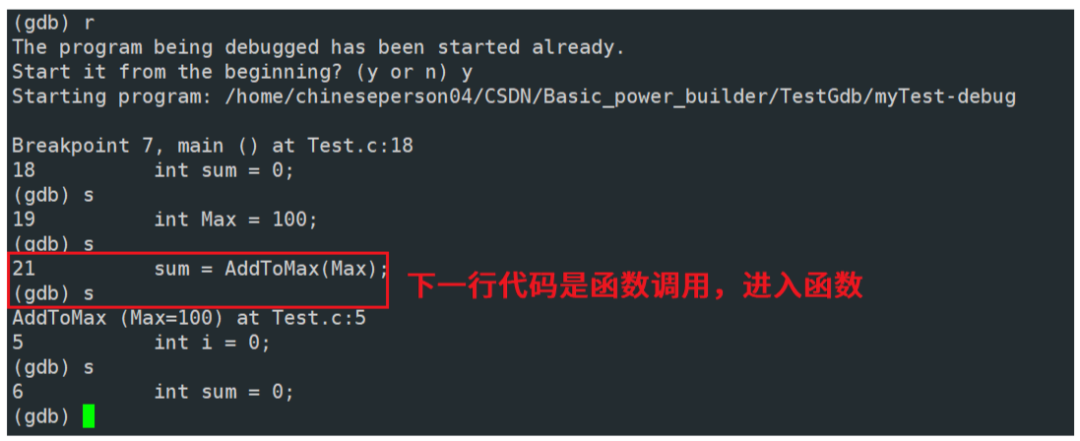
s or step: Step debugging, when using the s command for step debugging, gdb similarly executes the next line of code. However, if the next line is a function call, the s command enters the function and executes line by line starting from the first statement of the function.
finish: Execute until the current function returns, then wait for the next command
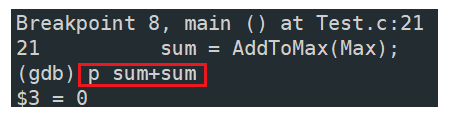
print ( p ): Print the value of the expression; through the expression you can modify the value of variables or call functions

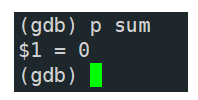
p variable: Print the value of the variable.
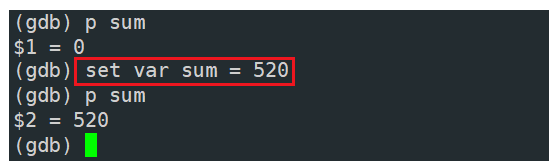
set var: Modify the value of the variable
continue(or c): Continue executing the debugged program until the next breakpoint, the program ends, or encounters other events that cause the program to stop.
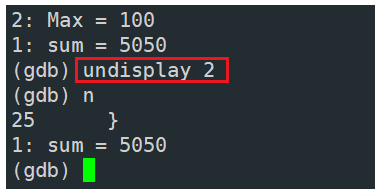
display variable name: Track a variable, displaying its value each time it stops
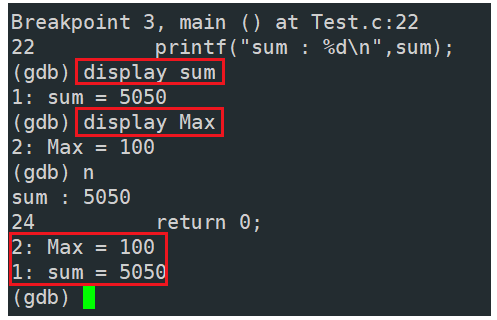
undisplay n: Cancel tracking of the variable with number n
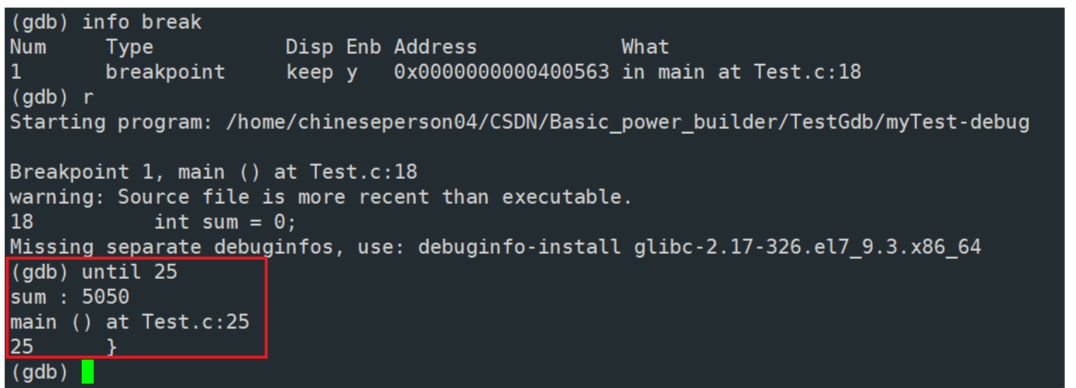
until: Mainly serves to continue executing the program until the return point of the current stack frame (usually the current function) or until the next breakpoint is encountered.
until n: n is a line number; this command will make the program run until it stops at line n.
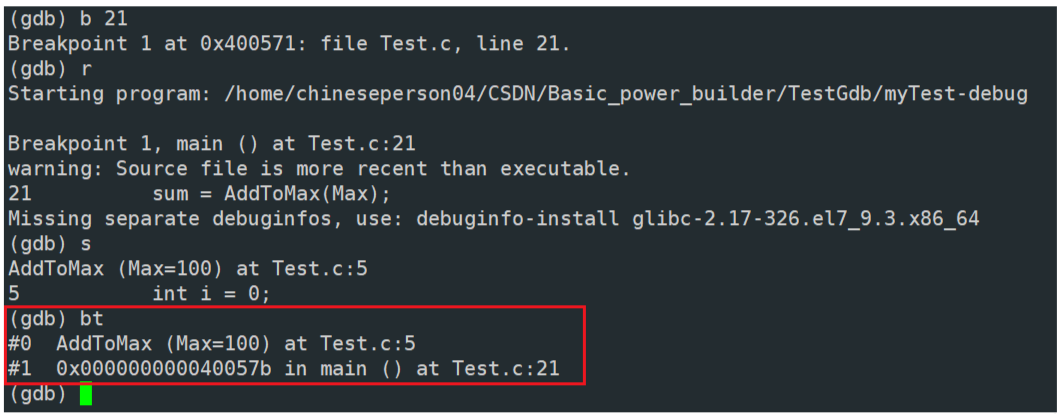
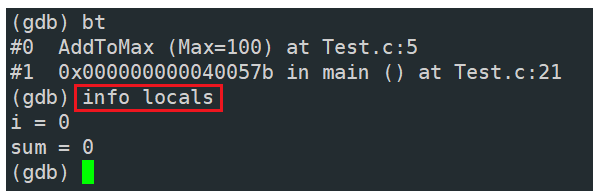
breaktrace(or bt): View the various levels of function calls and parameters
info (i) locals: View the values of local variables in the current stack frame
quit (q): Exit gdb

For course inquiries, add: HCIE666CCIE
↑ Or scan the QR code above ↑
If you have any technical points or content you want to see
You can leave a message below to let us know!