Click on the above “Embedded Miscellany” to select “Top Public Account” to view embedded notes at the first time!

In embedded software development, the most commonly used debugging methods are: log printing debugging and online debugging. Related articles on log printing debugging: Can’t solve the bug? Use the logging method.
When developing STM32, we have an IDE available, which already integrates a debugger, making it very convenient to use with a simulator. However, in Linux application development, gdb is often used directly from the command line for debugging, or we can use VSCode + gdb for debugging.
Related articles on gdb debugging: GDB Debugger is Actually That Simple
So how do we debug ARM programs on the development board in embedded Linux?
We can use <span>VSCode + gdb + gdbserver</span> to debug ARM programs on our ARM development board. Below is a brief introduction to the usage method, provided that the development board and PC can communicate wirelessly/wired. Related articles: A Summary Review of WiFi Driver Porting
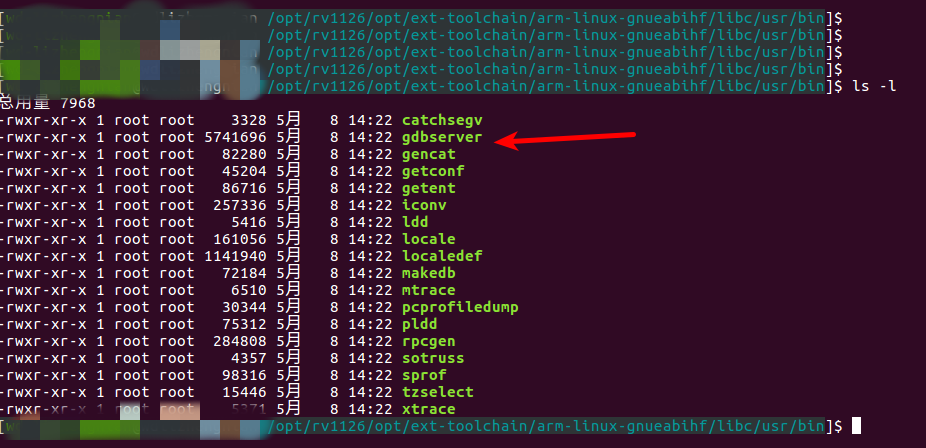
1. Prepare ARM format gdb and gdbserver tools
These are generally included in the cross-compilation toolchain; if not, you need to download the gdb source code for cross-compilation. GDB source code download link:
http://www.gnu.org/software/gdb/download/
Articles related to cross-compilation:
Essentials | Using protobuf-c on Embedded Platforms
Practical | A Simple Use Case of a High-Performance Communication Library
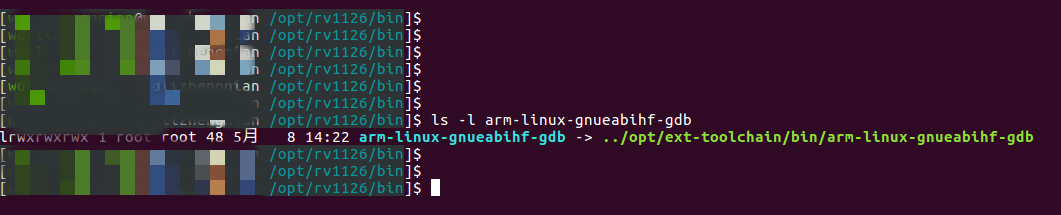
Here, I am using gdb and gdbserver from the cross-compilation toolchain, such as:
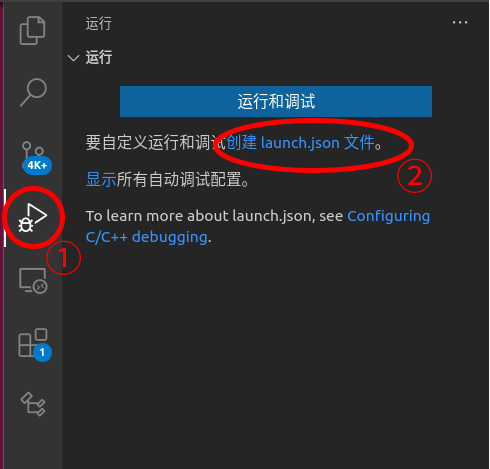
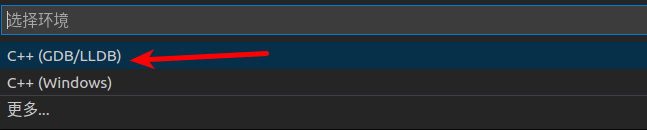
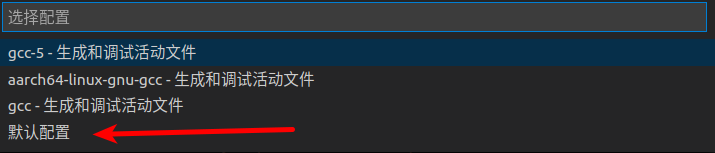
2. Create and modify the launch.json file
We need to create a vscode launch.json file and make some modifications:
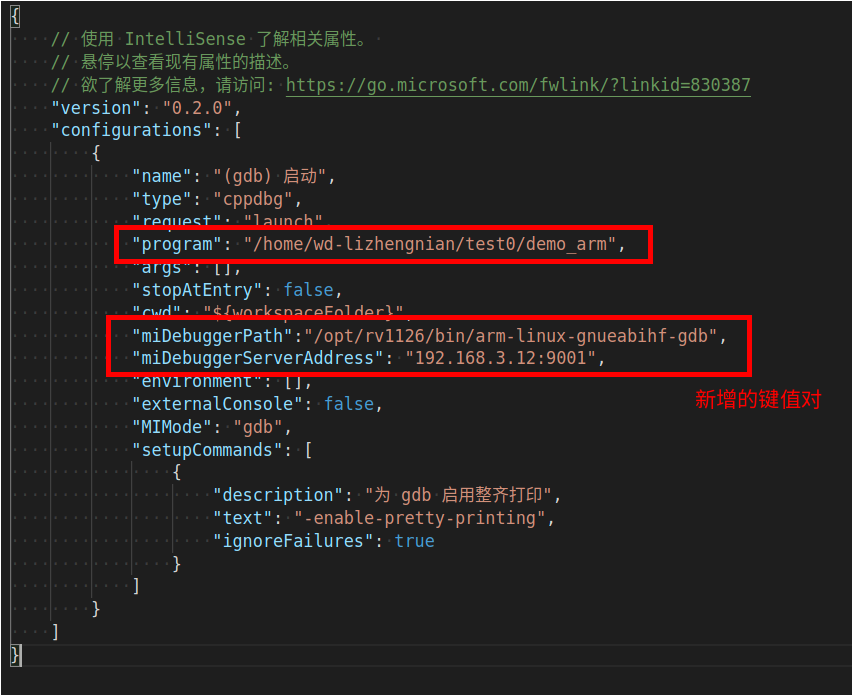
Among them, we need to modify “program”, which is the program we need to debug, i.e., the program we have cross-compiled. We also need to add the following two key-value pairs:
"miDebuggerPath":"/opt/rv1126/bin/arm-linux-gnueabihf-gdb"
"miDebuggerServerAddress":"192.168.3.12:9001"
Here, miDebuggerPath indicates the path of the ARM format gdb; miDebuggerServerAddress indicates the address of our server side, e.g., 192.168.3.12 is the IP of the development board, and 9001 is the port number, which can be set freely within the range of 0~65536. Ports in the range of 0~1023 are generally assigned by the system to specific service programs.
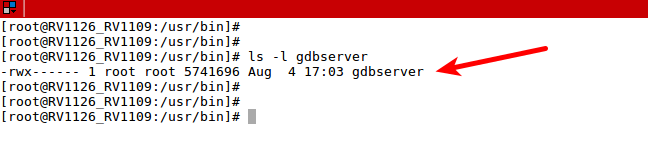
3. Transfer gdbserver to the development board
We need to transfer the gdbserver from the path of the cross-compiler to the development board, for example, I placed it in the /usr/bin path of the development board:
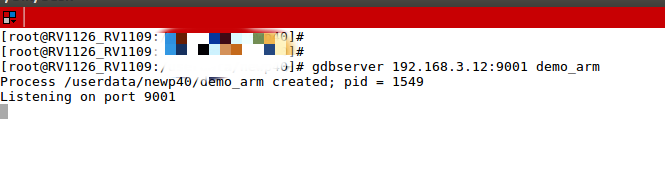
4. Start gdbserver
We first need to start gdbserver on the development board so that the PC can connect for debugging. The format is:
gdbserver development_board_ip:port_number program_to_debug
For example:
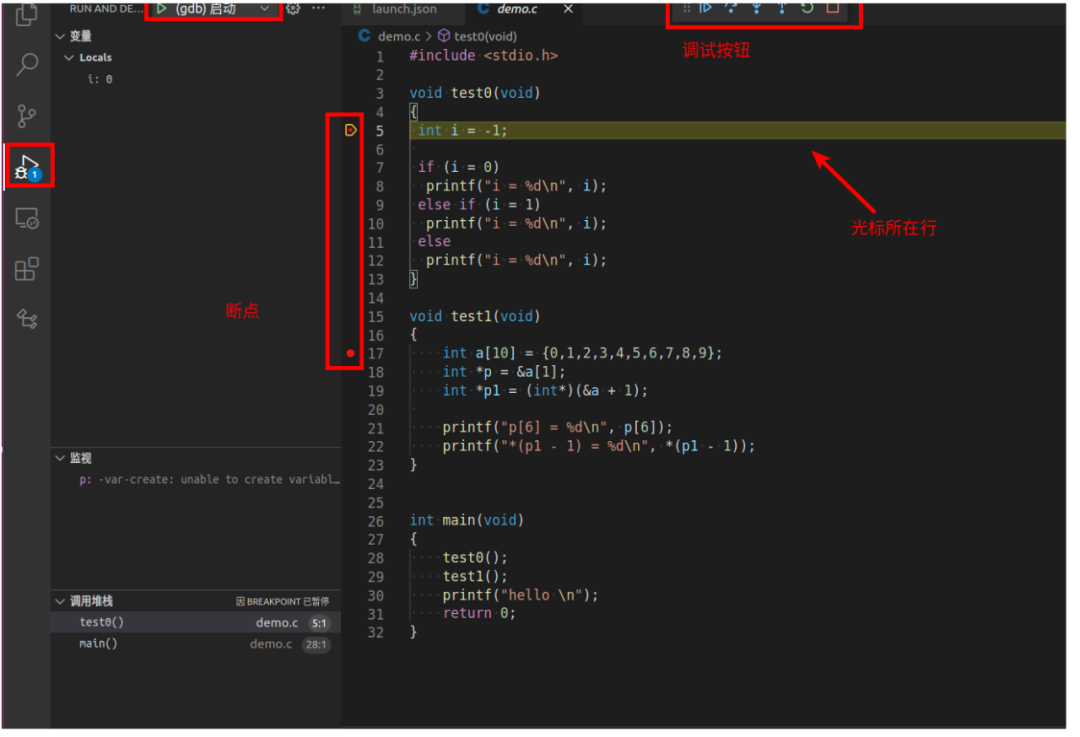
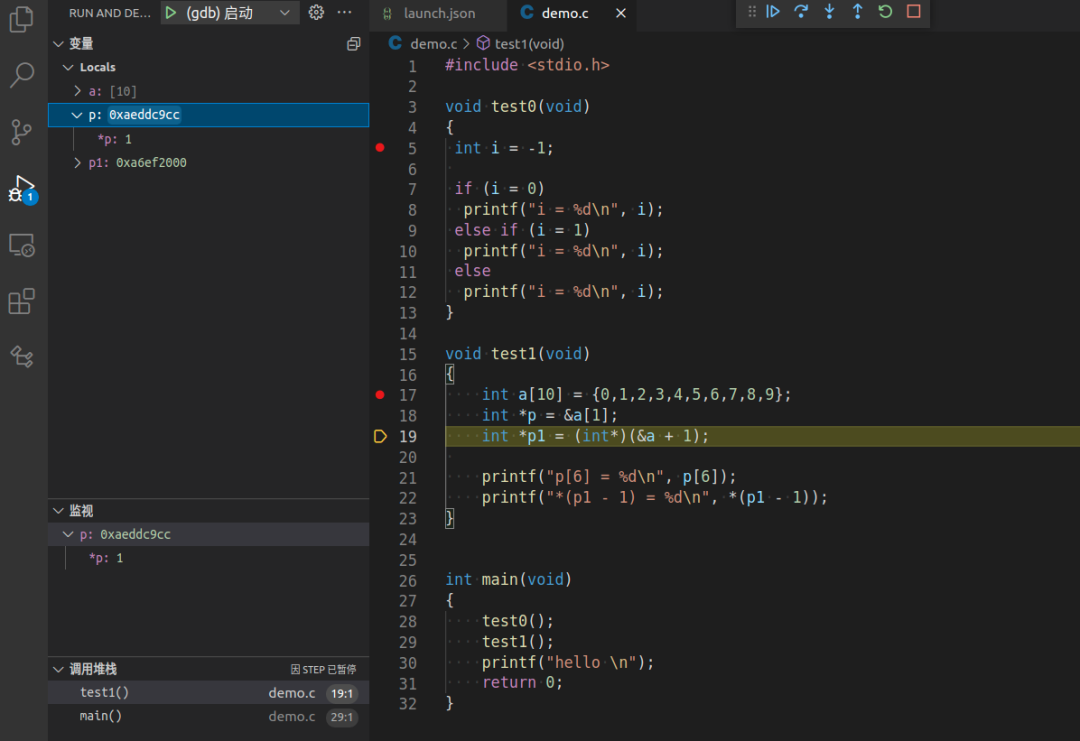
5. Start gdb in vscode for debugging
Finally, start gdb in vscode to begin debugging. For example:
This concludes our sharing for today.
Writing is not easy; if this article has helped you, please support us with a like and a follow. Thank you, everyone!
Friendly Reminder
Due to recent changes in the WeChat public account’s push rules, if you want to see our articles regularly, please click “Like” or “View” at the bottom of the page after reading each time, so that the articles pushed each time will appear in your subscription list at the first time.
You might also like:
Selected Articles from Embedded Miscellany
Sharing 10 Interesting C Language Interview Questions and Answers
A Summary Review of WiFi Driver Porting
Essentials | Analyzing the Relationship Between gcc, arm-linux-gcc, and arm-elf-gcc
Chip Shortage: How to Quickly Get Started and Replace an MCU
Sharing an Efficient Learning Method from an Embedded Senior
Reply with 1024 in the public account chat interface to obtain embedded resources; reply with m to view the article summary.