1. Introduction to MultiQC
The advancement of NGS technology has spawned new experimental designs, analysis types, and the generation of high-throughput sequencing data. For the quality assessment of these data, evaluating the results at each step of the analysis is crucial for ensuring the reliability of subsequent results. Many bioinformatics tools can generate evaluation results for samples, such as FastQC, Qualimap, and RSeQC (39 transcriptome analysis tools, 120 combinations of assessments). However, a problem arises: almost all quality control tools generate a report for a single sample, requiring users to check each QC result one by one. This is undoubtedly a very time-consuming, repetitive, and complex task, and it does not allow for a quick comparison of all samples.
So, is it possible to integrate all quality control results together? One could write a program to reinvent the wheel (which we did previously). But now, with MultiQC, a small tool based on Python, this cumbersome task is effectively solved. Its powerful features mainly manifest in the following three aspects:
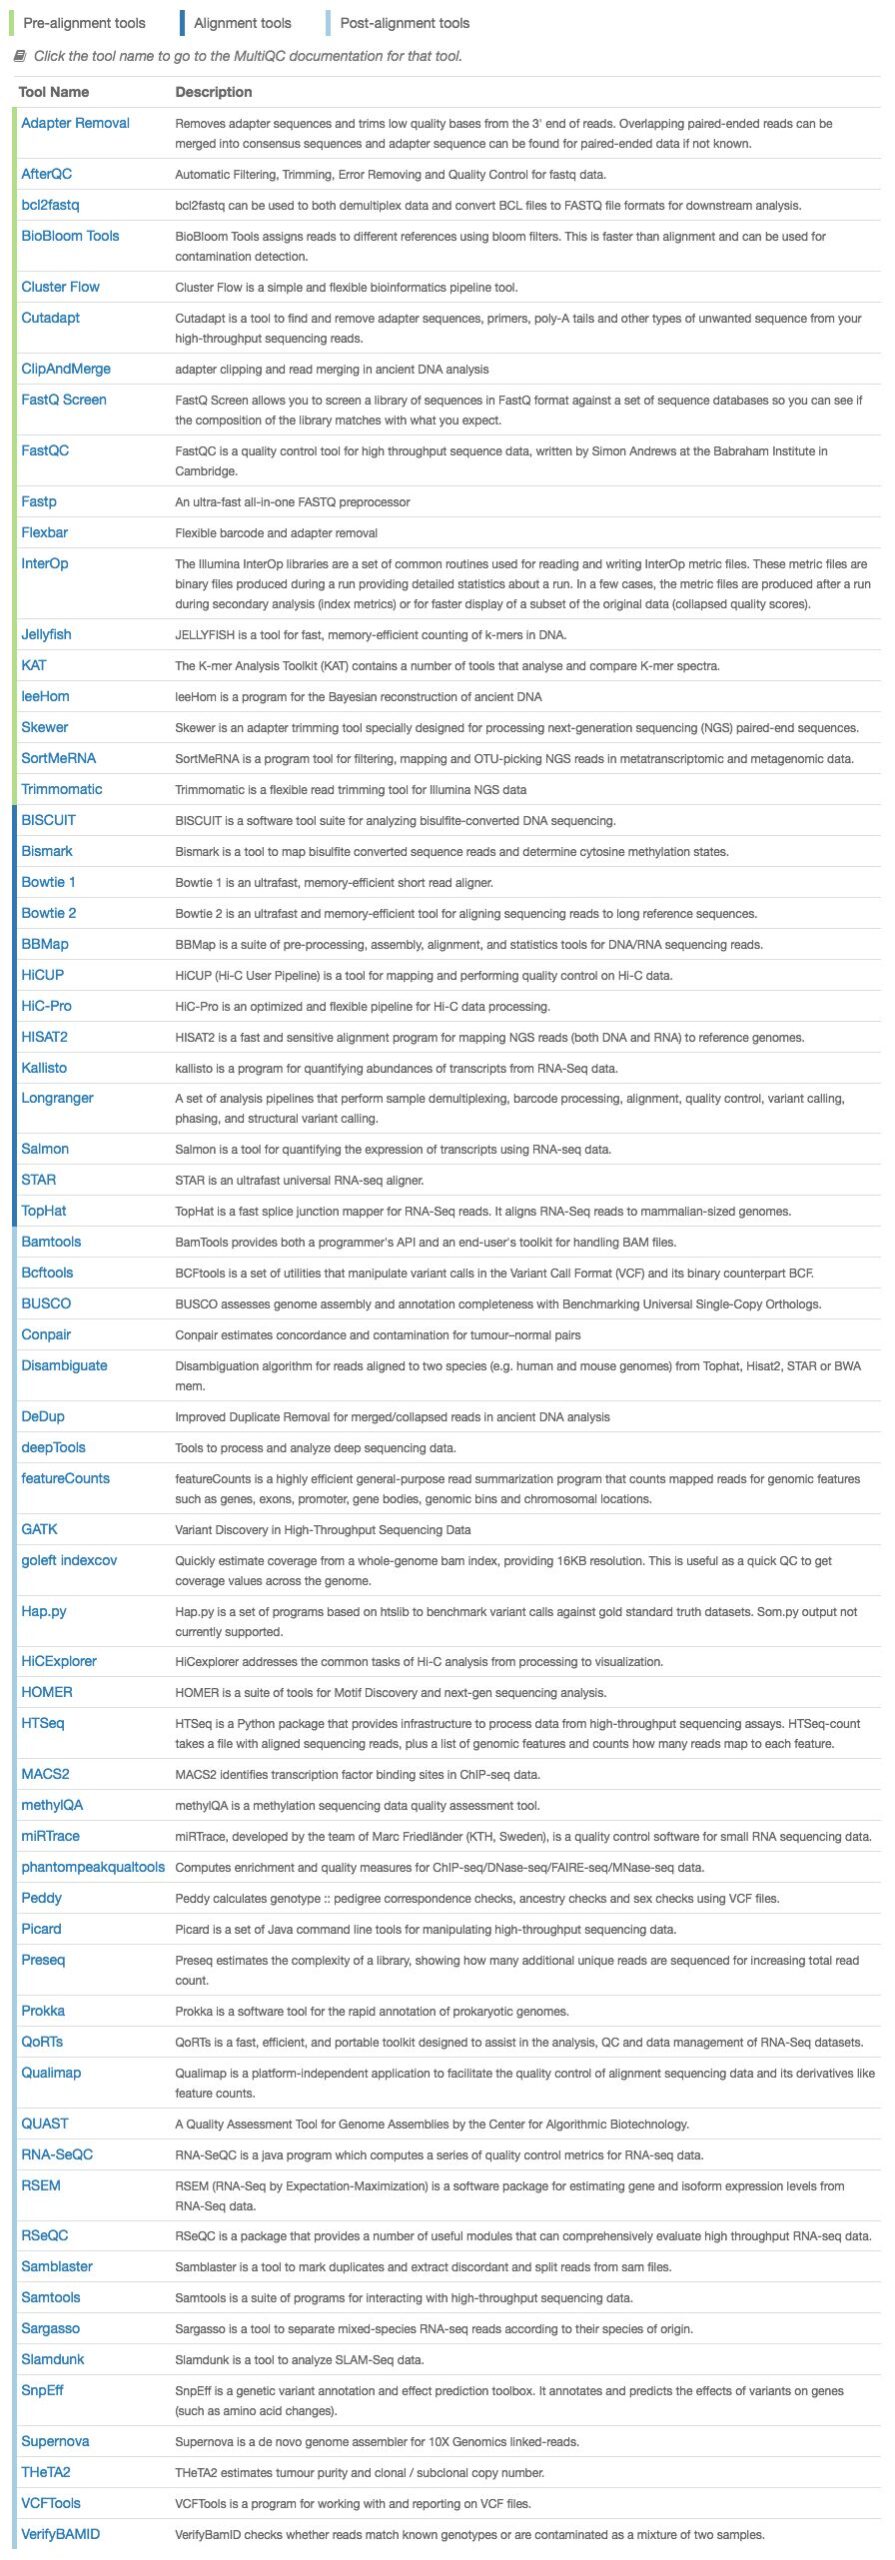
1) It can integrate multiple QC results of sequencing data into a single interactive HTML report, and can also export a PDF file; 2) It supports viewing QC results for various analysis types, such as: RNAseq, Whole-Genome Seq, Bisulfite Seq, Hi-C, and MultiQC_NGI; 3) It supports integrating results from 68 software analyses, and the list of supported software is continuously increasing. Users can also write their own plugins, as shown in the figure below.
2. Installing MultiQC
Requires python 2.7+, 3.4+, or 3.5+
# Install with pip
pip install git+https://github.com/ewels/MultiQC.git  #Installation with pip
# Install with conda
conda install -c bioconda multiqc  # Installing with conda
3. Running MultiQC
Simply specify the file path that MultiQC needs to analyze. If the data is in the current directory, just enter multiqc ..
multiqc .
multiqc data/
multiqc data/ ../proj_one/analysis/ /tmp/results
multiqc data/*_fastqc.zip
multiqc data/sample_1*
Use --ignore to ignore certain files
multiqc . --ignore *_R2*
multiqc . --ignore run_two/
multiqc . --ignore */run_three/*/fastqc/*_R2.zip
4. Interpreting MultiQC Reports (Using RNA-Seq Data as an Example)
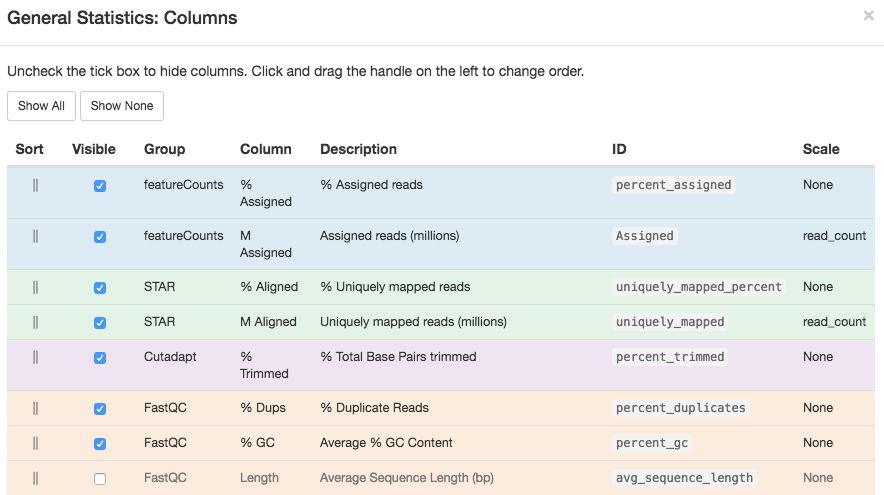
1. General Statistics A summary table integrating the read counts and quality assessments at the alignment level for each sample. Click Configure Columns to choose which items to display or hide. Click Plot to generate plots.
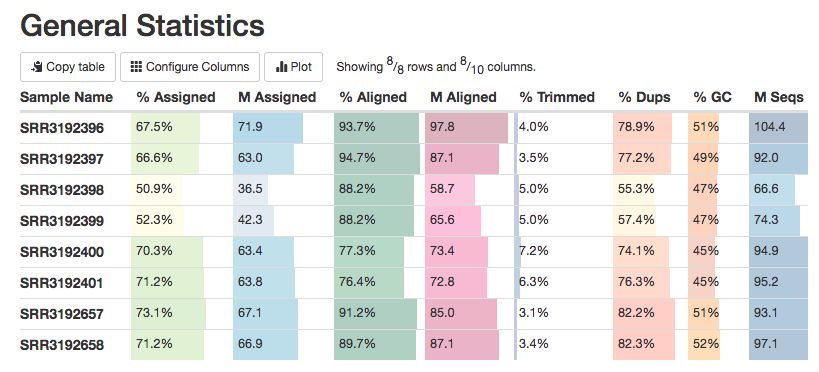
Click Configure Columns to choose which items to display
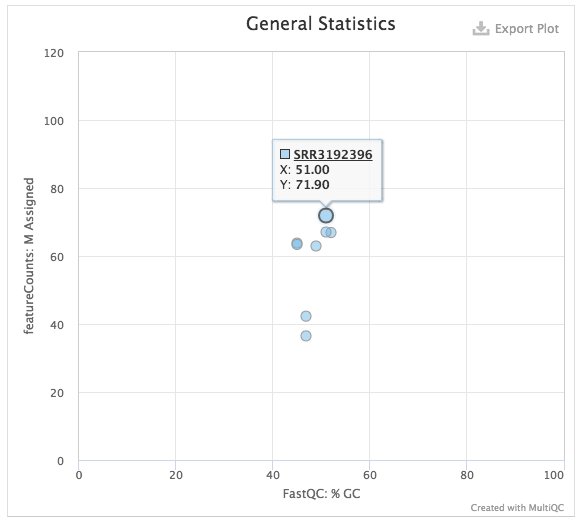
Click Plot to create an interactive 2D plot of any two attributes’ assessment results. If the samples are homogeneous, the scatter points will be closely grouped; otherwise, there will be some scattered points, making it easy to identify outlier samples with abnormal metrics.
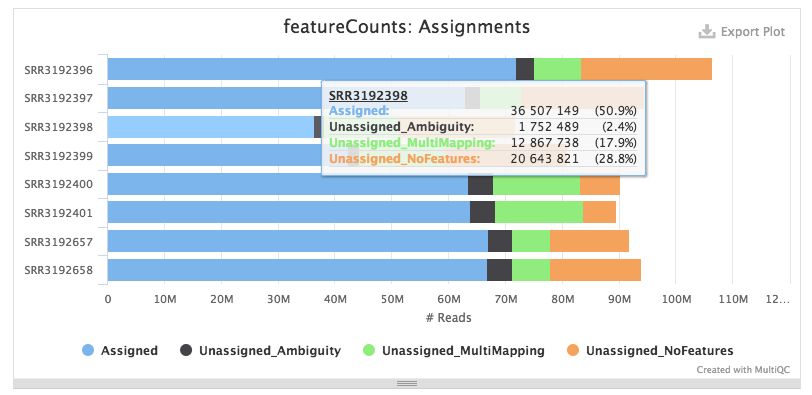
2. featureCounts
The results of using featureCounts to calculate the read counts for each gene’s exons are displayed. featureCounts not only supports quantification of genes but also of exons, gene bodies, genomic bins, and chromosomal locations. A similar software is HTSeq.
Official website: http://bioinf.wehi.edu.au/featureCounts/
3. STAR
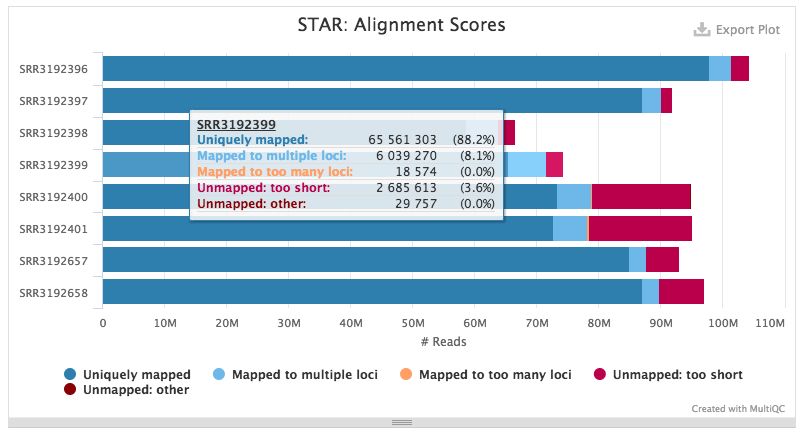
Analysis results based on the STAR alignment tool. STAR will discard reads without paired mapping to avoid aligning single reads to the genome; it also has a high tolerance for lower-quality alignments (using more soft-clipped and mismatched bases).
Official website: https://github.com/alexdobin/STAR
For more comparative analysis tools, see: A Comparison of Transcriptome Analysis Tools
4. Cutadapt
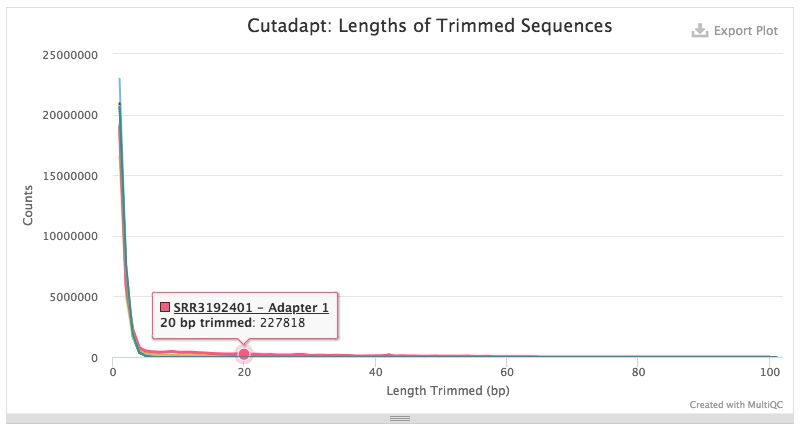
Using the cutadapt software to preprocess paired-end sequencing data, removing adapters and low-quality bases.
When filtering sequencing data, cutadapt identifies, trims, and removes adapters, primers, poly-A sequences, and other sequences, removing the parts of reads contaminated by adapters (due to insufficient insert fragment length, the sequencer reads the sequencing primer sequences, etc.). For more details, see NGS Basics – Principles of High-Throughput Sequencing.
Official website: https://cutadapt.readthedocs.io/en/stable/
5. FastQC
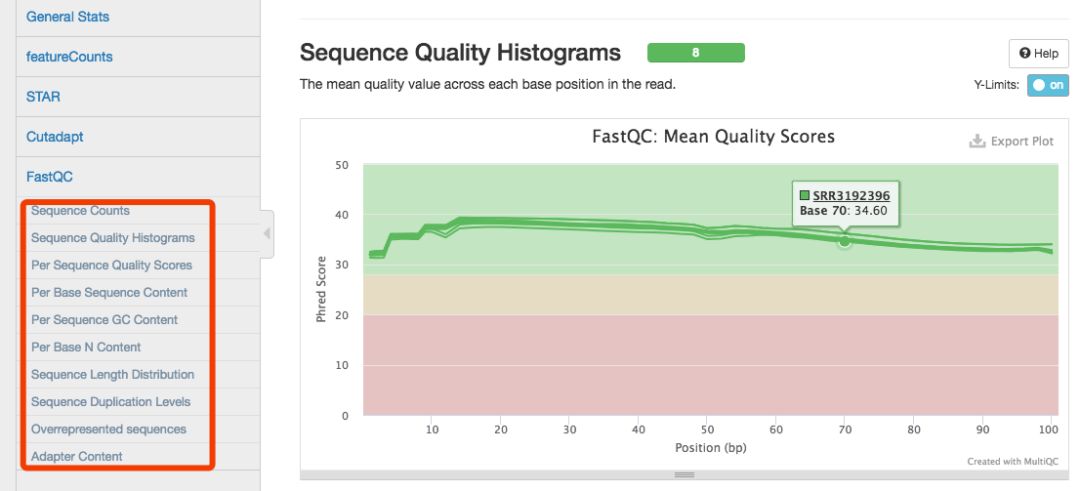
MultiQC integrates the ten results obtained from the fastqc tool into a single module for centralized viewing.
Official website: http://www.bioinformatics.babraham.ac.uk/projects/fastqc/
For specific interpretations of FastQC reports, see the historical post: NGS Basics – Explanation of FASTQ Format and Quality Assessment.
The customizability of MultiQC is also quite strong, and many more features are worth exploring.
Transcriptome Research
-
39 transcriptome analysis tools, 120 combinations of assessments (Which Transcriptome Analysis Tool is Strong – Introductory Version)
-
39 transcriptome analysis tools, 120 combinations of assessments (A Comparison of Transcriptome Analysis Tools (Complete Translation Version))
-
Evaluation and process demonstration of non-reference transcriptome analysis tools
-
120-point transcriptome exam (First Answer)
-
120-point transcriptome exam (Second Answer)
-
120-point transcriptome exam (Third Answer)
-
DESeq2 differential gene analysis and batch effect removal
NGS Basics and Software Applications
-
NGS Basics – Explanation of FASTQ Format and Quality Assessment
-
NGS Basics – Principles of High-Throughput Sequencing
-
NGS Basics – Reference Genome and Gene Annotation Files
-
NGS Basics – Interpretation and Conversion of GTF/GFF File Formats
-
NGS Basics – Downloading Raw Sequencing Data
-
Locally Install UCSC Genome Browser
-
Visualization of Sequencing Data (Part One)
-
IGV Genome Browser for Visualizing High-Throughput Sequencing Data
-
Essential for High-Throughput Data Analysis – Introduction to Genome Browser Usage – 1
-
Essential for High-Throughput Data Analysis – Introduction to Genome Browser Usage – 2
-
Essential for High-Throughput Data Analysis – Introduction to Genome Browser Usage – 3
-
Where to Upload Sequencing Article Data
-
GO and GSEA Enrichment Analysis All in One
-
GSEA Enrichment Analysis – Interface Operation
-
Introduction to Bedtools Usage
-
OrthoMCL Identification of Species Homologous Genes (Installation + Usage)
-
Rfam 12.0+ Local Usage (Latest Tutorial)
-
Easy Drawing of Various Venn Diagrams
-
ETE Construction and Drawing of Phylogenetic Trees
-
psRobot: Plant Small RNA Analysis System
-
Bioinformatics Software Series – Using NCBI
-
Going East, the Best Online GO Enrichment Analysis Tool
-
2018 Upgraded Version of Motif Database Jaspar
-
A Guide to Finding Gene Promoters, UTRs, TSSs, and Predicting Transcription Factor Binding Sites
-
Don’t Know What to Do with Genes? Start with Gene Enrichment Analysis!
-
Research Newbies, Master These Skills, Easily Navigate Various Genes!
-
How to Predict Intrinsically Disordered Regions (IDRs) Causing Phase Transitions? Track Hotspots to Enhance Article Quality!
-
If You Often Use PubMed, This Plugin Will Be Very Useful!
-
What to Do If You Can’t Afford KEGG? REACTOME is a Stronger Open-Source Pathway
-
A Beautiful Professor Takes You to View Transcriptome Analysis from a Statistical Perspective
-
I Want to Do Pathway Analysis, But I Just Don’t Want to Learn Programming
-
In-Depth Article – Single Base Editing Technology Tools
More Reading
Drawing Essentials Bioinformatics Videos Bioinformatics Series Tutorials
Insights Cancer Databases Linux Python
High-Throughput Analysis Online Drawing Sequencing History Super Enhancers
Training Videos PPT EXCEL Article Writing ggplot2
Hai Ge Omics Visualization Techniques Genome Browser
Color Matching Graphic Layout Interaction Networks
Yishengxin 2019 Course, Discount for Group Enrollment


Reply in the background with “Bioinformatics Toolkit Benefits – First Wave” to get the tutorial collection