As the title suggests, let’s get started. First, prepare the program as follows:
#include <iostream>
#include <csignal>
#include <atomic>
std::atomic<int> running(1);
void signalHandler(int signal) {
    std::cout << "Received signal " << signal << std::endl;
    running = 0;
}
int main() {
    signal(SIGTERM, signalHandler);
    while(running.load()) {
    }
    std::cout << "End" << std::endl;
    return 0;
}
After compiling the executable file, start debugging with gdb. When gdb has not yet run the program under test, you can see a gdb ./test process using the ps command. Note not to send signals to it.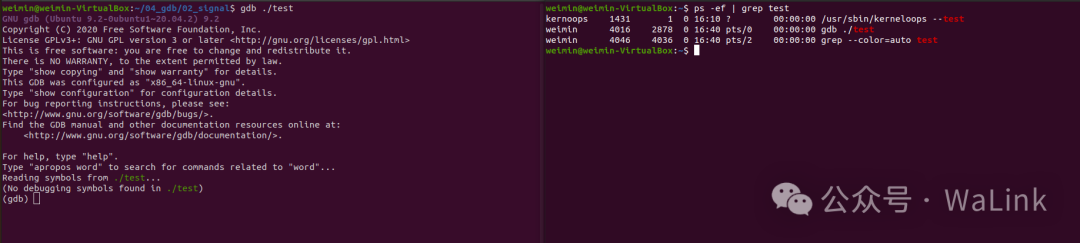 Next, configure signal handling in gdb with the following command:
handle {signal} stop/nostop print/noprint pass/nopassThe functions of each configuration item are as follows:stop: gdb will pause the program under test when the signal occurs (nostop does the opposite)print: gdb will display signal information when the signal occurs (noprint does the opposite)pass: gdb will pass the signal to the program when it occurs (nopass does the opposite)Here, configure the SIGTERM signal as nostop, print, pass with the following command.
handle SIGTERM nostop print pass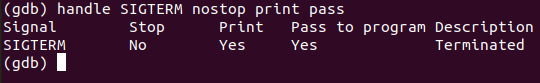 Next, run the program under test in gdb with the command:
run or rThen, using the ps command, you can see an additional process under test, as shown in the figure below. The PID in the manual signal kill -x {PID} should be selected from this process.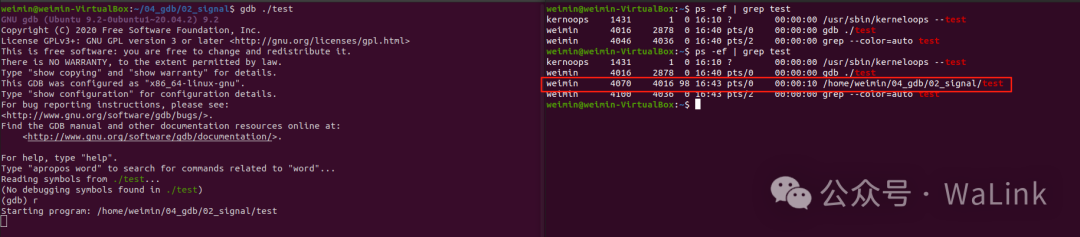 Here, use the following command to trigger the signal.
kill -15 4070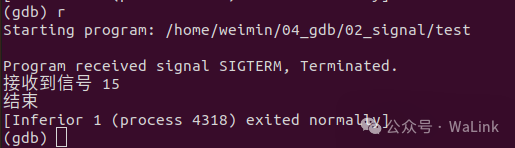 Now you can see the program’s print information in the signal handling callback in gdb.There is also a way to combine the command to query the PID and send the signal into one line:
pidof {process_name} | xargs kill -{signal_value}For example:
pidof /home/weimin/04_gdb/02_signal/test | xargs kill -15